Exam 2: Describing Data: Frequency Tables, Frequency Distributions, and Graphic Presentation
Exam 1: What Is Statistics79 Questions
Exam 2: Describing Data: Frequency Tables, Frequency Distributions, and Graphic Presentation129 Questions
Exam 3: Describing Data: Numerical Measures132 Questions
Exam 4: Describing Data: Displaying and Exploring Data108 Questions
Exam 5: A Survey of Probability Concepts130 Questions
Exam 6: Discrete Probability Distributions128 Questions
Exam 7: Continuous Probability Distributions131 Questions
Exam 8: Sampling Methods and the Central Limit Theorem115 Questions
Exam 9: Estimation and Confidence Intervals129 Questions
Exam 10: One-Sample Tests of Hypothesis134 Questions
Exam 11: Two-Sample Tests of Hypothesis130 Questions
Exam 12: Analysis of Variance128 Questions
Exam 13: Correlation and Linear Regression130 Questions
Exam 14: Multiple Regression Analysis129 Questions
Exam 15: Index Numbers129 Questions
Exam 16: Time Series and Forecasting129 Questions
Exam 17: Nonparametric Methods: Goodness-Of-Fit Tests129 Questions
Exam 18: Nonparametric Methods: Analysis of Ranked Data129 Questions
Exam 19: Statistical Process Control and Quality Management129 Questions
Exam 20: An Introduction to Decision Theory115 Questions
Select questions type
Refer to the following wage breakdown for a garment factory. 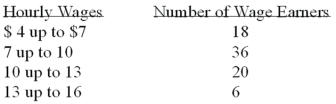 What is the class interval for the table of wages above?
Free
(Multiple Choice)
4.8/5  (37)
(37)
Correct Answer: Verified
B
Refer to the following breakdown of responses to a survey of "Are you concerned about being tracked while connected to the Internet"? 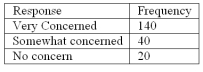 What is the class interval for the frequency table above?
Free
(Multiple Choice)
5.0/5 (37)
Correct Answer:Verified
D
In a frequency distribution, the number of observations in a class is called class
Free
(Multiple Choice)
4.8/5 (33)
Correct Answer:Verified
D
Refer to the following breakdown of responses to a survey of room service in a hotel. 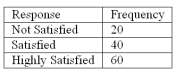 What type of chart should be used to show relative class frequencies?
(Multiple Choice)
4.9/5 (31)
A frequency distribution for nominal data requires that the categories be ___________________ and ______________________.
(Short Answer)
4.9/5 (33)
In constructing a frequency polygon, class frequencies are scaled on which axis? ______
(Short Answer)
4.8/5 (46)
Refer to the following distribution of ages: 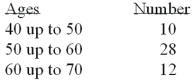 What is the class midpoint of the highest class?
(Multiple Choice)
4.9/5 (31)
A data set has 200 observations. In the data, a qualitative variable's highest value is "extremely satisfied" and its lowest value is "extremely dissatisfied". What is the minimum class interval that you would recommend? _____________
(Essay)
4.9/5 (33)
Refer to the following breakdown of responses to a survey of room cleanliness in a hotel. 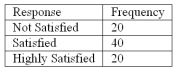 What is the class interval for the frequency table above?
(Essay)
4.8/5 (30)
For a frequency distribution of quantitative data, if every individual, object or measurement can be assigned to a class, the frequency distribution is ___________.
(Short Answer)
4.9/5 (30)
Refer to the following information from a frequency distribution for "heights of college women" recorded to the nearest inch: The first two class midpoints are 62.5" and 65.5".
What are the class limits for the lowest class?
(Multiple Choice)
4.9/5 (21)
A student was interested in the cigarette smoking habits of college students and collected data from an unbiased random sample of students. The data is summarized in the following table: 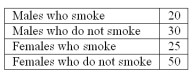 What type of chart best represents the frequency table?
(Multiple Choice)
4.8/5 (30)
Refer to the following breakdown of responses to a survey of "How confident are you that you saved enough to retire"? 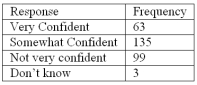 What percent of the responses indicated that users were very confident?
(Multiple Choice)
5.0/5 (36)
Refer to the following breakdown of responses to a survey of room cleanliness in a hotel. 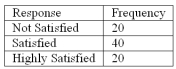 What is the class with the greatest frequency?
(Short Answer)
4.7/5 (31)
For a frequency distribution of qualitative data, if the observations can be assigned to only one class, the classes are ___________________________.
(Short Answer)
4.9/5 (31)
To construct a pie chart, relative class frequencies are used to graph the "slices" of the pie.
(True/False)
4.9/5 (31)
The following frequency distribution shows the distribution of delivery times (in days) for swimstuff.com customer orders during the last month. 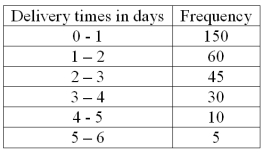 How many orders were delivered from 1 day up to 3 days?
(Short Answer)
4.7/5 (36)
Refer to the following distribution:  What are the class limits for class with the highest frequency?
(Multiple Choice)
4.8/5 (27)
A ___________ is useful for displaying the relative frequency distribution for a nominal variable.
(Short Answer)
4.8/5 (31)
Filters
- Essay(0)
- Multiple Choice(0)
- Short Answer(0)
- True False(0)
- Matching(0)