Deck 19: Statistical Process Control and Quality Management
Full screen (f)
Question
Question
Question
Question
Question
Question
Question
Question
Question
Question
Question
Question
Question
Question
Question
Question
Question
Question
Question
Question
Question
Question
Question
Question
Question
Question
Question
Question
Question
Question
Question
Question
Question
Question
Question
Question
Question
Question
Question
Question
Question
Question
Question
Question
Question
Question
Question
Question
Question
Samples of 200 parts were taken every day and the number of defectives was counted. What are the upper and lower limits for the percent defective chart? 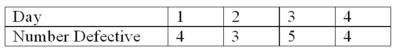
A) 0.02 and 0
B) 0.2970 and 0
C) 0.0297 and 0
D) 0.0497 and 0
A) 0.02 and 0
B) 0.2970 and 0
C) 0.0297 and 0
D) 0.0497 and 0
Question
Question
Question
Question
Question
Question
Question
Question
Question
Question
Question
Question
A new machine that fills tubes of toothpaste will be monitored using statistical process control. The following data were collected while the machine was closely monitored and under control. Each day a random sample of six tubes are weighed. Based on the data, the process mean is 6.752. 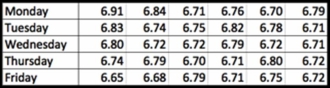 What is the lower control limit for the x-bar chart rounded to three decimal places?
A) 6.816
B) 6.676
C) 6.688
D) 6.828
What is the lower control limit for the x-bar chart rounded to three decimal places?A) 6.816
B) 6.676
C) 6.688
D) 6.828
Question
A new machine is set or calibrated to fill tubes of toothpaste at precisely 6.75 ounces. Then, once the machine is running, a sample of six tubes is taken every three hours and weighed with the following results: 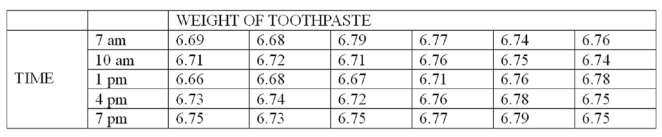 What is the value for the lower control limit (LCL) of the range?
A) 0.00
B) 0.080
C) 0.186
D) 0.203
What is the value for the lower control limit (LCL) of the range?A) 0.00
B) 0.080
C) 0.186
D) 0.203
Question
A new machine is set or calibrated to fill tubes of toothpaste at precisely 6.75 ounces. Then, once the machine is running, a sample of six tubes is taken every three hours and weighed with the following results: 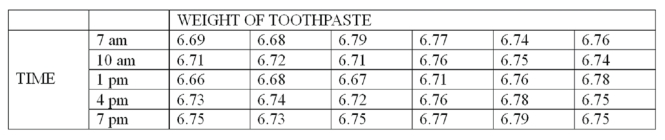 What is X-bar for 7 pm?
A) 6.71
B) 6.72
C) 6.74
D) 6.76
What is X-bar for 7 pm?A) 6.71
B) 6.72
C) 6.74
D) 6.76
Question
A new machine is set or calibrated to fill tubes of toothpaste at precisely 6.75 ounces. Then, once the machine is running, a sample of six tubes is taken every three hours and weighed with the following results: 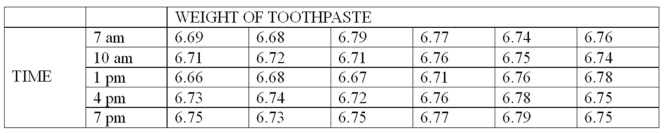 What is the range of the samples at 7 am?
A) 0.05
B) 0.06
C) 0.11
D) 0.12
What is the range of the samples at 7 am?A) 0.05
B) 0.06
C) 0.11
D) 0.12
Question
Question
A new machine is set or calibrated to fill tubes of toothpaste at precisely 6.75 ounces. Then, once the machine is running, a sample of six tubes is taken every three hours and weighed with the following results: 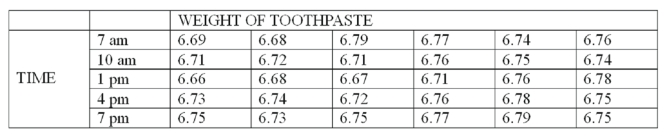 What is the value of the upper control factor of the range?
A) 0
B) 2.115
C) 2.004
D) 3.0
What is the value of the upper control factor of the range?A) 0
B) 2.115
C) 2.004
D) 3.0
Question
A new machine is set or calibrated to fill tubes of toothpaste at precisely 6.75 ounces. Then, once the machine is running, a sample of six tubes is taken every three hours and weighed with the following results:  What is X-bar for 7 am?
A) 6.72
B) 6.74
C) 6.78
D) 6.80
What is X-bar for 7 am?A) 6.72
B) 6.74
C) 6.78
D) 6.80
Question
Question
A new machine is set or calibrated to fill tubes of toothpaste at precisely 6.75 ounces. Then, once the machine is running, a sample of six tubes is taken every three hours and weighed with the following results: 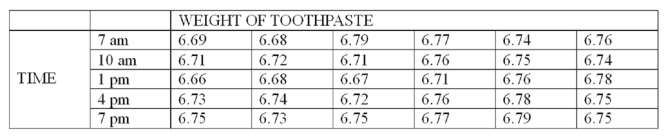 What is the value of A2, the control limit factor for averages?
A) 0
B) 1
C) 0.577
D) 0.483
What is the value of A2, the control limit factor for averages?A) 0
B) 1
C) 0.577
D) 0.483
Question
A new machine is set or calibrated to fill tubes of toothpaste at precisely 6.75 ounces. Then, once the machine is running, a sample of six tubes is taken every three hours and weighed with the following results: 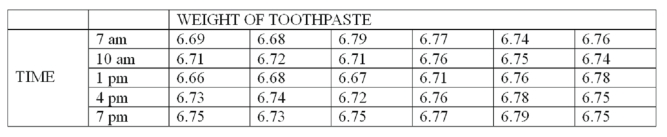 What is the upper control limit (UCL) for the mean?
A) 6.738
B) 6.999
C) 6.777
D) 7.221
What is the upper control limit (UCL) for the mean?A) 6.738
B) 6.999
C) 6.777
D) 7.221
Question
A new machine is set or calibrated to fill tubes of toothpaste at precisely 6.75 ounces. Then, once the machine is running, a sample of six tubes is taken every three hours and weighed with the following results: 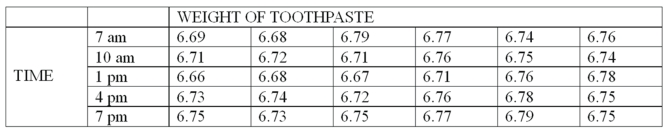 What is the mean range?
A) 0.000
B) 0.160
C) 0.080
D) 0.203
What is the mean range?A) 0.000
B) 0.160
C) 0.080
D) 0.203
Question
A new machine is set or calibrated to fill tubes of toothpaste at precisely 6.75 ounces. Then, once the machine is running, a sample of six tubes is taken every three hours and weighed with the following results: 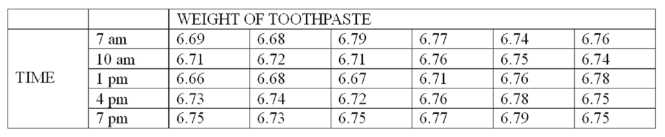 What is the range of the samples at 4 pm?
A) 0.05
B) 0.06
C) 0.11
D) 0.12
What is the range of the samples at 4 pm?A) 0.05
B) 0.06
C) 0.11
D) 0.12
Question
A new machine is set or calibrated to fill tubes of toothpaste at precisely 6.75 ounces. Then, once the machine is running, a sample of six tubes is taken every three hours and weighed with the following results:  What is the value of the lower control factor of the range?
A) 0
B) 2.115
C) 2.004
D) 3.0
What is the value of the lower control factor of the range?A) 0
B) 2.115
C) 2.004
D) 3.0
Question
Question
Question
Question
A new machine used in the production of motor mount bolts was put into operation. Five samples of size 100 were randomly selected and the number of defectives in each sample was noted. 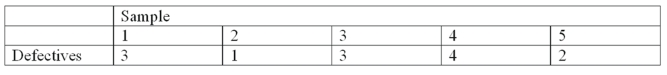 What is the lower control limit (LCL)?
A) 0%
B) -2.2%
C) 4.8%
D) 1.6%
What is the lower control limit (LCL)?A) 0%
B) -2.2%
C) 4.8%
D) 1.6%
Question
A new machine used in the production of motor mount bolts was put into operation. Five samples of size 100 were randomly selected and the number of defectives in each sample was noted. 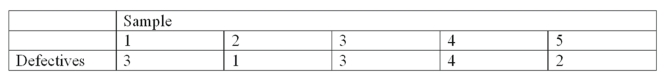 What is the upper control limit (UCL)?
A) 6.7%
B) 7.4%
C) 8.1%
D) 100%
What is the upper control limit (UCL)?A) 6.7%
B) 7.4%
C) 8.1%
D) 100%
Question
A new machine used in the production of motor mount bolts was put into operation. Five samples of size 100 were randomly selected and the number of defectives in each sample was noted. 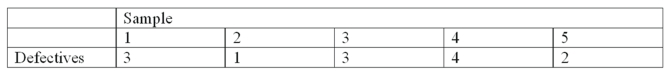 What is the average percent defective?
A) 2.0%
B) 2.3%
C) 2.6%
D) 2.9%
What is the average percent defective?A) 2.0%
B) 2.3%
C) 2.6%
D) 2.9%
Question

Unlock Deck
Sign up to unlock the cards in this deck!
Unlock Deck
Unlock Deck
1/136
Play
Full screen (f)
Deck 19: Statistical Process Control and Quality Management
1
A _________ chart portrays the number of defects per unit of production.
c-bar
2
One purpose of quality control is to reduce the costs associated with producing and delivering poor quality goods and services.
True
3
If the binomial distribution is used to develop an operating characteristic curve for an acceptance sampling plan, then the trials must be ________________.
independent
4
Mean charts are designed to determine whether a process is in or out of control based on sample means.
Unlock Deck
Unlock for access to all 136 flashcards in this deck.
Unlock Deck
k this deck
5
In acceptance sampling, there is one unique operating characteristic curve for a specified sampling plan.
Unlock Deck
Unlock for access to all 136 flashcards in this deck.
Unlock Deck
k this deck
6
In acceptance sampling, usually 100% of the incoming lot is checked.
Unlock Deck
Unlock for access to all 136 flashcards in this deck.
Unlock Deck
k this deck
7
The following are examples of attributes: the width of a cracked weld, the length of time that a relay works; the amount of water in a radiator; the diameter of a tire.
Unlock Deck
Unlock for access to all 136 flashcards in this deck.
Unlock Deck
k this deck
8
Quality control charts indicate whether a production process is in control or out of control.
Unlock Deck
Unlock for access to all 136 flashcards in this deck.
Unlock Deck
k this deck
9
Assignable causes are usually large in number and random in nature, and they cannot be entirely eliminated.
Unlock Deck
Unlock for access to all 136 flashcards in this deck.
Unlock Deck
k this deck
10
Control charts can be developed for both variables and attributes.
Unlock Deck
Unlock for access to all 136 flashcards in this deck.
Unlock Deck
k this deck
11
Pareto charts are based on the 80-20 rule, which says 80% of the factors cause 20% of the problem.
Unlock Deck
Unlock for access to all 136 flashcards in this deck.
Unlock Deck
k this deck
12
A c-bar chart shows the percent of the production that is defective.
Unlock Deck
Unlock for access to all 136 flashcards in this deck.
Unlock Deck
k this deck
13
If the binomial distribution is used to develop an operating characteristic curve for an acceptance sampling plan, there can be a total of _____ possible outcomes.
Unlock Deck
Unlock for access to all 136 flashcards in this deck.
Unlock Deck
k this deck
14
In an acceptance sampling plan, the incoming lot is ___________ if the number of defective items in the sample is less than or equal to the acceptance number.
Unlock Deck
Unlock for access to all 136 flashcards in this deck.
Unlock Deck
k this deck
15
In acceptance sampling, it is possible that an incoming lot of computer chips contains more defective chips than it should, but it is still accepted. In acceptance sampling, this probability is called _____________.
Unlock Deck
Unlock for access to all 136 flashcards in this deck.
Unlock Deck
k this deck
16
The purpose of a statistical quality control chart is to identify when assignable causes of variation have entered the production system so that the cause may be identified and corrected.
Unlock Deck
Unlock for access to all 136 flashcards in this deck.
Unlock Deck
k this deck
17
In acceptance sampling, if the number of defects in a sample is less or equal to the acceptance number, then the incoming lot is accepted.
Unlock Deck
Unlock for access to all 136 flashcards in this deck.
Unlock Deck
k this deck
18
A fishbone diagram is used to determine if a process is out of control.
Unlock Deck
Unlock for access to all 136 flashcards in this deck.
Unlock Deck
k this deck
19
There are two general types of causes of variations in manufacturing and service processes: chance and assignable causes.
Unlock Deck
Unlock for access to all 136 flashcards in this deck.
Unlock Deck
k this deck
20
Percent defective charts, which are also known as p-charts or c-bar charts, show the percent of the production that is or is not acceptable.
Unlock Deck
Unlock for access to all 136 flashcards in this deck.
Unlock Deck
k this deck
21
If the sample ranges fall randomly within the upper and lower control limits, then it can be assumed that the process is ___________.
Unlock Deck
Unlock for access to all 136 flashcards in this deck.
Unlock Deck
k this deck
22
A range chart shows the variation of ____________.
Unlock Deck
Unlock for access to all 136 flashcards in this deck.
Unlock Deck
k this deck
23
A statistical quality control chart that is out of control shows what a(n) ___________ variation.
Unlock Deck
Unlock for access to all 136 flashcards in this deck.
Unlock Deck
k this deck
24
One of the most important concepts of statistical process control is that no two products are ________________.
Unlock Deck
Unlock for access to all 136 flashcards in this deck.
Unlock Deck
k this deck
25
The ______ chart portrays the number of defects per unit.
Unlock Deck
Unlock for access to all 136 flashcards in this deck.
Unlock Deck
k this deck
26
Acceptance sampling and control charts may be based on measurements with either ______________ or ___________________.
Unlock Deck
Unlock for access to all 136 flashcards in this deck.
Unlock Deck
k this deck
27
A Pareto chart is typically skewed to the ________________.
Unlock Deck
Unlock for access to all 136 flashcards in this deck.
Unlock Deck
k this deck
28
The concepts of statistical quality control developed in the decade of the ______.
Unlock Deck
Unlock for access to all 136 flashcards in this deck.
Unlock Deck
k this deck
29
________ causes of variation cannot be entirely eliminated.
Unlock Deck
Unlock for access to all 136 flashcards in this deck.
Unlock Deck
k this deck
30
The measurement of color is a(n) _____________.
Unlock Deck
Unlock for access to all 136 flashcards in this deck.
Unlock Deck
k this deck
31
A fishbone diagram is an ________________ tool.
Unlock Deck
Unlock for access to all 136 flashcards in this deck.
Unlock Deck
k this deck
32
The purpose of a statistical control chart that plots sample means is to __________________________.
Unlock Deck
Unlock for access to all 136 flashcards in this deck.
Unlock Deck
k this deck
33
A Pareto chart is designed to show the ____________ in which different types of defects occur in a process.
Unlock Deck
Unlock for access to all 136 flashcards in this deck.
Unlock Deck
k this deck
34
A Pareto chart is useful because it is based on the theory that 80% of the observations are accounted for by 20% of the ________.
Unlock Deck
Unlock for access to all 136 flashcards in this deck.
Unlock Deck
k this deck
35
The center line of a mean chart is labeled as _______.
Unlock Deck
Unlock for access to all 136 flashcards in this deck.
Unlock Deck
k this deck
36
A fishbone diagram starts with the definition of a problem and explores its possible ________.
Unlock Deck
Unlock for access to all 136 flashcards in this deck.
Unlock Deck
k this deck
37
_________ variation is due to slight changes in materials or process conditions and is random in nature.
Unlock Deck
Unlock for access to all 136 flashcards in this deck.
Unlock Deck
k this deck
38
Another name for the p-bar chart is the ______________.
Unlock Deck
Unlock for access to all 136 flashcards in this deck.
Unlock Deck
k this deck
39
In a fishbone diagram, "dissatisfied customers" would be an _________ and "slow service" would be a _________.
Unlock Deck
Unlock for access to all 136 flashcards in this deck.
Unlock Deck
k this deck
40
The "in control" region of a control chart is called the ____________________.
Unlock Deck
Unlock for access to all 136 flashcards in this deck.
Unlock Deck
k this deck
41
A chart used to show the results of a Pareto analysis is a:
A) range chart.
B) bar chart.
C) control chart.
D) fishbone diagram.
A) range chart.
B) bar chart.
C) control chart.
D) fishbone diagram.
Unlock Deck
Unlock for access to all 136 flashcards in this deck.
Unlock Deck
k this deck
42
What is the process that insures that a company is producing a quality product or service?
A) Six Sigma
B) Pareto analysis
C) Fishbone chart analysis
D) Diagnostic chart
A) Six Sigma
B) Pareto analysis
C) Fishbone chart analysis
D) Diagnostic chart
Unlock Deck
Unlock for access to all 136 flashcards in this deck.
Unlock Deck
k this deck
43
Cappelli Inc. designs and manufactures women's apparel using material from various mills. Their acceptance sampling plan states that 20 two-inch squares of the incoming material must be carefully checked. If 3 or less squares reveal imperfections, the lot is accepted. What is the probability that an incoming lot from Blufton Mills that contains 40 percent imperfect cloth will be accepted?
A) 0
B) 0.239
C) 0.015
D) 0.0024
A) 0
B) 0.239
C) 0.015
D) 0.0024
Unlock Deck
Unlock for access to all 136 flashcards in this deck.
Unlock Deck
k this deck
44
The cause-and-effect chart is an example of a:
A) range chart.
B) Pareto chart.
C) control chart.
D) fishbone diagram.
A) range chart.
B) Pareto chart.
C) control chart.
D) fishbone diagram.
Unlock Deck
Unlock for access to all 136 flashcards in this deck.
Unlock Deck
k this deck
45
A fishbone diagram classifies potential causes into categories. What are they?
A) Chance and assignable variation
B) Methods, materials, equipment, and personnel
C) Percent defective and percent non-defective
D) Causes and effects
A) Chance and assignable variation
B) Methods, materials, equipment, and personnel
C) Percent defective and percent non-defective
D) Causes and effects
Unlock Deck
Unlock for access to all 136 flashcards in this deck.
Unlock Deck
k this deck
46
The technique that tallies types of defects and their frequency is called:
A) range charts.
B) Pareto analysis.
C) control charts.
D) fishbone diagram.
A) range charts.
B) Pareto analysis.
C) control charts.
D) fishbone diagram.
Unlock Deck
Unlock for access to all 136 flashcards in this deck.
Unlock Deck
k this deck
47
What type of variation can be reduced, or even eliminated, and is usually nonrandom in nature?
A) chance
B) external
C) assignable
D) co-variation
A) chance
B) external
C) assignable
D) co-variation
Unlock Deck
Unlock for access to all 136 flashcards in this deck.
Unlock Deck
k this deck
48
Equipment failure would be an example of ____________ variation.
A) chance
B) external
C) assignable
D) standard
A) chance
B) external
C) assignable
D) standard
Unlock Deck
Unlock for access to all 136 flashcards in this deck.
Unlock Deck
k this deck
49
Samples of 200 parts were taken every day and the number of defectives was counted. What are the upper and lower limits for the percent defective chart?
A) 0.02 and 0
B) 0.2970 and 0
C) 0.0297 and 0
D) 0.0497 and 0
A) 0.02 and 0
B) 0.2970 and 0
C) 0.0297 and 0
D) 0.0497 and 0
Unlock Deck
Unlock for access to all 136 flashcards in this deck.
Unlock Deck
k this deck
50
Which probability distribution is used to develop a control chart for sample means?
A) Normal distribution
B) Chi-square distribution
C) Poisson distribution
D) Binomial distribution
A) Normal distribution
B) Chi-square distribution
C) Poisson distribution
D) Binomial distribution
Unlock Deck
Unlock for access to all 136 flashcards in this deck.
Unlock Deck
k this deck
51
Which probability distribution is used to develop an operating characteristic curve?
A) Normal distribution
B) Chi-square distribution
C) Poisson distribution
D) Binomial distribution
A) Normal distribution
B) Chi-square distribution
C) Poisson distribution
D) Binomial distribution
Unlock Deck
Unlock for access to all 136 flashcards in this deck.
Unlock Deck
k this deck
52
What process investigates the potential causes of an outcome or effect such as poor quality?
A) SPC
B) Pareto analysis
C) Fishbone chart analysis
D) Diagnostic chart
A) SPC
B) Pareto analysis
C) Fishbone chart analysis
D) Diagnostic chart
Unlock Deck
Unlock for access to all 136 flashcards in this deck.
Unlock Deck
k this deck
53
A sampling plan states that if 20 incoming bolts are checked and 2 or less defective bolts are discovered, the lot will be rejected. If an incoming lot is 10 percent defective, what is the probability of rejecting the lot?
A) 0
B) 1
C) 0.323
D) 0.667
A) 0
B) 1
C) 0.323
D) 0.667
Unlock Deck
Unlock for access to all 136 flashcards in this deck.
Unlock Deck
k this deck
54
What is usually developed to evaluate a sampling plan?
A) Frequency polygon
B) Scatter diagram
C) Operating characteristic curve
D) Simple bar chart
A) Frequency polygon
B) Scatter diagram
C) Operating characteristic curve
D) Simple bar chart
Unlock Deck
Unlock for access to all 136 flashcards in this deck.
Unlock Deck
k this deck
55
A sampling plan states that if 20 incoming transistors are checked and 2 or less defects are found, the lot is accepted. If an incoming lot is 10 percent defective, what is the probability of accepting the lot of transistors?
A) 0
B) 1
C) 0.677
D) 0.333
A) 0
B) 1
C) 0.677
D) 0.333
Unlock Deck
Unlock for access to all 136 flashcards in this deck.
Unlock Deck
k this deck
56
Which probability distribution is used to develop a percent defective chart?
A) Normal distribution
B) Chi-square distribution
C) Poisson distribution
D) Binomial distribution
A) Normal distribution
B) Chi-square distribution
C) Poisson distribution
D) Binomial distribution
Unlock Deck
Unlock for access to all 136 flashcards in this deck.
Unlock Deck
k this deck
57
A subassembly is inspected and the number of defects recorded. A new group of assemblers began work Monday morning. The number of defects per subassembly for the first 10 they produced was: 3, 2, 0, 5, 4, 6, 0, 7, 7, and 6. What are the upper and lower limits for the c-bar chart?
A) 15 and 0
B) 10 and 0
C) 1.12 and 0
D) 6 and -2
A) 15 and 0
B) 10 and 0
C) 1.12 and 0
D) 6 and -2
Unlock Deck
Unlock for access to all 136 flashcards in this deck.
Unlock Deck
k this deck
58
If a company reports that its quarterly earnings will be between $100 million and $125 million depending on the consumer demand, consumer demand is an example of ________ variation.
A) chance
B) external
C) assignable
D) standard
A) chance
B) external
C) assignable
D) standard
Unlock Deck
Unlock for access to all 136 flashcards in this deck.
Unlock Deck
k this deck
59
What chart helps to identify the relatively few factors that impact the performance of a manufacturing or service process?
A) SPC
B) Pareto analysis
C) Fishbone chart analysis
D) Diagnostic chart
A) SPC
B) Pareto analysis
C) Fishbone chart analysis
D) Diagnostic chart
Unlock Deck
Unlock for access to all 136 flashcards in this deck.
Unlock Deck
k this deck
60
If a company reports that its quarterly earnings will be between $100 million and $125 million, the range is an example of _________ variation.
A) chance
B) external
C) assignable
D) controlled
A) chance
B) external
C) assignable
D) controlled
Unlock Deck
Unlock for access to all 136 flashcards in this deck.
Unlock Deck
k this deck
61
A new machine that fills tubes of toothpaste will be monitored using statistical process control. The following data were collected while the machine was closely monitored and under control. Each day a random sample of six tubes are weighed. Based on the data, the process mean is 6.752. What is the lower control limit for the x-bar chart rounded to three decimal places?
A) 6.816
B) 6.676
C) 6.688
D) 6.828
What is the lower control limit for the x-bar chart rounded to three decimal places?A) 6.816
B) 6.676
C) 6.688
D) 6.828
Unlock Deck
Unlock for access to all 136 flashcards in this deck.
Unlock Deck
k this deck
62
A new machine is set or calibrated to fill tubes of toothpaste at precisely 6.75 ounces. Then, once the machine is running, a sample of six tubes is taken every three hours and weighed with the following results: What is the value for the lower control limit (LCL) of the range?
A) 0.00
B) 0.080
C) 0.186
D) 0.203
What is the value for the lower control limit (LCL) of the range?A) 0.00
B) 0.080
C) 0.186
D) 0.203
Unlock Deck
Unlock for access to all 136 flashcards in this deck.
Unlock Deck
k this deck
63
A new machine is set or calibrated to fill tubes of toothpaste at precisely 6.75 ounces. Then, once the machine is running, a sample of six tubes is taken every three hours and weighed with the following results: What is X-bar for 7 pm?
A) 6.71
B) 6.72
C) 6.74
D) 6.76
What is X-bar for 7 pm?A) 6.71
B) 6.72
C) 6.74
D) 6.76
Unlock Deck
Unlock for access to all 136 flashcards in this deck.
Unlock Deck
k this deck
64
A new machine is set or calibrated to fill tubes of toothpaste at precisely 6.75 ounces. Then, once the machine is running, a sample of six tubes is taken every three hours and weighed with the following results: What is the range of the samples at 7 am?
A) 0.05
B) 0.06
C) 0.11
D) 0.12
What is the range of the samples at 7 am?A) 0.05
B) 0.06
C) 0.11
D) 0.12
Unlock Deck
Unlock for access to all 136 flashcards in this deck.
Unlock Deck
k this deck
65
Control charts are used to determine if a process is:
A) in or out of control.
B) measurable.
C) fixable.
D) testable.
A) in or out of control.
B) measurable.
C) fixable.
D) testable.
Unlock Deck
Unlock for access to all 136 flashcards in this deck.
Unlock Deck
k this deck
66
A new machine is set or calibrated to fill tubes of toothpaste at precisely 6.75 ounces. Then, once the machine is running, a sample of six tubes is taken every three hours and weighed with the following results: What is the value of the upper control factor of the range?
A) 0
B) 2.115
C) 2.004
D) 3.0
What is the value of the upper control factor of the range?A) 0
B) 2.115
C) 2.004
D) 3.0
Unlock Deck
Unlock for access to all 136 flashcards in this deck.
Unlock Deck
k this deck
67
A new machine is set or calibrated to fill tubes of toothpaste at precisely 6.75 ounces. Then, once the machine is running, a sample of six tubes is taken every three hours and weighed with the following results: What is X-bar for 7 am?
A) 6.72
B) 6.74
C) 6.78
D) 6.80
What is X-bar for 7 am?A) 6.72
B) 6.74
C) 6.78
D) 6.80
Unlock Deck
Unlock for access to all 136 flashcards in this deck.
Unlock Deck
k this deck
68
The Quality Assurance Department selected 12 samples of 100 printed circuit boards and tested them. The number of defective printed circuit boards in each sample was 3, 3, 0, 5, 1, 1, 5, 6, 6, 2, 0, and 1. What kind of control chart should be constructed to monitor the process?
A) mean chart
B) range chart
C) percent defective chart
D) c-bar chart
A) mean chart
B) range chart
C) percent defective chart
D) c-bar chart
Unlock Deck
Unlock for access to all 136 flashcards in this deck.
Unlock Deck
k this deck
69
A new machine is set or calibrated to fill tubes of toothpaste at precisely 6.75 ounces. Then, once the machine is running, a sample of six tubes is taken every three hours and weighed with the following results: What is the value of A2, the control limit factor for averages?
A) 0
B) 1
C) 0.577
D) 0.483
What is the value of A2, the control limit factor for averages?A) 0
B) 1
C) 0.577
D) 0.483
Unlock Deck
Unlock for access to all 136 flashcards in this deck.
Unlock Deck
k this deck
70
A new machine is set or calibrated to fill tubes of toothpaste at precisely 6.75 ounces. Then, once the machine is running, a sample of six tubes is taken every three hours and weighed with the following results: What is the upper control limit (UCL) for the mean?
A) 6.738
B) 6.999
C) 6.777
D) 7.221
What is the upper control limit (UCL) for the mean?A) 6.738
B) 6.999
C) 6.777
D) 7.221
Unlock Deck
Unlock for access to all 136 flashcards in this deck.
Unlock Deck
k this deck
71
A new machine is set or calibrated to fill tubes of toothpaste at precisely 6.75 ounces. Then, once the machine is running, a sample of six tubes is taken every three hours and weighed with the following results: What is the mean range?
A) 0.000
B) 0.160
C) 0.080
D) 0.203
What is the mean range?A) 0.000
B) 0.160
C) 0.080
D) 0.203
Unlock Deck
Unlock for access to all 136 flashcards in this deck.
Unlock Deck
k this deck
72
A new machine is set or calibrated to fill tubes of toothpaste at precisely 6.75 ounces. Then, once the machine is running, a sample of six tubes is taken every three hours and weighed with the following results: What is the range of the samples at 4 pm?
A) 0.05
B) 0.06
C) 0.11
D) 0.12
What is the range of the samples at 4 pm?A) 0.05
B) 0.06
C) 0.11
D) 0.12
Unlock Deck
Unlock for access to all 136 flashcards in this deck.
Unlock Deck
k this deck
73
A new machine is set or calibrated to fill tubes of toothpaste at precisely 6.75 ounces. Then, once the machine is running, a sample of six tubes is taken every three hours and weighed with the following results: What is the value of the lower control factor of the range?
A) 0
B) 2.115
C) 2.004
D) 3.0
What is the value of the lower control factor of the range?A) 0
B) 2.115
C) 2.004
D) 3.0
Unlock Deck
Unlock for access to all 136 flashcards in this deck.
Unlock Deck
k this deck
74
The Quality Assurance Department selected a sample of 12 printed circuit boards and tested them. The number of defects in each circuit board was 3, 3, 0, 5, 1, 1, 5, 6, 6, 2, 0, and 1. What kind of control chart should be constructed to monitor the process?
A) mean chart
B) range chart
C) percent defective chart
D) c-bar chart
A) mean chart
B) range chart
C) percent defective chart
D) c-bar chart
Unlock Deck
Unlock for access to all 136 flashcards in this deck.
Unlock Deck
k this deck
75
If the upper and lower control limits are set at ±3 standard deviations from the mean, we would expect that:
A) 99.7% of the sample means are within the control limits.
B) 95% of the sample means are within the control limits.
C) about 68% of the sample means are within the control limits.
D) about 5% of the sample means are outside the control limits.
A) 99.7% of the sample means are within the control limits.
B) 95% of the sample means are within the control limits.
C) about 68% of the sample means are within the control limits.
D) about 5% of the sample means are outside the control limits.
Unlock Deck
Unlock for access to all 136 flashcards in this deck.
Unlock Deck
k this deck
76
In a control chart, expected variation is defined by the:
A) standard deviation.
B) standard error of the distribution.
C) upper control limits only.
D) upper and lower control limits.
A) standard deviation.
B) standard error of the distribution.
C) upper control limits only.
D) upper and lower control limits.
Unlock Deck
Unlock for access to all 136 flashcards in this deck.
Unlock Deck
k this deck
77
A new machine used in the production of motor mount bolts was put into operation. Five samples of size 100 were randomly selected and the number of defectives in each sample was noted. What is the lower control limit (LCL)?
A) 0%
B) -2.2%
C) 4.8%
D) 1.6%
What is the lower control limit (LCL)?A) 0%
B) -2.2%
C) 4.8%
D) 1.6%
Unlock Deck
Unlock for access to all 136 flashcards in this deck.
Unlock Deck
k this deck
78
A new machine used in the production of motor mount bolts was put into operation. Five samples of size 100 were randomly selected and the number of defectives in each sample was noted. What is the upper control limit (UCL)?
A) 6.7%
B) 7.4%
C) 8.1%
D) 100%
What is the upper control limit (UCL)?A) 6.7%
B) 7.4%
C) 8.1%
D) 100%
Unlock Deck
Unlock for access to all 136 flashcards in this deck.
Unlock Deck
k this deck
79
A new machine used in the production of motor mount bolts was put into operation. Five samples of size 100 were randomly selected and the number of defectives in each sample was noted. What is the average percent defective?
A) 2.0%
B) 2.3%
C) 2.6%
D) 2.9%
What is the average percent defective?A) 2.0%
B) 2.3%
C) 2.6%
D) 2.9%
Unlock Deck
Unlock for access to all 136 flashcards in this deck.
Unlock Deck
k this deck
80
The upper and lower control limits are usually set:
A) at the mean.
B) above the mean.
C) at three standard deviations from the mean.
D) at two standard deviations from the mean.
A) at the mean.
B) above the mean.
C) at three standard deviations from the mean.
D) at two standard deviations from the mean.
Unlock Deck
Unlock for access to all 136 flashcards in this deck.
Unlock Deck
k this deck
Unlock Deck
Unlock for access to all 136 flashcards in this deck.


