Exam 19: Statistical Process Control and Quality Management
Exam 1: What Is Statistics83 Questions
Exam 2: Describing Data: Frequency Tables, Frequency Distributions, and Graphic Presentation132 Questions
Exam 3: Describing Data: Numerical Measures124 Questions
Exam 4: Describing Data: Displaying and Exploring Data113 Questions
Exam 5: A Survey of Probability Concepts134 Questions
Exam 6: Discrete Probability Distributions131 Questions
Exam 7: Continuous Probability Distributions135 Questions
Exam 8: Sampling Methods and the Central Limit Theorem117 Questions
Exam 9: Estimation and Confidence Intervals131 Questions
Exam 10: One-Sample Tests of Hypothesis110 Questions
Exam 11: Two-Sample Tests of Hypothesis98 Questions
Exam 12: Analysis of Variance134 Questions
Exam 13: Correlation and Linear Regression138 Questions
Exam 14: Multiple Regression Analysis135 Questions
Exam 15: Nonparametric Methods: Nominal Level Hypothesis Tests181 Questions
Exam 16: Nonparametric Methods: Analysis of Ordinal Data138 Questions
Exam 17: Index Numbers137 Questions
Exam 18: Time Series and Forecasting139 Questions
Exam 19: Statistical Process Control and Quality Management136 Questions
Exam 20: An Introduction to Decision Theory115 Questions
Select questions type
What type of variation can be reduced, or even eliminated, and is usually nonrandom in nature?
Free
(Multiple Choice)
4.9/5  (38)
(38)
Correct Answer: Verified
C
The following are examples of attributes: the width of a cracked weld, the length of time that a relay works; the amount of water in a radiator; the diameter of a tire.
Free
(True/False)
4.8/5 (28)
Correct Answer:Verified
False
The center line of a mean chart is labeled as _______.
Free
(Short Answer)
4.9/5 (38)
Correct Answer:Verified
X double bar
An airline is investigating the causes of lost bags. The following table of data was collected over the last six months. 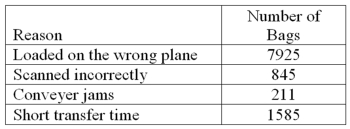 What percentage of bags is lost because of "conveyer jams"?
(Essay)
4.9/5 (33)
A manufacturer of golf club shafts inspects 50 shafts every day. Over the last ten days, the number of defective shafts has been reported to be the following. 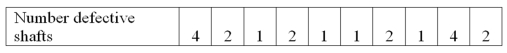 What is the mean proportion of defective shafts?
(Essay)
4.7/5 (28)
The purpose of a statistical quality control chart is to identify when assignable causes of variation have entered the production system so that the cause may be identified and corrected.
(True/False)
4.7/5 (38)
A statistical quality control chart that is out of control shows what a(n) ___________ variation.
(Short Answer)
4.9/5 (30)
What chart helps to identify the relatively few factors that impact the performance of a manufacturing or service process?
(Multiple Choice)
4.8/5 (31)
A quality control chart is used to monitor the customer wait time at a local call center. Sample means of five times are averaged and plotted over time. The last five sample means show a trend of increasing sample means. The process is:
(Multiple Choice)
4.9/5 (43)
The manager of a restaurant inspects a delivery of steaks based on the expectation that each steak weighs eight ounces. Is this an example of acceptance sampling or statistical process control? Explain why.
(Essay)
4.7/5 (39)
A new machine is set or calibrated to fill tubes of toothpaste at precisely 6.75 ounces. Then, once the machine is running, a sample of six tubes is taken every three hours and weighed with the following results: 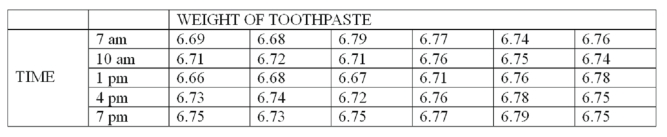 What is the upper control limit (UCL) for the mean?
(Multiple Choice)
4.8/5 (37)
A diagnostic chart used to identify sources of variation, where the number and types of defects are tallied, is referred to as a(n):
(Multiple Choice)
4.8/5 (35)
A quality control chart is used to monitor the customer wait time at a local call center. Sample means of five times are averaged and plotted over time. The last five sample means show a trend of decreasing sample means. The process is:
(Multiple Choice)
4.8/5 (40)
Random samples of four items are selected from a manufacturing process at regular intervals and a certain quality characteristic is measured. After 25 samples, 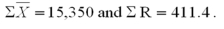 How many samples were collected?
(Multiple Choice)
4.8/5 (28)
A Pareto chart is designed to show the ____________ in which different types of defects occur in a process.
(Short Answer)
4.8/5 (35)
The technique that tallies types of defects and their frequency is called:
(Multiple Choice)
4.8/5 (33)
Random samples of four items are selected from a manufacturing process at regular intervals, and a certain quality characteristic is measured. After 25 samples, ΣX = 15,350 and ΣR = 411.4. To construct a mean chart, what is the value for the center line?
(Multiple Choice)
4.7/5 (34)
Filters
- Essay(0)
- Multiple Choice(0)
- Short Answer(0)
- True False(0)
- Matching(0)