Deck 2: Descriptive Statistics: Tabular and Graphical Methods
Full screen (f)
Question
Question
Question
Question
Question
Question
Question
Question
Question
Question
Question
Question
Question
Question
Question
Question
Question
Question
Question
Question
Question
Question
Question
Question
The US local airport keeps track of the percentage of flights arriving within 15 minutes of their scheduled arrivals.The stem-and-leaf plot of the data for one year is below: 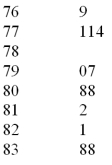 In developing a histogram of these data,how many classes would be used?
A)4
B)5
C)6
D)7
E)8
In developing a histogram of these data,how many classes would be used?A)4
B)5
C)6
D)7
E)8
Question
Question
A CFO is looking at how much of a company's resources are spent on computing.He samples companies in the pharmaceutical industry and developed the following stem-and-leaf graph. 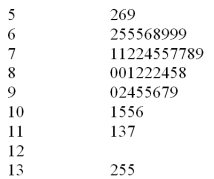 What is the approximate shape of the distribution of the data?
A)Normal
B)Skewed to the right
C)Skewed to the left
D)Bimodal
E)Uniform
What is the approximate shape of the distribution of the data?A)Normal
B)Skewed to the right
C)Skewed to the left
D)Bimodal
E)Uniform
Question
A CFO is looking at how much of a company's resources are spent on computing.He samples companies in the pharmaceutical industry and developed the following stem-and-leaf graph. 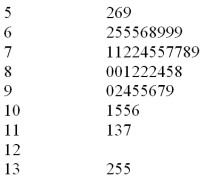 If a frequency histogram were to be created using these data,how many classes would you create?
A)4
B)5
C)6
D)7
E)8
If a frequency histogram were to be created using these data,how many classes would you create?A)4
B)5
C)6
D)7
E)8
Question
Question
The US local airport keeps track of the percentage of flights arriving within 15 minutes of their scheduled arrivals.The stem-and-leaf plot of the data for one year is below: 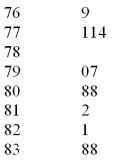 How many flights were used in this plot?
A)7
B)9
C)10
D)11
E)12
How many flights were used in this plot?A)7
B)9
C)10
D)11
E)12
Question
Question
A CFO is looking at how much of a company's resources are spent on computing.He samples companies in the pharmaceutical industry and developed the following stem-and-leaf graph. 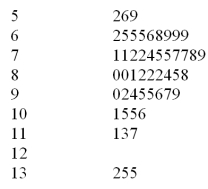 What is the smallest percent spent on R&D?
A)5.9
B)5.6
C)5.2
D)5.02
E)50.2
What is the smallest percent spent on R&D?A)5.9
B)5.6
C)5.2
D)5.02
E)50.2
Question
Question
A CFO is looking at how much of a company's resources are spent on computing.He samples companies in the pharmaceutical industry and developed the following stem-and-leaf graph. 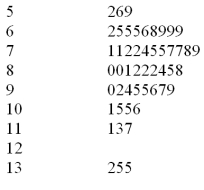 What would be the first class interval for the frequency histogram?
A)5.2 - 6.5
B)5.2 - 6.0
C)5.0 - 6.0
D)5.2 - 6.6
E)5.2 - 6.4
What would be the first class interval for the frequency histogram?A)5.2 - 6.5
B)5.2 - 6.0
C)5.0 - 6.0
D)5.2 - 6.6
E)5.2 - 6.4
Question
A company collected the ages from a random sample of its middle managers with the resulting frequency distribution shown below: 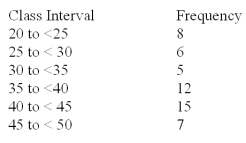 What would be the approximate shape of the relative frequency histogram?
A)Symmetrical
B)Uniform
C)Multiple peak
D)Skewed to the left
E)Skewed to the right
What would be the approximate shape of the relative frequency histogram?A)Symmetrical
B)Uniform
C)Multiple peak
D)Skewed to the left
E)Skewed to the right
Question
Question
A CFO is looking at how much of a company's resources are spent on computing.He samples companies in the pharmaceutical industry and developed the following stem-and-leaf graph. 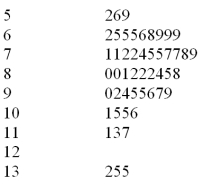 What would be the class length that would be used in creating a frequency histogram?
A)1.4
B)8.3
C)1.2
D)1.7
E)0.9
What would be the class length that would be used in creating a frequency histogram?A)1.4
B)8.3
C)1.2
D)1.7
E)0.9
Question
The US local airport keeps track of the percentage of flights arriving within 15 minutes of their scheduled arrivals.The stem-and-leaf plot of the data for one year is below: 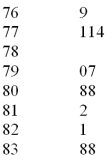 What would be the class length for creating the frequency histogram?
A)1.4
B)0.8
C)2.7
D)1.7
E)2.3
What would be the class length for creating the frequency histogram?A)1.4
B)0.8
C)2.7
D)1.7
E)2.3
Question
Question
Question
Question
822 customers were randomly selected from those who had recently bought a book over the internet.The chart below shows the breakdown of the classification of the book type:  What percentages of books were in the top two categories?
A)22.99
B)20.44
C)4.50
D)43.43
E).4343
What percentages of books were in the top two categories?A)22.99
B)20.44
C)4.50
D)43.43
E).4343
Question
The 550 students answered an additional question with the following results based on their rating of their instructor: 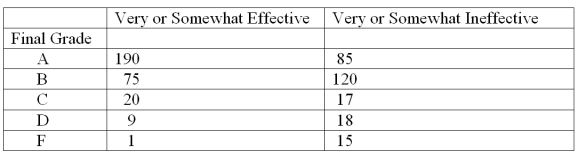 What proportion of the students who rated their instructor as very or somewhat effective received a B or better in the class?
A)0.345
B)0.254
C)0.482
D)0.898
E)0.644
What proportion of the students who rated their instructor as very or somewhat effective received a B or better in the class?A)0.345
B)0.254
C)0.482
D)0.898
E)0.644
Question
The 550 students answered an additional question with the following results based on their rating of their instructor: 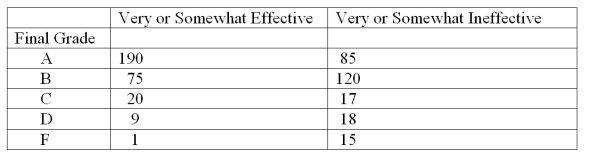 What proportion of all 550 students received less than a C?
A)0.03
B)0.06
C)0.08
D)0.13
E)0.15
What proportion of all 550 students received less than a C?A)0.03
B)0.06
C)0.08
D)0.13
E)0.15
Question
Question
822 customers were randomly selected from those who had recently bought a book over the internet.The chart below shows the breakdown of the classification of the book type: 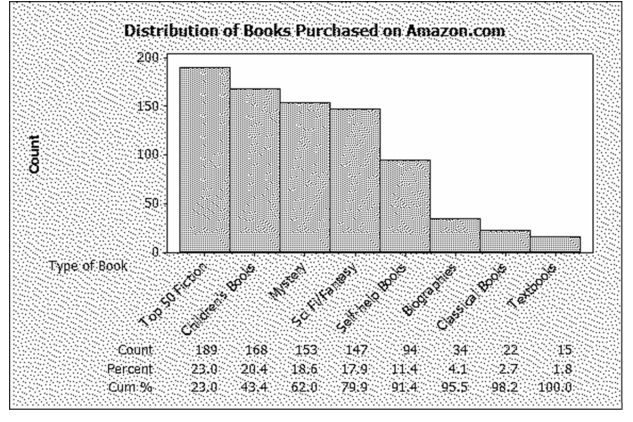 What percentage of the books purchased were self-help books?
A)11.44%
B).1144%
C)1.82%
D)0.0182%
E)0.940%
What percentage of the books purchased were self-help books?A)11.44%
B).1144%
C)1.82%
D)0.0182%
E)0.940%
Question
A company collected the ages from a random sample of its middle managers with the resulting frequency distribution shown below:  What is the relative frequency for the largest interval?
A).132
B).226
C).231
D).283
E).288
What is the relative frequency for the largest interval?A).132
B).226
C).231
D).283
E).288
Question
Using the following data,describe the shape of the data distribution. 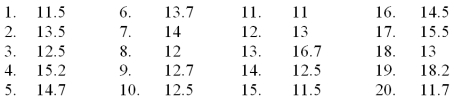
A)Skewed to the left
B)Bi-model
C)Normal
D)Skewed to the right
A)Skewed to the left
B)Bi-model
C)Normal
D)Skewed to the right
Question
Question
Question
Question
Question
Question
Question
Question
822 customers were randomly selected from those who had recently bought a book over the internet.The chart below shows the breakdown of the classification of the book type: 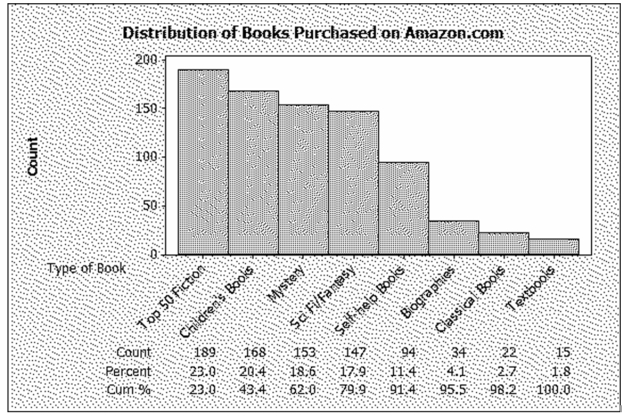 What percentage of the books purchased were either mystery or science fiction/fantasy?
A)18.61
B)36.50
C)17.88
D)24.33
E)22.99
What percentage of the books purchased were either mystery or science fiction/fantasy?A)18.61
B)36.50
C)17.88
D)24.33
E)22.99
Question
Using the following data,what would be the range of the values of the stem in a stem and leaf display? 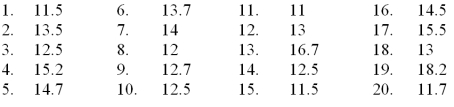
A)11-17
B)11-18
C)10-18
D)12-17
E)12-18
A)11-17
B)11-18
C)10-18
D)12-17
E)12-18
Question
Question
Question
Question
A company collected the ages from a random sample of its middle managers with the resulting frequency distribution shown below: 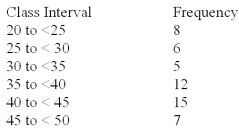 What is the midpoint of the third class interval?
A)22.5
B)27.5
C)32.5
D)37.5
E)42.5
What is the midpoint of the third class interval?A)22.5
B)27.5
C)32.5
D)37.5
E)42.5
Question
Consider the following data: 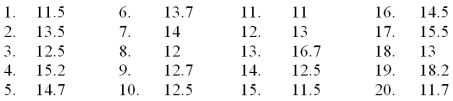 Create a stem and leaf display for the sample.
Stem and leaf of C1,N = 20 Leaf Unit = 0.10
Create a stem and leaf display for the sample.Stem and leaf of C1,N = 20 Leaf Unit = 0.10
Question
Recently an advertising company called 200 people and asked to identify the company that was in an ad running nationwide.The following results were obtained: 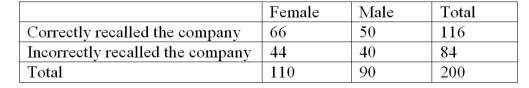 What percentage of those surveyed were female and could not recall the company?
A)40.0%
B)22.0%
C)52.4%
D)66.7%
E)37.9%
What percentage of those surveyed were female and could not recall the company?A)40.0%
B)22.0%
C)52.4%
D)66.7%
E)37.9%
Question
Consider the following data on distances traveled by people to visit the local amusement park and calculate the relative frequency for the distances over 24 miles. 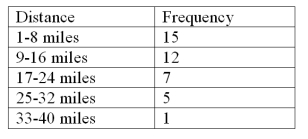
A).375
B).150
C).125
D).025
E).325
A).375
B).150
C).125
D).025
E).325
Question
The following is a partial relative frequency distribution of grades in an introductory statistics course. 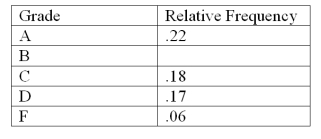 Find the relative frequency for B grade
A).78
B).27
C).65
D).37
E).47
Find the relative frequency for B gradeA).78
B).27
C).65
D).37
E).47
Question
The number of items rejected daily by a manufacturer because of defects for the last 30 days are: 20,21,8,17,22,19,18,19,14,17,11,6,21,25,4,19,9,12,16,16,10,28,24,6,21,20,25,5,17,8
Complete this frequency table for these data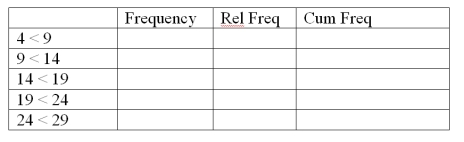
Complete this frequency table for these data
Question
The following is a relative frequency distribution of grades in an introductory statistics course. 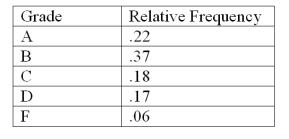 If this was the distribution of 200 students,find the frequency of failures:
A)12
B)6
C)23
D)46
E)3
If this was the distribution of 200 students,find the frequency of failures:A)12
B)6
C)23
D)46
E)3
Question
The local electronics retailer has recently conducted a study on purchasers of large screen televisions.The study recorded the type of television and the credit account balance of the customer at the time of purchase.The following results were obtained: 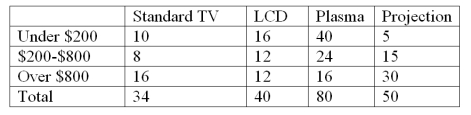 What percentage of purchases were Plasma televisions by customers with the smallest credit balances?
A)50.00%
B)39.20%
C)56.30%
D)34.80%
E)19.6%
What percentage of purchases were Plasma televisions by customers with the smallest credit balances?A)50.00%
B)39.20%
C)56.30%
D)34.80%
E)19.6%
Question
The following is a relative frequency distribution of grades in an introductory statistics course. 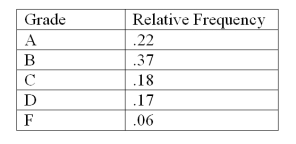 If this was the distribution of 200 students,find the frequency for the highest two grades:
A)44
B)118
C)59
D)74
E)35
If this was the distribution of 200 students,find the frequency for the highest two grades:A)44
B)118
C)59
D)74
E)35
Question
Consider the following data on distances traveled by people to visit the local amusement park and calculate the relative frequency for the shortest distance. 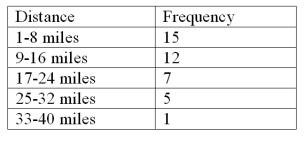
A).375
B).150
C).500
D).300
E).333
A).375
B).150
C).500
D).300
E).333
Question
Question
The local electronics retailer has recently conducted a study on purchasers of large screen televisions.The study recorded the type of television and the credit account balance of the customer at the time of purchase.The following results were obtained: 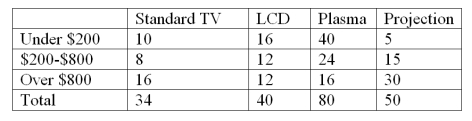 What percentage of the customers with the highest credit balances purchased an LCD television?
A)36.30%
B)5.90%
C)19.60%
D)56.30%
E)16.20%
What percentage of the customers with the highest credit balances purchased an LCD television?A)36.30%
B)5.90%
C)19.60%
D)56.30%
E)16.20%
Question
Question
Question
Consider the following data on distances traveled by people to visit the local amusement park. 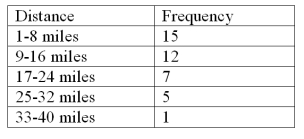 Construct an Ogive plot that corresponds to the frequency table.
Construct an Ogive plot that corresponds to the frequency table. Question
Question
Question
The following is a relative frequency distribution of grades in an introductory statistics course. 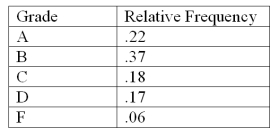 If this was the distribution of 200 students,give the frequency distribution for this data:
If this was the distribution of 200 students,give the frequency distribution for this data: Question
Recently an advertising company called 200 people and asked to identify the company that was in an ad running nationwide.The following results were obtained: 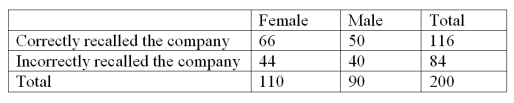 What percentage of those surveyed could not correctly recall the company?
A)58.00%
B)56.89%
C)55.00%
D)43.10%
E)42.00%
What percentage of those surveyed could not correctly recall the company?A)58.00%
B)56.89%
C)55.00%
D)43.10%
E)42.00%
Question
Using the following data,what would be the leaf unit in a stem and leaf display? 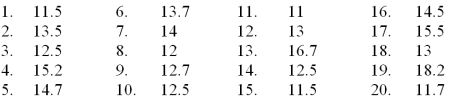
A)1.0
B)10
C).10
D).01
E).20
A)1.0
B)10
C).10
D).01
E).20
Question

Unlock Deck
Sign up to unlock the cards in this deck!
Unlock Deck
Unlock Deck
1/90
Play
Full screen (f)
Deck 2: Descriptive Statistics: Tabular and Graphical Methods
1
A stem-and-leaf display is a graphical portrayal of a data set that shows the data set's overall pattern of variation.
True
2
A bar chart is a graphic that can be used to depict qualitative data.
True
3
A plot of the values of two variables is a _____ plot.
A)Runs
B)Scatter
C)Dot
D)Ogive plot
A)Runs
B)Scatter
C)Dot
D)Ogive plot
B
4
A scatter plot can be used to identify outliers.
Unlock Deck
Unlock for access to all 90 flashcards in this deck.
Unlock Deck
k this deck
5
All of the following are used to describe quantitative data except the
A)Histogram
B)Stem and Leaf
C)Dot Plot
D)Pie Chart
A)Histogram
B)Stem and Leaf
C)Dot Plot
D)Pie Chart
Unlock Deck
Unlock for access to all 90 flashcards in this deck.
Unlock Deck
k this deck
6
________ can be used to study the relationship between two variables.
A)Crosstabulation tables
B)Frequency tables
C)Cumulative frequency distributions
D)Dot plots
A)Crosstabulation tables
B)Frequency tables
C)Cumulative frequency distributions
D)Dot plots
Unlock Deck
Unlock for access to all 90 flashcards in this deck.
Unlock Deck
k this deck
7
A(n)______ is a graph of a cumulative distribution.
A)Histogram
B)Scatter plot
C)Ogive plot
D)Pie Chart
A)Histogram
B)Scatter plot
C)Ogive plot
D)Pie Chart
Unlock Deck
Unlock for access to all 90 flashcards in this deck.
Unlock Deck
k this deck
8
Row or column percentages can be found in:
A)Frequency tables
B)Relative frequency tables
C)Crosstabulation tables
D)Cumulative frequency tables
A)Frequency tables
B)Relative frequency tables
C)Crosstabulation tables
D)Cumulative frequency tables
Unlock Deck
Unlock for access to all 90 flashcards in this deck.
Unlock Deck
k this deck
9
A ______________ displays the frequency of each group with qualitative data and a _____________ displays the frequency of each group with quantitative data.
A)Histogram,stem and leaf display
B)Bar chart,histogram
C)Scatter plot,bar chart
D)Stem and leaf,pie chart
A)Histogram,stem and leaf display
B)Bar chart,histogram
C)Scatter plot,bar chart
D)Stem and leaf,pie chart
Unlock Deck
Unlock for access to all 90 flashcards in this deck.
Unlock Deck
k this deck
10
An observation separated from the rest of the data is a(n)
A)Absolute extreme
B)Outlier
C)Mode
D)Quartile
A)Absolute extreme
B)Outlier
C)Mode
D)Quartile
Unlock Deck
Unlock for access to all 90 flashcards in this deck.
Unlock Deck
k this deck
11
The relative frequency is the frequency of a class divided by the total number of measurements.
Unlock Deck
Unlock for access to all 90 flashcards in this deck.
Unlock Deck
k this deck
12
When grouping a large sample of items into classes,the ______________ is a better tool than the ___________.
A)Histogram,stem and leaf display
B)Box plot,histogram
C)Stem and Leaf display,scatter plot
D)Scatter plot,box plot
A)Histogram,stem and leaf display
B)Box plot,histogram
C)Stem and Leaf display,scatter plot
D)Scatter plot,box plot
Unlock Deck
Unlock for access to all 90 flashcards in this deck.
Unlock Deck
k this deck
13
Stem-and-leaf displays and dot plots are useful for detecting outliers.
Unlock Deck
Unlock for access to all 90 flashcards in this deck.
Unlock Deck
k this deck
14
When we wish to summarize the proportion (or fraction)of items in a class we use the frequency distribution for each class.
Unlock Deck
Unlock for access to all 90 flashcards in this deck.
Unlock Deck
k this deck
15
When establishing the classes for a frequency table it is generally agreed that the more classes you use the better your frequency table will be.
Unlock Deck
Unlock for access to all 90 flashcards in this deck.
Unlock Deck
k this deck
16
A frequency table includes row and column percentages.
Unlock Deck
Unlock for access to all 90 flashcards in this deck.
Unlock Deck
k this deck
17
Which of the following graphs is for qualitative data?
A)Histogram
B)Bar Chart
C)Ogive plot
D)Stem and leaf
A)Histogram
B)Bar Chart
C)Ogive plot
D)Stem and leaf
Unlock Deck
Unlock for access to all 90 flashcards in this deck.
Unlock Deck
k this deck
18
When looking at the shape of the distribution using a stem-and-leaf,a distribution is skewed to the right when the left tail is shorter than the right tail.
Unlock Deck
Unlock for access to all 90 flashcards in this deck.
Unlock Deck
k this deck
19
A Stem and Leaf display is best used to
A)Provide a point estimate of the variability of the data set.
B)Provide a point estimate of the central tendency of the data set.
C)Display the shape of the distribution.
D)None of the above.
A)Provide a point estimate of the variability of the data set.
B)Provide a point estimate of the central tendency of the data set.
C)Display the shape of the distribution.
D)None of the above.
Unlock Deck
Unlock for access to all 90 flashcards in this deck.
Unlock Deck
k this deck
20
The sample cumulative distribution function is non-decreasing.
Unlock Deck
Unlock for access to all 90 flashcards in this deck.
Unlock Deck
k this deck
21
Which one of the following statistical tools is used with quantitative data?
A)Bar chart
B)Histogram
C)Pie chart
D)Pareto chart
A)Bar chart
B)Histogram
C)Pie chart
D)Pareto chart
Unlock Deck
Unlock for access to all 90 flashcards in this deck.
Unlock Deck
k this deck
22
If there are 130 values in a data set,how many classes should be created for a frequency histogram?
A)4
B)5
C)6
D)7
E)8
A)4
B)5
C)6
D)7
E)8
Unlock Deck
Unlock for access to all 90 flashcards in this deck.
Unlock Deck
k this deck
23
All of the following are used to describe qualitative data except the:
A)Bar chart
B)Pie chart
C)Histogram
D)Pareto Chart
A)Bar chart
B)Pie chart
C)Histogram
D)Pareto Chart
Unlock Deck
Unlock for access to all 90 flashcards in this deck.
Unlock Deck
k this deck
24
The US local airport keeps track of the percentage of flights arriving within 15 minutes of their scheduled arrivals.The stem-and-leaf plot of the data for one year is below: In developing a histogram of these data,how many classes would be used?
A)4
B)5
C)6
D)7
E)8
In developing a histogram of these data,how many classes would be used?A)4
B)5
C)6
D)7
E)8
Unlock Deck
Unlock for access to all 90 flashcards in this deck.
Unlock Deck
k this deck
25
If there are 62 values in a data set,how many classes should be created for a frequency histogram?
A)4
B)5
C)6
D)7
E)8
A)4
B)5
C)6
D)7
E)8
Unlock Deck
Unlock for access to all 90 flashcards in this deck.
Unlock Deck
k this deck
26
A CFO is looking at how much of a company's resources are spent on computing.He samples companies in the pharmaceutical industry and developed the following stem-and-leaf graph. What is the approximate shape of the distribution of the data?
A)Normal
B)Skewed to the right
C)Skewed to the left
D)Bimodal
E)Uniform
What is the approximate shape of the distribution of the data?A)Normal
B)Skewed to the right
C)Skewed to the left
D)Bimodal
E)Uniform
Unlock Deck
Unlock for access to all 90 flashcards in this deck.
Unlock Deck
k this deck
27
A CFO is looking at how much of a company's resources are spent on computing.He samples companies in the pharmaceutical industry and developed the following stem-and-leaf graph. If a frequency histogram were to be created using these data,how many classes would you create?
A)4
B)5
C)6
D)7
E)8
If a frequency histogram were to be created using these data,how many classes would you create?A)4
B)5
C)6
D)7
E)8
Unlock Deck
Unlock for access to all 90 flashcards in this deck.
Unlock Deck
k this deck
28
If there are 120 values in a data set,how many classes should be created for a frequency histogram?
A)4
B)5
C)6
D)7
E)8
A)4
B)5
C)6
D)7
E)8
Unlock Deck
Unlock for access to all 90 flashcards in this deck.
Unlock Deck
k this deck
29
The US local airport keeps track of the percentage of flights arriving within 15 minutes of their scheduled arrivals.The stem-and-leaf plot of the data for one year is below: How many flights were used in this plot?
A)7
B)9
C)10
D)11
E)12
How many flights were used in this plot?A)7
B)9
C)10
D)11
E)12
Unlock Deck
Unlock for access to all 90 flashcards in this deck.
Unlock Deck
k this deck
30
Which of the following graphical tools is not used to study the shapes of distributions?
A)Stem-and-Leaf display
B)Scatter plot
C)Histogram
D)Dot plot
A)Stem-and-Leaf display
B)Scatter plot
C)Histogram
D)Dot plot
Unlock Deck
Unlock for access to all 90 flashcards in this deck.
Unlock Deck
k this deck
31
A CFO is looking at how much of a company's resources are spent on computing.He samples companies in the pharmaceutical industry and developed the following stem-and-leaf graph. What is the smallest percent spent on R&D?
A)5.9
B)5.6
C)5.2
D)5.02
E)50.2
What is the smallest percent spent on R&D?A)5.9
B)5.6
C)5.2
D)5.02
E)50.2
Unlock Deck
Unlock for access to all 90 flashcards in this deck.
Unlock Deck
k this deck
32
If there are 30 values in a data set,how many classes should be created for a frequency histogram?
A)4
B)5
C)6
D)7
E)8
A)4
B)5
C)6
D)7
E)8
Unlock Deck
Unlock for access to all 90 flashcards in this deck.
Unlock Deck
k this deck
33
A CFO is looking at how much of a company's resources are spent on computing.He samples companies in the pharmaceutical industry and developed the following stem-and-leaf graph. What would be the first class interval for the frequency histogram?
A)5.2 - 6.5
B)5.2 - 6.0
C)5.0 - 6.0
D)5.2 - 6.6
E)5.2 - 6.4
What would be the first class interval for the frequency histogram?A)5.2 - 6.5
B)5.2 - 6.0
C)5.0 - 6.0
D)5.2 - 6.6
E)5.2 - 6.4
Unlock Deck
Unlock for access to all 90 flashcards in this deck.
Unlock Deck
k this deck
34
A company collected the ages from a random sample of its middle managers with the resulting frequency distribution shown below: What would be the approximate shape of the relative frequency histogram?
A)Symmetrical
B)Uniform
C)Multiple peak
D)Skewed to the left
E)Skewed to the right
What would be the approximate shape of the relative frequency histogram?A)Symmetrical
B)Uniform
C)Multiple peak
D)Skewed to the left
E)Skewed to the right
Unlock Deck
Unlock for access to all 90 flashcards in this deck.
Unlock Deck
k this deck
35
When developing a frequency distribution the class (group),intervals should be
A)large.
B)small.
C)integer.
D)mutually exclusive.
E)equal.
A)large.
B)small.
C)integer.
D)mutually exclusive.
E)equal.
Unlock Deck
Unlock for access to all 90 flashcards in this deck.
Unlock Deck
k this deck
36
A CFO is looking at how much of a company's resources are spent on computing.He samples companies in the pharmaceutical industry and developed the following stem-and-leaf graph. What would be the class length that would be used in creating a frequency histogram?
A)1.4
B)8.3
C)1.2
D)1.7
E)0.9
What would be the class length that would be used in creating a frequency histogram?A)1.4
B)8.3
C)1.2
D)1.7
E)0.9
Unlock Deck
Unlock for access to all 90 flashcards in this deck.
Unlock Deck
k this deck
37
The US local airport keeps track of the percentage of flights arriving within 15 minutes of their scheduled arrivals.The stem-and-leaf plot of the data for one year is below: What would be the class length for creating the frequency histogram?
A)1.4
B)0.8
C)2.7
D)1.7
E)2.3
What would be the class length for creating the frequency histogram?A)1.4
B)0.8
C)2.7
D)1.7
E)2.3
Unlock Deck
Unlock for access to all 90 flashcards in this deck.
Unlock Deck
k this deck
38
A ______________ shows the relationship between two variables.
A)Stem-and-leaf
B)Bar chart
C)Histogram
D)Scatter Plot
E)Pie chart
A)Stem-and-leaf
B)Bar chart
C)Histogram
D)Scatter Plot
E)Pie chart
Unlock Deck
Unlock for access to all 90 flashcards in this deck.
Unlock Deck
k this deck
39
______________ and _____________ are used to describe qualitative (categorical)data.
A)Stem and leaf displays,scatter plots
B)Scatter plots,histograms
C)Box plots,bar charts
D)Bar charts,pie charts
E)Pie charts,histograms
A)Stem and leaf displays,scatter plots
B)Scatter plots,histograms
C)Box plots,bar charts
D)Bar charts,pie charts
E)Pie charts,histograms
Unlock Deck
Unlock for access to all 90 flashcards in this deck.
Unlock Deck
k this deck
40
A ______________ can be used to differentiate the "vital few" causes of quality problems from the "trivial many" causes of quality problems.
A)Histogram
B)Scatter plot
C)Pareto chart
D)Ogive plot
E)Stem and leaf display
A)Histogram
B)Scatter plot
C)Pareto chart
D)Ogive plot
E)Stem and leaf display
Unlock Deck
Unlock for access to all 90 flashcards in this deck.
Unlock Deck
k this deck
41
822 customers were randomly selected from those who had recently bought a book over the internet.The chart below shows the breakdown of the classification of the book type: What percentages of books were in the top two categories?
A)22.99
B)20.44
C)4.50
D)43.43
E).4343
What percentages of books were in the top two categories?A)22.99
B)20.44
C)4.50
D)43.43
E).4343
Unlock Deck
Unlock for access to all 90 flashcards in this deck.
Unlock Deck
k this deck
42
The 550 students answered an additional question with the following results based on their rating of their instructor: What proportion of the students who rated their instructor as very or somewhat effective received a B or better in the class?
A)0.345
B)0.254
C)0.482
D)0.898
E)0.644
What proportion of the students who rated their instructor as very or somewhat effective received a B or better in the class?A)0.345
B)0.254
C)0.482
D)0.898
E)0.644
Unlock Deck
Unlock for access to all 90 flashcards in this deck.
Unlock Deck
k this deck
43
The 550 students answered an additional question with the following results based on their rating of their instructor: What proportion of all 550 students received less than a C?
A)0.03
B)0.06
C)0.08
D)0.13
E)0.15
What proportion of all 550 students received less than a C?A)0.03
B)0.06
C)0.08
D)0.13
E)0.15
Unlock Deck
Unlock for access to all 90 flashcards in this deck.
Unlock Deck
k this deck
44
A __________ can be used to differential the "vital few" causes of quality problems from the "trivial many" causes of quality problems.
A)Pareto chart
B)Bar chart
C)Ogive plot
D)Cross tabulation table
A)Pareto chart
B)Bar chart
C)Ogive plot
D)Cross tabulation table
Unlock Deck
Unlock for access to all 90 flashcards in this deck.
Unlock Deck
k this deck
45
822 customers were randomly selected from those who had recently bought a book over the internet.The chart below shows the breakdown of the classification of the book type: What percentage of the books purchased were self-help books?
A)11.44%
B).1144%
C)1.82%
D)0.0182%
E)0.940%
What percentage of the books purchased were self-help books?A)11.44%
B).1144%
C)1.82%
D)0.0182%
E)0.940%
Unlock Deck
Unlock for access to all 90 flashcards in this deck.
Unlock Deck
k this deck
46
A company collected the ages from a random sample of its middle managers with the resulting frequency distribution shown below: What is the relative frequency for the largest interval?
A).132
B).226
C).231
D).283
E).288
What is the relative frequency for the largest interval?A).132
B).226
C).231
D).283
E).288
Unlock Deck
Unlock for access to all 90 flashcards in this deck.
Unlock Deck
k this deck
47
Using the following data,describe the shape of the data distribution.
A)Skewed to the left
B)Bi-model
C)Normal
D)Skewed to the right
A)Skewed to the left
B)Bi-model
C)Normal
D)Skewed to the right
Unlock Deck
Unlock for access to all 90 flashcards in this deck.
Unlock Deck
k this deck
48
The number of measurements falling within a class interval is called the _____.
A)Frequency
B)Relative frequency
C)Leaf
D)Cumulative sum
A)Frequency
B)Relative frequency
C)Leaf
D)Cumulative sum
Unlock Deck
Unlock for access to all 90 flashcards in this deck.
Unlock Deck
k this deck
49
A ________ is a graph of cumulative distribution.
A)Bar chart
B)Relative frequency histogram
C)Frequency histogram
D)Ogive plot
A)Bar chart
B)Relative frequency histogram
C)Frequency histogram
D)Ogive plot
Unlock Deck
Unlock for access to all 90 flashcards in this deck.
Unlock Deck
k this deck
50
A flaw possessed by a population or sample unit is _____.
A)always random
B)a defect
C)displayed by a dot plot
D)the cause for extreme skewness to the right
A)always random
B)a defect
C)displayed by a dot plot
D)the cause for extreme skewness to the right
Unlock Deck
Unlock for access to all 90 flashcards in this deck.
Unlock Deck
k this deck
51
A histogram that tails out towards larger values is _____.
A)Skewed to the left
B)Normal
C)A scatterplot
D)Skewed to the right
A)Skewed to the left
B)Normal
C)A scatterplot
D)Skewed to the right
Unlock Deck
Unlock for access to all 90 flashcards in this deck.
Unlock Deck
k this deck
52
A histogram that tails out towards smaller values is _____.
A)Skewed to the left
B)Normal
C)A scatterplot
D)Skewed to the right
A)Skewed to the left
B)Normal
C)A scatterplot
D)Skewed to the right
Unlock Deck
Unlock for access to all 90 flashcards in this deck.
Unlock Deck
k this deck
53
A graphical portrayal of a data set that divides the data into classes and gives the frequency of each class is a(n)_____.
A)Ogive Plot
B)Dot Plot
C)Histogram
D)Pareto Chart
E)Bar Chart
A)Ogive Plot
B)Dot Plot
C)Histogram
D)Pareto Chart
E)Bar Chart
Unlock Deck
Unlock for access to all 90 flashcards in this deck.
Unlock Deck
k this deck
54
A(n)___________ is a graphical display of categorical data made up of vertical or horizontal bars.
A)Pareto chart
B)Bar chart
C)Ogive plot
D)Histogram
A)Pareto chart
B)Bar chart
C)Ogive plot
D)Histogram
Unlock Deck
Unlock for access to all 90 flashcards in this deck.
Unlock Deck
k this deck
55
822 customers were randomly selected from those who had recently bought a book over the internet.The chart below shows the breakdown of the classification of the book type: What percentage of the books purchased were either mystery or science fiction/fantasy?
A)18.61
B)36.50
C)17.88
D)24.33
E)22.99
What percentage of the books purchased were either mystery or science fiction/fantasy?A)18.61
B)36.50
C)17.88
D)24.33
E)22.99
Unlock Deck
Unlock for access to all 90 flashcards in this deck.
Unlock Deck
k this deck
56
Using the following data,what would be the range of the values of the stem in a stem and leaf display?
A)11-17
B)11-18
C)10-18
D)12-17
E)12-18
A)11-17
B)11-18
C)10-18
D)12-17
E)12-18
Unlock Deck
Unlock for access to all 90 flashcards in this deck.
Unlock Deck
k this deck
57
A graphical display of categorical data made up of vertical or horizontal bars is called a _____.
A)Pie Chart
B)Pareto Chart
C)Bar Chart
D)Ogive Plot
A)Pie Chart
B)Pareto Chart
C)Bar Chart
D)Ogive Plot
Unlock Deck
Unlock for access to all 90 flashcards in this deck.
Unlock Deck
k this deck
58
The percentage of measurements in a class is called the _____ of that class.
A)Frequency
B)Relative frequency
C)Leaf
D)Cumulative percentage
A)Frequency
B)Relative frequency
C)Leaf
D)Cumulative percentage
Unlock Deck
Unlock for access to all 90 flashcards in this deck.
Unlock Deck
k this deck
59
A relative frequency curve having a long tail to the right is said to be _____.
A)Skewed to the left
B)Normal
C)A scatterplot
D)Skewed to the right
A)Skewed to the left
B)Normal
C)A scatterplot
D)Skewed to the right
Unlock Deck
Unlock for access to all 90 flashcards in this deck.
Unlock Deck
k this deck
60
A company collected the ages from a random sample of its middle managers with the resulting frequency distribution shown below: What is the midpoint of the third class interval?
A)22.5
B)27.5
C)32.5
D)37.5
E)42.5
What is the midpoint of the third class interval?A)22.5
B)27.5
C)32.5
D)37.5
E)42.5
Unlock Deck
Unlock for access to all 90 flashcards in this deck.
Unlock Deck
k this deck
61
Consider the following data: Create a stem and leaf display for the sample.
Stem and leaf of C1,N = 20 Leaf Unit = 0.10
Create a stem and leaf display for the sample.Stem and leaf of C1,N = 20 Leaf Unit = 0.10
Unlock Deck
Unlock for access to all 90 flashcards in this deck.
Unlock Deck
k this deck
62
Recently an advertising company called 200 people and asked to identify the company that was in an ad running nationwide.The following results were obtained: What percentage of those surveyed were female and could not recall the company?
A)40.0%
B)22.0%
C)52.4%
D)66.7%
E)37.9%
What percentage of those surveyed were female and could not recall the company?A)40.0%
B)22.0%
C)52.4%
D)66.7%
E)37.9%
Unlock Deck
Unlock for access to all 90 flashcards in this deck.
Unlock Deck
k this deck
63
Consider the following data on distances traveled by people to visit the local amusement park and calculate the relative frequency for the distances over 24 miles.
A).375
B).150
C).125
D).025
E).325
A).375
B).150
C).125
D).025
E).325
Unlock Deck
Unlock for access to all 90 flashcards in this deck.
Unlock Deck
k this deck
64
The following is a partial relative frequency distribution of grades in an introductory statistics course. Find the relative frequency for B grade
A).78
B).27
C).65
D).37
E).47
Find the relative frequency for B gradeA).78
B).27
C).65
D).37
E).47
Unlock Deck
Unlock for access to all 90 flashcards in this deck.
Unlock Deck
k this deck
65
The number of items rejected daily by a manufacturer because of defects for the last 30 days are: 20,21,8,17,22,19,18,19,14,17,11,6,21,25,4,19,9,12,16,16,10,28,24,6,21,20,25,5,17,8
Complete this frequency table for these data
Complete this frequency table for these data
Unlock Deck
Unlock for access to all 90 flashcards in this deck.
Unlock Deck
k this deck
66
The following is a relative frequency distribution of grades in an introductory statistics course. If this was the distribution of 200 students,find the frequency of failures:
A)12
B)6
C)23
D)46
E)3
If this was the distribution of 200 students,find the frequency of failures:A)12
B)6
C)23
D)46
E)3
Unlock Deck
Unlock for access to all 90 flashcards in this deck.
Unlock Deck
k this deck
67
The local electronics retailer has recently conducted a study on purchasers of large screen televisions.The study recorded the type of television and the credit account balance of the customer at the time of purchase.The following results were obtained: What percentage of purchases were Plasma televisions by customers with the smallest credit balances?
A)50.00%
B)39.20%
C)56.30%
D)34.80%
E)19.6%
What percentage of purchases were Plasma televisions by customers with the smallest credit balances?A)50.00%
B)39.20%
C)56.30%
D)34.80%
E)19.6%
Unlock Deck
Unlock for access to all 90 flashcards in this deck.
Unlock Deck
k this deck
68
The following is a relative frequency distribution of grades in an introductory statistics course. If this was the distribution of 200 students,find the frequency for the highest two grades:
A)44
B)118
C)59
D)74
E)35
If this was the distribution of 200 students,find the frequency for the highest two grades:A)44
B)118
C)59
D)74
E)35
Unlock Deck
Unlock for access to all 90 flashcards in this deck.
Unlock Deck
k this deck
69
Consider the following data on distances traveled by people to visit the local amusement park and calculate the relative frequency for the shortest distance.
A).375
B).150
C).500
D).300
E).333
A).375
B).150
C).500
D).300
E).333
Unlock Deck
Unlock for access to all 90 flashcards in this deck.
Unlock Deck
k this deck
70
The number of items rejected daily by a manufacturer because of defects for the last 30 days are: 20,21,8,17,22,19,18,19,14,17,11,6,21,25,4,19,9,12,16,16,10,28,24,6,21,20,25,5,17,8
Construct a stem-and-leaf plot.
Construct a stem-and-leaf plot.
Unlock Deck
Unlock for access to all 90 flashcards in this deck.
Unlock Deck
k this deck
71
The local electronics retailer has recently conducted a study on purchasers of large screen televisions.The study recorded the type of television and the credit account balance of the customer at the time of purchase.The following results were obtained: What percentage of the customers with the highest credit balances purchased an LCD television?
A)36.30%
B)5.90%
C)19.60%
D)56.30%
E)16.20%
What percentage of the customers with the highest credit balances purchased an LCD television?A)36.30%
B)5.90%
C)19.60%
D)56.30%
E)16.20%
Unlock Deck
Unlock for access to all 90 flashcards in this deck.
Unlock Deck
k this deck
72
The number of items rejected daily by a manufacturer because of defects for the last 30 days are: 20,21,8,17,22,19,18,19,14,17,11,6,21,25,4,19,9,12,16,16,10,28,24,6,21,20,25,5,17,8 How many classes should be used in the construction of a histogram?
A)6
B)5
C)7
D)4
E)8
A)6
B)5
C)7
D)4
E)8
Unlock Deck
Unlock for access to all 90 flashcards in this deck.
Unlock Deck
k this deck
73
The number of items rejected daily by a manufacturer because of defects for the last 30 days are: 20,21,8,17,22,19,18,19,14,17,11,6,21,25,4,19,9,12,16,16,10,28,24,6,21,20,25,5,17,8
Construct an Ogive plot
Construct an Ogive plot
Unlock Deck
Unlock for access to all 90 flashcards in this deck.
Unlock Deck
k this deck
74
Consider the following data on distances traveled by people to visit the local amusement park. Construct an Ogive plot that corresponds to the frequency table.
Construct an Ogive plot that corresponds to the frequency table. Unlock Deck
Unlock for access to all 90 flashcards in this deck.
Unlock Deck
k this deck
75
The number of weekly sales calls by a sample of 25 pharmaceutical salespersons is below:
24,56,43,35,37,27,29,44,34,28,33,28,46,31,38,41,48,38,27,29,37,33,31,40,50
Construct an Ogive plot
24,56,43,35,37,27,29,44,34,28,33,28,46,31,38,41,48,38,27,29,37,33,31,40,50
Construct an Ogive plot
Unlock Deck
Unlock for access to all 90 flashcards in this deck.
Unlock Deck
k this deck
76
The number of weekly sales calls by a sample of 25 pharmaceutical salespersons is below: 24,56,43,35,37,27,29,44,34,28,33,28,46,31,38,41,48,38,27,29,37,33,31,40,50
How many classes should be used in the construction of a histogram?
A)4
B)6
C)10
D)5
E)2
How many classes should be used in the construction of a histogram?
A)4
B)6
C)10
D)5
E)2
Unlock Deck
Unlock for access to all 90 flashcards in this deck.
Unlock Deck
k this deck
77
The following is a relative frequency distribution of grades in an introductory statistics course. If this was the distribution of 200 students,give the frequency distribution for this data:
If this was the distribution of 200 students,give the frequency distribution for this data: Unlock Deck
Unlock for access to all 90 flashcards in this deck.
Unlock Deck
k this deck
78
Recently an advertising company called 200 people and asked to identify the company that was in an ad running nationwide.The following results were obtained: What percentage of those surveyed could not correctly recall the company?
A)58.00%
B)56.89%
C)55.00%
D)43.10%
E)42.00%
What percentage of those surveyed could not correctly recall the company?A)58.00%
B)56.89%
C)55.00%
D)43.10%
E)42.00%
Unlock Deck
Unlock for access to all 90 flashcards in this deck.
Unlock Deck
k this deck
79
Using the following data,what would be the leaf unit in a stem and leaf display?
A)1.0
B)10
C).10
D).01
E).20
A)1.0
B)10
C).10
D).01
E).20
Unlock Deck
Unlock for access to all 90 flashcards in this deck.
Unlock Deck
k this deck
80
The number of weekly sales calls by a sample of 25 pharmaceutical salespersons is below: 24,56,43,35,37,27,29,44,34,28,33,28,46,31,38,41,48,38,27,29,37,33,31,40,50
What is the shape of the distribution of the data?
A)Skewed with tail to the right
B)Skewed with tail to the left
C)Normal
D)Bi-model
What is the shape of the distribution of the data?
A)Skewed with tail to the right
B)Skewed with tail to the left
C)Normal
D)Bi-model
Unlock Deck
Unlock for access to all 90 flashcards in this deck.
Unlock Deck
k this deck
Unlock Deck
Unlock for access to all 90 flashcards in this deck.


