Exam 2: Descriptive Statistics: Tabular and Graphical Methods
Exam 1: An Introduction to Business Statistics54 Questions
Exam 2: Descriptive Statistics: Tabular and Graphical Methods90 Questions
Exam 3: Descriptive Statistics: Numerical Methods149 Questions
Exam 4: Probability135 Questions
Exam 5: Discrete Random Variables128 Questions
Exam 6: Continuous Random Variables150 Questions
Exam 7: Sampling and Sampling Distributions116 Questions
Exam 8: Confidence Intervals144 Questions
Exam 9: Hypothesis Testing148 Questions
Exam 10: Statistical Inferences Based on Two Samples132 Questions
Exam 11: Experimental Design and Analysis of Variance115 Questions
Exam 12: Chi-Square Tests96 Questions
Exam 13: Simple Linear Regression Analysis148 Questions
Exam 14: Multiple Regression122 Questions
Exam 15: Model Building and Model Diagnostics102 Questions
Exam 16: Time Series Forecasting150 Questions
Exam 17: Process Improvement Using Control Charts122 Questions
Exam 18: Nonparametric Methods97 Questions
Exam 19: Decision Theory90 Questions
Select questions type
Consider the following data on distances traveled by people to visit the local amusement park and calculate the relative frequency for the shortest distance. 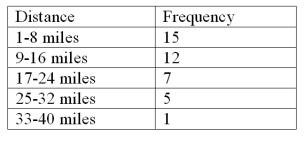
Free
(Multiple Choice)
4.8/5  (36)
(36)
Correct Answer: Verified
A
Which of the following graphical tools is not used to study the shapes of distributions?
Free
(Multiple Choice)
4.8/5 (25)
Correct Answer:Verified
B
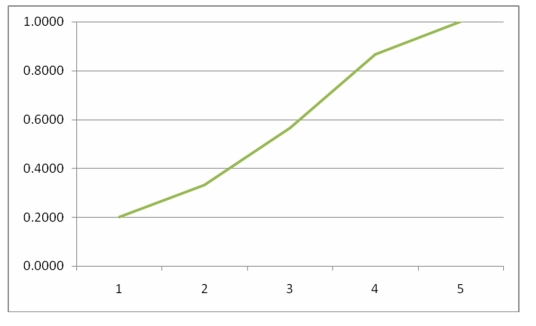
The number of items rejected daily by a manufacturer because of defects for the last 30 days are: 20,21,8,17,22,19,18,19,14,17,11,6,21,25,4,19,9,12,16,16,10,28,24,6,21,20,25,5,17,8
Construct an Ogive plot
Free
(Essay)
4.8/5 (41)
Correct Answer:Verified
______________ and _____________ are used to describe qualitative (categorical)data.
(Multiple Choice)
4.9/5 (30)
A CFO is looking at how much of a company's resources are spent on computing.He samples companies in the pharmaceutical industry and developed the following stem-and-leaf graph. 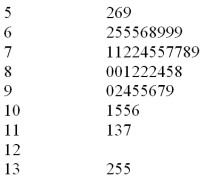 If a frequency histogram were to be created using these data,how many classes would you create?
(Multiple Choice)
4.9/5 (36)
A CFO is looking at how much of a company's resources are spent on computing.He samples companies in the pharmaceutical industry and developed the following stem-and-leaf graph. 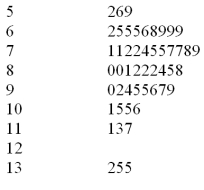 What would be the first class interval for the frequency histogram?
(Multiple Choice)
4.8/5 (34)
The percentage of measurements in a class is called the _____ of that class.
(Multiple Choice)
4.9/5 (32)
The following is a relative frequency distribution of grades in an introductory statistics course. 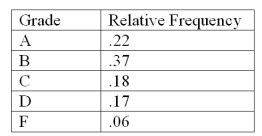 Construct a percent frequency bar chart for this data.
(Essay)
4.9/5 (32)
When establishing the classes for a frequency table it is generally agreed that the more classes you use the better your frequency table will be.
(True/False)
4.9/5 (34)
If there are 62 values in a data set,how many classes should be created for a frequency histogram?
(Multiple Choice)
4.9/5 (30)
A ______________ shows the relationship between two variables.
(Multiple Choice)
4.9/5 (27)
When grouping a large sample of items into classes,the ______________ is a better tool than the ___________.
(Multiple Choice)
4.8/5 (36)
A graphical display of categorical data made up of vertical or horizontal bars is called a _____.
(Multiple Choice)
4.8/5 (30)
The local electronics retailer has recently conducted a study on purchasers of large screen televisions.The study recorded the type of television and the credit account balance of the customer at the time of purchase.The following results were obtained: 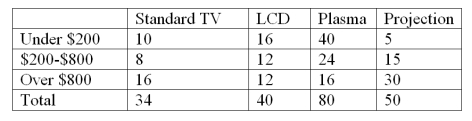 What percentage of the customers with the highest credit balances purchased an LCD television?
(Multiple Choice)
4.8/5 (40)
A bar chart is a graphic that can be used to depict qualitative data.
(True/False)
4.9/5 (36)
Using the following data,what would be the leaf unit in a stem and leaf display? 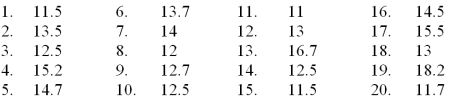
(Multiple Choice)
4.8/5 (36)
A __________ can be used to differential the "vital few" causes of quality problems from the "trivial many" causes of quality problems.
(Multiple Choice)
4.8/5 (29)
If there are 130 values in a data set,how many classes should be created for a frequency histogram?
(Multiple Choice)
5.0/5 (40)
Filters
- Essay(0)
- Multiple Choice(0)
- Short Answer(0)
- True False(0)
- Matching(0)