Deck 14: Regression Analysis
Full screen (f)
Question
Question
Question
Question
Question
Question
Question
In the simple linear regression model,β0 is the y-intercept of the line  .
.
. Question
In testing the population correlation coefficient,the alternative hypothesis is  .
.
. Question
Question
Question
Question
Question
Question
The following scatterplot implies that the relationship between the two variables x and y is: 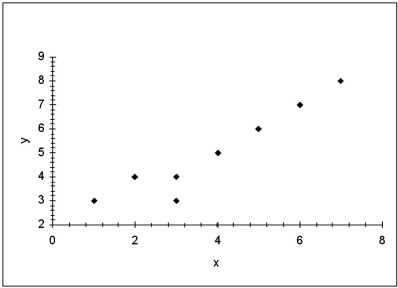
A)Strong and positive.
B)Strong and negative.
C)Weak and negative.
D)No relationship.
A)Strong and positive.
B)Strong and negative.
C)Weak and negative.
D)No relationship.
Question
Question
Question
Question
The simple linear regression model can be written in the form 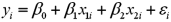
Question
Question
Question
Question
Consider the following data: 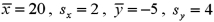 ,and
,and  .What is the sample regression equation?
A)
B)
C)
D)
,and .What is the sample regression equation?A)
B)
C)
D)
Question
Given the augmented Phillips model:  ,where y = actual rate of inflation (%),x1 = unemployment rate (%),and x2 = anticipated inflation rate (%).The response variable(s)in this model is(are)the:
A)Unemployment rate
B)Actual inflation rate
C)Anticipated inflation rate
D)Unemployment rate and anticipated inflation rate
,where y = actual rate of inflation (%),x1 = unemployment rate (%),and x2 = anticipated inflation rate (%).The response variable(s)in this model is(are)the:A)Unemployment rate
B)Actual inflation rate
C)Anticipated inflation rate
D)Unemployment rate and anticipated inflation rate
Question
When testing whether the correlation coefficient differs from zero,the value of the test statistic is  with a corresponding p-value of 0.0061.At the 5% significance level,can you conclude that the correlation coefficient differs from zero?
A)Yes,since the p-value is less than 0.05.
B)Yes,since the absolute value of the test statistic exceeds 0.05.
C)No,since the p-value is less than 0.05.
D)No,since the absolute value of the test statistic exceeds 0.05.
with a corresponding p-value of 0.0061.At the 5% significance level,can you conclude that the correlation coefficient differs from zero?A)Yes,since the p-value is less than 0.05.
B)Yes,since the absolute value of the test statistic exceeds 0.05.
C)No,since the p-value is less than 0.05.
D)No,since the absolute value of the test statistic exceeds 0.05.
Question
Question
The following scatterplot implies that the relationship between the two variables x and y is: 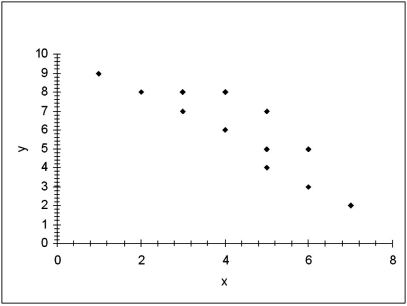
A)Weak and positive.
B)Strong and positive.
C)Strong and negative.
D)No relationship.
A)Weak and positive.
B)Strong and positive.
C)Strong and negative.
D)No relationship.
Question
A regression equation was estimated as  .If
.If  and
and  ,the predicted value of y would be:
A)29.
B)77.
C)233.
D)281.
.If and ,the predicted value of y would be:A)29.
B)77.
C)233.
D)281.
Question
In the sample regression equation  ,what is
  ?
?
A)The y-intercept
B)The slope of the equation
C)The value of y when x = 0
D)The predicted value of y,given a specific x value
,what is ?A)The y-intercept
B)The slope of the equation
C)The value of y when x = 0
D)The predicted value of y,given a specific x value
Question
Consider the following simple linear regression model:  .The explanatory variable is:
A)y
B)x
C)ε
D)β0
.The explanatory variable is:A)y
B)x
C)ε
D)β0
Question
Question
When testing whether the correlation coefficient differs from zero,the value of the test statistic is  with a corresponding p-value of 0.0653.At the 5% significance level,can you conclude that the correlation coefficient differs from zero?
A)Yes,since the p-value exceeds 0.05.
B)Yes,since the test statistic value of 1.95 exceeds 0.05.
C)No,since the p-value exceeds 0.05.
D)No,since the test statistic value of 1.95 exceeds 0.05.
with a corresponding p-value of 0.0653.At the 5% significance level,can you conclude that the correlation coefficient differs from zero?A)Yes,since the p-value exceeds 0.05.
B)Yes,since the test statistic value of 1.95 exceeds 0.05.
C)No,since the p-value exceeds 0.05.
D)No,since the test statistic value of 1.95 exceeds 0.05.
Question
Consider the following simple linear regression model:  .The random error term is:
A)y
B)x
C)ε
D)β0
.The random error term is:A)y
B)x
C)ε
D)β0
Question
A regression equation was estimated as  .If
.If  ,the predicted value of y is:
A)-80
B)-90
C)110
D)120
.If ,the predicted value of y is:A)-80
B)-90
C)110
D)120
Question
Question
Consider the following data: 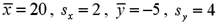 ,and
,and  .Calculate the sample correlation coefficient,
  .
.
A)-0.40
B)-0.20
C)0.20
D)0.40
,and .Calculate the sample correlation coefficient, .A)-0.40
B)-0.20
C)0.20
D)0.40
Question
Consider the following data:  ,and
,and  .Calculate the sample correlation coefficient,
  .
.
A)-0.40
B)-0.20
C)0.20
D)0.40
,and .Calculate the sample correlation coefficient, .A)-0.40
B)-0.20
C)0.20
D)0.40
Question
Consider the following data: 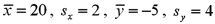 ,and
,and  .What is the sample regression equation?
A)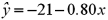
B)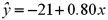
C)
D)
,and .What is the sample regression equation?A)
B)
C)
D)
Question
Question
Consider the following simple linear regression model:  ;β0 and β1 are:
A)the response variables.
B)the random error terms.
C)the unknown parameters.
D)the explanatory variables.
;β0 and β1 are:A)the response variables.
B)the random error terms.
C)the unknown parameters.
D)the explanatory variables.
Question
Consider the following simple linear regression model:  .The response variable is:
A)y
B)x
C)ε
D)β0
.The response variable is:A)y
B)x
C)ε
D)β0
Question
Calculate the value of  given the ANOVA portion of the following regression output:
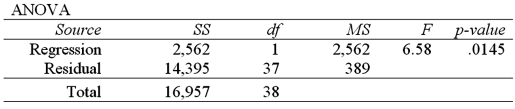
A)0.151
B)0.515
C)0.849
D)1.000
given the ANOVA portion of the following regression output: A)0.151
B)0.515
C)0.849
D)1.000
Question
Using the same data set,four models are estimated using the same response variable,however,the number of explanatory variables differs.Which model provides the best fit? 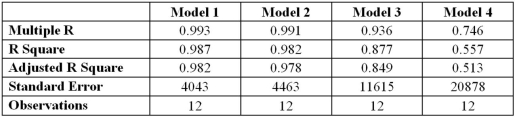
A)Model 1
B)Model 2
C)Model 3
D)Model 4
A)Model 1
B)Model 2
C)Model 3
D)Model 4
Question
Question
Consider the sample regression equation:  ,with an R2 value of 0.81.What is the value of the correlation coefficient between x and y?
A)-0.90
B)-0.81
C)0.81
D)0.90
,with an R2 value of 0.81.What is the value of the correlation coefficient between x and y?A)-0.90
B)-0.81
C)0.81
D)0.90
Question
In the estimation of a multiple regression model with two explanatory variables and 20 observations,  and
and  .What is the value of R2?
A)0.10
B)0.45
C)0.55
D)0.90
and .What is the value of R2?A)0.10
B)0.45
C)0.55
D)0.90
Question
Question
Question
Question
Consider the sample regression equation:  ,with an R2 value of 0.65.What is the value of the correlation coefficient between x and y?
A)-0.81
B)-0.65
C)0.81
D)0.65
,with an R2 value of 0.65.What is the value of the correlation coefficient between x and y?A)-0.81
B)-0.65
C)0.81
D)0.65
Question
Question
The capital asset pricing model is given by: 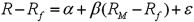 ,where
  = expected return on the market,
  = risk-free market return,and
  = expected return on a stock or portfolio of interest.The explanatory variable in this model is:
A) .
.
B) .
.
C) .
.
D)
,where = expected return on the market, = risk-free market return,and = expected return on a stock or portfolio of interest.The explanatory variable in this model is:A)
.B)
.C)
.D)
Question
Consider the sample regression equation: 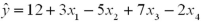 .When x1 increases 1 unit and x2 increases 2 units,while x3 and x4 remain unchanged,what change would you expect in the predicted y?
A)Decrease by 2
B)Decrease by 4
C)Decrease by 7
D)No change in predicted y
.When x1 increases 1 unit and x2 increases 2 units,while x3 and x4 remain unchanged,what change would you expect in the predicted y?A)Decrease by 2
B)Decrease by 4
C)Decrease by 7
D)No change in predicted y
Question
Consider the sample regression equation: 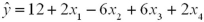 .When x1 increases 1 unit and x2 increases 2 units,while x3 and x4 remain unchanged,what change would you expect in the predicted y?
A)Decrease by 2
B)Decrease by 10
C)Increase by 2
D)No change in the predicted y
.When x1 increases 1 unit and x2 increases 2 units,while x3 and x4 remain unchanged,what change would you expect in the predicted y?A)Decrease by 2
B)Decrease by 10
C)Increase by 2
D)No change in the predicted y
Question
Question
Given the augmented Phillips model: 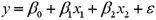 ,where y = actual rate of inflation (%),x1 = unemployment rate (%),and x2 = anticipated inflation rate (%).The explanatory variable(s)in this model is(are)the:
A)Unemployment rate
B)Actual inflation rate
C)Anticipated inflation rate
D)Unemployment rate and anticipated inflation rate
,where y = actual rate of inflation (%),x1 = unemployment rate (%),and x2 = anticipated inflation rate (%).The explanatory variable(s)in this model is(are)the:A)Unemployment rate
B)Actual inflation rate
C)Anticipated inflation rate
D)Unemployment rate and anticipated inflation rate
Question
Question
The capital asset pricing model is given by: 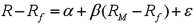 ,where
  = expected return on the market,
  = risk-free market return,and
  = expected return on a stock or portfolio of interest.The response variable in this model is:
A) .
.
B) .
.
C) .
.
D)
,where = expected return on the market, = risk-free market return,and = expected return on a stock or portfolio of interest.The response variable in this model is:A)
.B)
.C)
.D)
Question
A simple linear regression of the return of firm A (  )on the return of firm B (
  ),based on 18 observations,is
  = 2.2 + 0.4
  .If the coefficient of determination from this regression is 0.09 calculate the correlation between
  and
and  .
.
A)0.03
B)0.04
C)0.09
D)0.30
)on the return of firm B ( ),based on 18 observations,is = 2.2 + 0.4 .If the coefficient of determination from this regression is 0.09 calculate the correlation between and .A)0.03
B)0.04
C)0.09
D)0.30
Question
Question
Question
Exhibit 14-5.An marketing analyst wants to examine the relationship between sales (in $1,000s)and advertising (in $100s)for firms in the food and beverage industry and collects monthly data for 25 firms.He estimates the model  .The following table below shows a portion of the regression results.
  Refer to Exhibit 14-5.Calculate the coefficient of determination.
A)0.1348
B)0.1558
C)0.8442
D)0.8652
.The following table below shows a portion of the regression results. Refer to Exhibit 14-5.Calculate the coefficient of determination.A)0.1348
B)0.1558
C)0.8442
D)0.8652
Question
Exhibit 14-5.An marketing analyst wants to examine the relationship between sales (in $1,000s)and advertising (in $100s)for firms in the food and beverage industry and collects monthly data for 25 firms.He estimates the model  .The following table below shows a portion of the regression results.
 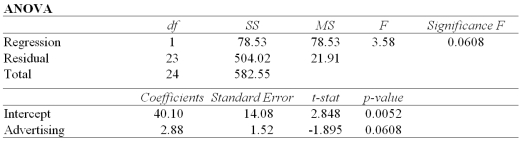 Refer to Exhibit 14-5.Interpret the slope coefficient.
A)If Advertising goes up by $100,then on average,Sales go up by $2,880.
B)If Sales go up by $100,then on average,Advertising goes up by $2,880.
C)If Advertising goes up by $100,then on average,Sales go up by $4,298.
D)If Sales go up by $100,then on average,Advertising goes up by $4,298.
.The following table below shows a portion of the regression results. Refer to Exhibit 14-5.Interpret the slope coefficient.A)If Advertising goes up by $100,then on average,Sales go up by $2,880.
B)If Sales go up by $100,then on average,Advertising goes up by $2,880.
C)If Advertising goes up by $100,then on average,Sales go up by $4,298.
D)If Sales go up by $100,then on average,Advertising goes up by $4,298.
Question
Exhibit 14-2.A statistics student is asked to estimate  .She calculates the following values.
 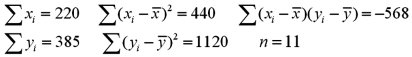 Refer to Exhibit 14-2.What is the sample regression equation?
A)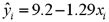
B)
C)
D)
.She calculates the following values. Refer to Exhibit 14-2.What is the sample regression equation?A)
B)
C)
D)
Question
In the estimation of a multiple regression model with two explanatory variables and 20 observations,  and
and  .The value of adjusted R2 is closest to:
A)0.39
B)0.45
C)0.55
D)0.61
and .The value of adjusted R2 is closest to:A)0.39
B)0.45
C)0.55
D)0.61
Question
Exhibit 14-3.Consider the following sample regression equation  ,where y is the demand for Product A (in 1000s)and x is the price of the product (in $). Refer to Exhibit 14-3.If the price of Product A is $5,then we expect demand to be
A)50
B)500
C)5,000
D)50,000.
,where y is the demand for Product A (in 1000s)and x is the price of the product (in $). Refer to Exhibit 14-3.If the price of Product A is $5,then we expect demand to beA)50
B)500
C)5,000
D)50,000.
Question
Exhibit 14-2.A statistics student is asked to estimate 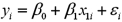 .She calculates the following values.
  Refer to Exhibit 14-2.Calculate b1.
A)-1.29
B)-0.51
C)0.51
D)1.29
.She calculates the following values. Refer to Exhibit 14-2.Calculate b1.A)-1.29
B)-0.51
C)0.51
D)1.29
Question
In the estimation of a multiple regression model with four explanatory variables and 25 observations,  and
and  .What is the value of R2?
A)0.16
B)0.34
C)0.66
D)0.84
and .What is the value of R2?A)0.16
B)0.34
C)0.66
D)0.84
Question
Exhibit 14-6.A manager at a local bank analyzed the relationship between monthly salary (y,in $)and length of service (x,measured in months)for 30 employees.She estimates 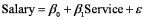 .The following table summarizes a portion of the regression results:
 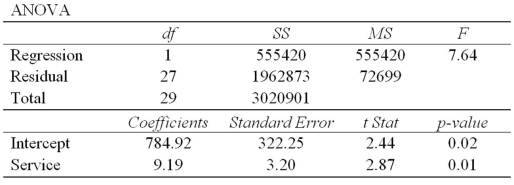 Refer to Exhibit 14-6.The monthly salary of an employee that has worked for 48 months at the bank is closest to:
A)$441.
B)$785.
C)$1050.
D)$1226.
.The following table summarizes a portion of the regression results: Refer to Exhibit 14-6.The monthly salary of an employee that has worked for 48 months at the bank is closest to:A)$441.
B)$785.
C)$1050.
D)$1226.
Question
In the estimation of a multiple regression model with four explanatory variables and 25 observations,  and
and  .The value of adjusted R2 is closest to:
A)0.21
B)0.34
C)0.66
D)0.79
and .The value of adjusted R2 is closest to:A)0.21
B)0.34
C)0.66
D)0.79
Question
Question
Exhibit 14-1.Over the past 30 years,the sample standard deviations of the rates of return for stock X and Stock Y were 0.20 and 0.12,respectively.The sample covariance between the returns of X and Y is 0.0096. Refer to Exhibit 14-1.When testing whether the correlation coefficient differs from zero,the value of the test statistic is  .At the 5% significance level,the critical value is
  .The conclusion to the hypothesis test is to:
A)Reject H0;we can conclude that the correlation coefficient differs from zero.
B)Reject H0;we cannot conclude that the correlation coefficient differs from zero.
C)Do not reject H0;we can conclude that the correlation coefficient differs from zero.
D)Do not reject H0;we cannot conclude that the correlation coefficient differs from zero.
.At the 5% significance level,the critical value is .The conclusion to the hypothesis test is to:A)Reject H0;we can conclude that the correlation coefficient differs from zero.
B)Reject H0;we cannot conclude that the correlation coefficient differs from zero.
C)Do not reject H0;we can conclude that the correlation coefficient differs from zero.
D)Do not reject H0;we cannot conclude that the correlation coefficient differs from zero.
Question
Exhibit 14-4.Consider the following sample regression equation  ,where y is the supply for Product A (in 1000s)and x is the price of Product A (in $). Refer to Exhibit 14-4.If the price of Product A increases by $3,then we expect the supply for Product A to
A)increase by 30.
B)decrease by 30.
C)increase by 30,000.
D)decrease by 30,000.
,where y is the supply for Product A (in 1000s)and x is the price of Product A (in $). Refer to Exhibit 14-4.If the price of Product A increases by $3,then we expect the supply for Product A toA)increase by 30.
B)decrease by 30.
C)increase by 30,000.
D)decrease by 30,000.
Question
Exhibit 14-4.Consider the following sample regression equation  ,where y is the supply for Product A (in 1000s)and x is the price of Product A (in $). Refer to Exhibit 14-4.If the price of Product A is $5,then we expect supply to be
A)250
B)2,500
C)25,000
D)250,000.
,where y is the supply for Product A (in 1000s)and x is the price of Product A (in $). Refer to Exhibit 14-4.If the price of Product A is $5,then we expect supply to beA)250
B)2,500
C)25,000
D)250,000.
Question
Exhibit 14-3.Consider the following sample regression equation  ,where y is the demand for Product A (in 1000s)and x is the price of the product (in $). Refer to Exhibit 14-3.If the price of the good increases by $3,then we expect demand for Product A to
A)increase by 60.
B)decrease by 60.
C)decrease by 60000.
D)increase by 60000.
,where y is the demand for Product A (in 1000s)and x is the price of the product (in $). Refer to Exhibit 14-3.If the price of the good increases by $3,then we expect demand for Product A toA)increase by 60.
B)decrease by 60.
C)decrease by 60000.
D)increase by 60000.
Question
Exhibit 14-2.A statistics student is asked to estimate  .She calculates the following values.
  Refer to Exhibit 14-2.What is y if x equals 2?
A)6.62
B)11.78
C)58.22
D)63.38
.She calculates the following values. Refer to Exhibit 14-2.What is y if x equals 2?A)6.62
B)11.78
C)58.22
D)63.38
Question
Exhibit 14-1.Over the past 30 years,the sample standard deviations of the rates of return for stock X and Stock Y were 0.20 and 0.12,respectively.The sample covariance between the returns of X and Y is 0.0096. Refer to Exhibit 14-1.In order to determine whether the correlation coefficient is significantly different from zero,the appropriate hypotheses are:
A)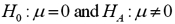
B)
C)
D)
A)
B)
C)
D)
Question
Exhibit 14-5.An marketing analyst wants to examine the relationship between sales (in $1,000s)and advertising (in $100s)for firms in the food and beverage industry and collects monthly data for 25 firms.He estimates the model  .The following table below shows a portion of the regression results.
  Refer to Exhibit 14-5.Predict Sales for a firm with Advertising of $500.
A)$1,480
B)$40,100
C)$54,500
D)$148,000
.The following table below shows a portion of the regression results. Refer to Exhibit 14-5.Predict Sales for a firm with Advertising of $500.A)$1,480
B)$40,100
C)$54,500
D)$148,000
Question
Exhibit 14-4.Consider the following sample regression equation  ,where y is the supply for Product A (in 1000s)and x is the price of Product A (in $). Refer to Exhibit 14-4.The slope coefficient indicates that if
A)the price of Product A increases by $1,then on average,supply decreases by 10.
B)the price of Product A increases by $1,then on average,supply increases by 10.
C)the price of Product A increases by $1,then on average,supply decreases by 10,000.
D)the price of Product A increases by $1,then on average,supply increases by 10,000.
,where y is the supply for Product A (in 1000s)and x is the price of Product A (in $). Refer to Exhibit 14-4.The slope coefficient indicates that ifA)the price of Product A increases by $1,then on average,supply decreases by 10.
B)the price of Product A increases by $1,then on average,supply increases by 10.
C)the price of Product A increases by $1,then on average,supply decreases by 10,000.
D)the price of Product A increases by $1,then on average,supply increases by 10,000.
Question
Exhibit 14-5.An marketing analyst wants to examine the relationship between sales (in $1,000s)and advertising (in $100s)for firms in the food and beverage industry and collects monthly data for 25 firms.He estimates the model  .The following table below shows a portion of the regression results.
  Refer to Exhibit 14-5.Calculate the standard error of the estimate.
A)4.68
B)8.86
C)21.91
D)78.53
.The following table below shows a portion of the regression results. Refer to Exhibit 14-5.Calculate the standard error of the estimate.A)4.68
B)8.86
C)21.91
D)78.53
Question
Exhibit 14-3.Consider the following sample regression equation  ,where y is the demand for Product A (in 1000s)and x is the price of the product (in $). Refer to Exhibit 14-3.The slope coefficient indicates that if
A)the price of Product A increases by $1,then on average,demand decreases by 20.
B)the price of Product A increases by $1,then on average,demand increases by 20.
C)the price of Product A increases by $1,then on average,demand decreases by 20000.
D)the price of Product A increases by $1,then on average,demand increases by 20000.
,where y is the demand for Product A (in 1000s)and x is the price of the product (in $). Refer to Exhibit 14-3.The slope coefficient indicates that ifA)the price of Product A increases by $1,then on average,demand decreases by 20.
B)the price of Product A increases by $1,then on average,demand increases by 20.
C)the price of Product A increases by $1,then on average,demand decreases by 20000.
D)the price of Product A increases by $1,then on average,demand increases by 20000.

Unlock Deck
Sign up to unlock the cards in this deck!
Unlock Deck
Unlock Deck
1/116
Play
Full screen (f)
Deck 14: Regression Analysis
1
The value 0.35 of a sample correlation coefficient indicates a weaker linear relationship than that of -0.40.
True
2
A scatterplot can help determine if two variables are related in some systematic way.
True
3
Compared to the sample correlation coefficient,the sample covariance is a better measure to gauge the strength of the linear relationship between two variables.
False
4
The value 0.75 of a sample correlation coefficient indicates a stronger linear relationship than that of 0.60.
Unlock Deck
Unlock for access to all 116 flashcards in this deck.
Unlock Deck
k this deck
5
Each point in the scatterplot represents one observed value for one variable.
Unlock Deck
Unlock for access to all 116 flashcards in this deck.
Unlock Deck
k this deck
6
The value -0.75 of a sample correlation coefficient indicates a stronger linear relationship than that of 0.60.
Unlock Deck
Unlock for access to all 116 flashcards in this deck.
Unlock Deck
k this deck
7
In the simple linear regression model,β0 is the y-intercept of the line .
. Unlock Deck
Unlock for access to all 116 flashcards in this deck.
Unlock Deck
k this deck
8
In testing the population correlation coefficient,the alternative hypothesis is .
. Unlock Deck
Unlock for access to all 116 flashcards in this deck.
Unlock Deck
k this deck
9
Which of the following identifies the range for a correlation coefficient?
A)Any value less than 1
B)Any value greater than 0
C)Any value between 0 and 1
D)None of the above
A)Any value less than 1
B)Any value greater than 0
C)Any value between 0 and 1
D)None of the above
Unlock Deck
Unlock for access to all 116 flashcards in this deck.
Unlock Deck
k this deck
10
The positive square root of the coefficient of determination in simple linear regression is always equal to the correlation coefficient.
Unlock Deck
Unlock for access to all 116 flashcards in this deck.
Unlock Deck
k this deck
11
The correlation coefficient could be considered as a "standardized covariance."
Unlock Deck
Unlock for access to all 116 flashcards in this deck.
Unlock Deck
k this deck
12
The sample correlation coefficient cannot equal zero.
Unlock Deck
Unlock for access to all 116 flashcards in this deck.
Unlock Deck
k this deck
13
A correlation coefficient r = -0.85 could indicate a:
A)Very weak positive linear relationship.
B)Very strong negative linear relationship.
C)Very weak negative linear relationship.
D)Very strong positive linear relationship.
A)Very weak positive linear relationship.
B)Very strong negative linear relationship.
C)Very weak negative linear relationship.
D)Very strong positive linear relationship.
Unlock Deck
Unlock for access to all 116 flashcards in this deck.
Unlock Deck
k this deck
14
The following scatterplot implies that the relationship between the two variables x and y is:
A)Strong and positive.
B)Strong and negative.
C)Weak and negative.
D)No relationship.
A)Strong and positive.
B)Strong and negative.
C)Weak and negative.
D)No relationship.
Unlock Deck
Unlock for access to all 116 flashcards in this deck.
Unlock Deck
k this deck
15
If two linear regression models have the same number of explanatory variables,a model with an R2 value of 0.45 is a better prediction model than a model with an R2 value of 0.65.
Unlock Deck
Unlock for access to all 116 flashcards in this deck.
Unlock Deck
k this deck
16
Another name for an explanatory variable is the dependent variable.
Unlock Deck
Unlock for access to all 116 flashcards in this deck.
Unlock Deck
k this deck
17
Simple linear regression includes more than one explanatory variable.
Unlock Deck
Unlock for access to all 116 flashcards in this deck.
Unlock Deck
k this deck
18
The simple linear regression model can be written in the form
Unlock Deck
Unlock for access to all 116 flashcards in this deck.
Unlock Deck
k this deck
19
The correlation coefficient can only range between 0 and 1.
Unlock Deck
Unlock for access to all 116 flashcards in this deck.
Unlock Deck
k this deck
20
Covariance can be used to determine if the linear relationship between two variables is positive or negative.
Unlock Deck
Unlock for access to all 116 flashcards in this deck.
Unlock Deck
k this deck
21
Which of the following statements is least accurate concerning correlation analysis?
A)Correlation does not imply causation.
B)The correlation coefficient captures only a linear relationship.
C)The correlation coefficient may not be a reliable measure when outliers are present in one or the both of the variables.
D)The correlation coefficient describes both the direction and strength of the relationship between two variables only if the two variables have the same units of measurement.
Unlock Deck
Unlock for access to all 116 flashcards in this deck.
Unlock Deck
k this deck
22
Consider the following data: ,and .What is the sample regression equation?
A)
B)
C)
D)
,and .What is the sample regression equation?A)
B)
C)
D)
Unlock Deck
Unlock for access to all 116 flashcards in this deck.
Unlock Deck
k this deck
23
Given the augmented Phillips model: ,where y = actual rate of inflation (%),x1 = unemployment rate (%),and x2 = anticipated inflation rate (%).The response variable(s)in this model is(are)the:
A)Unemployment rate
B)Actual inflation rate
C)Anticipated inflation rate
D)Unemployment rate and anticipated inflation rate
,where y = actual rate of inflation (%),x1 = unemployment rate (%),and x2 = anticipated inflation rate (%).The response variable(s)in this model is(are)the:A)Unemployment rate
B)Actual inflation rate
C)Anticipated inflation rate
D)Unemployment rate and anticipated inflation rate
Unlock Deck
Unlock for access to all 116 flashcards in this deck.
Unlock Deck
k this deck
24
When testing whether the correlation coefficient differs from zero,the value of the test statistic is with a corresponding p-value of 0.0061.At the 5% significance level,can you conclude that the correlation coefficient differs from zero?
A)Yes,since the p-value is less than 0.05.
B)Yes,since the absolute value of the test statistic exceeds 0.05.
C)No,since the p-value is less than 0.05.
D)No,since the absolute value of the test statistic exceeds 0.05.
with a corresponding p-value of 0.0061.At the 5% significance level,can you conclude that the correlation coefficient differs from zero?A)Yes,since the p-value is less than 0.05.
B)Yes,since the absolute value of the test statistic exceeds 0.05.
C)No,since the p-value is less than 0.05.
D)No,since the absolute value of the test statistic exceeds 0.05.
Unlock Deck
Unlock for access to all 116 flashcards in this deck.
Unlock Deck
k this deck
25
Simple linear regression analysis differs from multiple regression analysis in that:
A)Simple linear regression uses only one explanatory variable.
B)The coefficient of correlation is meaningless in simple linear regression.
C)Goodness-of-fit measures cannot be calculated with simple linear regression.
D)The coefficient of determination is always higher in simple linear regression.
A)Simple linear regression uses only one explanatory variable.
B)The coefficient of correlation is meaningless in simple linear regression.
C)Goodness-of-fit measures cannot be calculated with simple linear regression.
D)The coefficient of determination is always higher in simple linear regression.
Unlock Deck
Unlock for access to all 116 flashcards in this deck.
Unlock Deck
k this deck
26
The following scatterplot implies that the relationship between the two variables x and y is:
A)Weak and positive.
B)Strong and positive.
C)Strong and negative.
D)No relationship.
A)Weak and positive.
B)Strong and positive.
C)Strong and negative.
D)No relationship.
Unlock Deck
Unlock for access to all 116 flashcards in this deck.
Unlock Deck
k this deck
27
A regression equation was estimated as .If and ,the predicted value of y would be:
A)29.
B)77.
C)233.
D)281.
.If and ,the predicted value of y would be:A)29.
B)77.
C)233.
D)281.
Unlock Deck
Unlock for access to all 116 flashcards in this deck.
Unlock Deck
k this deck
28
In the sample regression equation ,what is ?
A)The y-intercept
B)The slope of the equation
C)The value of y when x = 0
D)The predicted value of y,given a specific x value
,what is ?A)The y-intercept
B)The slope of the equation
C)The value of y when x = 0
D)The predicted value of y,given a specific x value
Unlock Deck
Unlock for access to all 116 flashcards in this deck.
Unlock Deck
k this deck
29
Consider the following simple linear regression model: .The explanatory variable is:
A)y
B)x
C)ε
D)β0
.The explanatory variable is:A)y
B)x
C)ε
D)β0
Unlock Deck
Unlock for access to all 116 flashcards in this deck.
Unlock Deck
k this deck
30
The variance of the rates of return is 0.25 for stock X and 0.01 for stock Y.The covariance between the returns of X and Y is -0.01.The correlation of the rates of return between X and Y is:
A)-0.25
B)-0.20
C)0.20
D)0.25
A)-0.25
B)-0.20
C)0.20
D)0.25
Unlock Deck
Unlock for access to all 116 flashcards in this deck.
Unlock Deck
k this deck
31
When testing whether the correlation coefficient differs from zero,the value of the test statistic is with a corresponding p-value of 0.0653.At the 5% significance level,can you conclude that the correlation coefficient differs from zero?
A)Yes,since the p-value exceeds 0.05.
B)Yes,since the test statistic value of 1.95 exceeds 0.05.
C)No,since the p-value exceeds 0.05.
D)No,since the test statistic value of 1.95 exceeds 0.05.
with a corresponding p-value of 0.0653.At the 5% significance level,can you conclude that the correlation coefficient differs from zero?A)Yes,since the p-value exceeds 0.05.
B)Yes,since the test statistic value of 1.95 exceeds 0.05.
C)No,since the p-value exceeds 0.05.
D)No,since the test statistic value of 1.95 exceeds 0.05.
Unlock Deck
Unlock for access to all 116 flashcards in this deck.
Unlock Deck
k this deck
32
Consider the following simple linear regression model: .The random error term is:
A)y
B)x
C)ε
D)β0
.The random error term is:A)y
B)x
C)ε
D)β0
Unlock Deck
Unlock for access to all 116 flashcards in this deck.
Unlock Deck
k this deck
33
A regression equation was estimated as .If ,the predicted value of y is:
A)-80
B)-90
C)110
D)120
.If ,the predicted value of y is:A)-80
B)-90
C)110
D)120
Unlock Deck
Unlock for access to all 116 flashcards in this deck.
Unlock Deck
k this deck
34
The sample standard deviations for x and y are 10 and 15,respectively.The covariance between x and y is -300.The correlation coefficient between x and y is:
A)-2
B)-0.5
C)0.5
D)2
A)-2
B)-0.5
C)0.5
D)2
Unlock Deck
Unlock for access to all 116 flashcards in this deck.
Unlock Deck
k this deck
35
Consider the following data: ,and .Calculate the sample correlation coefficient, .
A)-0.40
B)-0.20
C)0.20
D)0.40
,and .Calculate the sample correlation coefficient, .A)-0.40
B)-0.20
C)0.20
D)0.40
Unlock Deck
Unlock for access to all 116 flashcards in this deck.
Unlock Deck
k this deck
36
Consider the following data: ,and .Calculate the sample correlation coefficient, .
A)-0.40
B)-0.20
C)0.20
D)0.40
,and .Calculate the sample correlation coefficient, .A)-0.40
B)-0.20
C)0.20
D)0.40
Unlock Deck
Unlock for access to all 116 flashcards in this deck.
Unlock Deck
k this deck
37
Consider the following data: ,and .What is the sample regression equation?
A)
B)
C)
D)
,and .What is the sample regression equation?A)
B)
C)
D)
Unlock Deck
Unlock for access to all 116 flashcards in this deck.
Unlock Deck
k this deck
38
What is the name of the variable that's used to predict another variable?
A)Response
B)Explanatory
C)Coefficient of determination
D)Standard error of the estimate
A)Response
B)Explanatory
C)Coefficient of determination
D)Standard error of the estimate
Unlock Deck
Unlock for access to all 116 flashcards in this deck.
Unlock Deck
k this deck
39
Consider the following simple linear regression model: ;β0 and β1 are:
A)the response variables.
B)the random error terms.
C)the unknown parameters.
D)the explanatory variables.
;β0 and β1 are:A)the response variables.
B)the random error terms.
C)the unknown parameters.
D)the explanatory variables.
Unlock Deck
Unlock for access to all 116 flashcards in this deck.
Unlock Deck
k this deck
40
Consider the following simple linear regression model: .The response variable is:
A)y
B)x
C)ε
D)β0
.The response variable is:A)y
B)x
C)ε
D)β0
Unlock Deck
Unlock for access to all 116 flashcards in this deck.
Unlock Deck
k this deck
41
Calculate the value of given the ANOVA portion of the following regression output:
A)0.151
B)0.515
C)0.849
D)1.000
given the ANOVA portion of the following regression output: A)0.151
B)0.515
C)0.849
D)1.000
Unlock Deck
Unlock for access to all 116 flashcards in this deck.
Unlock Deck
k this deck
42
Using the same data set,four models are estimated using the same response variable,however,the number of explanatory variables differs.Which model provides the best fit?
A)Model 1
B)Model 2
C)Model 3
D)Model 4
A)Model 1
B)Model 2
C)Model 3
D)Model 4
Unlock Deck
Unlock for access to all 116 flashcards in this deck.
Unlock Deck
k this deck
43
In a simple linear regression model,if the plots on a scatter diagram lie on a straight line,what is the coefficient of determination?
A)-1
B)0
C)+1
D)Infinity
A)-1
B)0
C)+1
D)Infinity
Unlock Deck
Unlock for access to all 116 flashcards in this deck.
Unlock Deck
k this deck
44
Consider the sample regression equation: ,with an R2 value of 0.81.What is the value of the correlation coefficient between x and y?
A)-0.90
B)-0.81
C)0.81
D)0.90
,with an R2 value of 0.81.What is the value of the correlation coefficient between x and y?A)-0.90
B)-0.81
C)0.81
D)0.90
Unlock Deck
Unlock for access to all 116 flashcards in this deck.
Unlock Deck
k this deck
45
In the estimation of a multiple regression model with two explanatory variables and 20 observations, and .What is the value of R2?
A)0.10
B)0.45
C)0.55
D)0.90
and .What is the value of R2?A)0.10
B)0.45
C)0.55
D)0.90
Unlock Deck
Unlock for access to all 116 flashcards in this deck.
Unlock Deck
k this deck
46
In a simple linear regression model,if the plots on a scatter diagram lie on a straight line,what is the standard error of the estimate?
A)-1
B)0
C)+1
D)Infinity
A)-1
B)0
C)+1
D)Infinity
Unlock Deck
Unlock for access to all 116 flashcards in this deck.
Unlock Deck
k this deck
47
The standard error of the estimate measures
A)the variability of the explanatory variables.
B)the variability of the values of the sample regression coefficients.
C)the variability of the observed y-values around the predicted y-values.
D)the variability of the predicted y-values around the mean of the observed y-values.
A)the variability of the explanatory variables.
B)the variability of the values of the sample regression coefficients.
C)the variability of the observed y-values around the predicted y-values.
D)the variability of the predicted y-values around the mean of the observed y-values.
Unlock Deck
Unlock for access to all 116 flashcards in this deck.
Unlock Deck
k this deck
48
The coefficient of determination R2 is ________.
A)sometimes negative.
B)always lower than adjusted R2
C)usually higher than adjusted R2
D)always equal to adjusted R2
A)sometimes negative.
B)always lower than adjusted R2
C)usually higher than adjusted R2
D)always equal to adjusted R2
Unlock Deck
Unlock for access to all 116 flashcards in this deck.
Unlock Deck
k this deck
49
Consider the sample regression equation: ,with an R2 value of 0.65.What is the value of the correlation coefficient between x and y?
A)-0.81
B)-0.65
C)0.81
D)0.65
,with an R2 value of 0.65.What is the value of the correlation coefficient between x and y?A)-0.81
B)-0.65
C)0.81
D)0.65
Unlock Deck
Unlock for access to all 116 flashcards in this deck.
Unlock Deck
k this deck
50
Which of the following is not true of the standard error of the estimate?
A)It can take on negative values.
B)Theoretically,its value has no predefined upper limit.
C)It is a measure of the accuracy of the regression model.
D)It is based on the squared deviations between the actual and predicted values of the response variable.
A)It can take on negative values.
B)Theoretically,its value has no predefined upper limit.
C)It is a measure of the accuracy of the regression model.
D)It is based on the squared deviations between the actual and predicted values of the response variable.
Unlock Deck
Unlock for access to all 116 flashcards in this deck.
Unlock Deck
k this deck
51
The capital asset pricing model is given by: ,where = expected return on the market, = risk-free market return,and = expected return on a stock or portfolio of interest.The explanatory variable in this model is:
A) .
B) .
C) .
D)
,where = expected return on the market, = risk-free market return,and = expected return on a stock or portfolio of interest.The explanatory variable in this model is:A)
.B)
.C)
.D)
Unlock Deck
Unlock for access to all 116 flashcards in this deck.
Unlock Deck
k this deck
52
Consider the sample regression equation: .When x1 increases 1 unit and x2 increases 2 units,while x3 and x4 remain unchanged,what change would you expect in the predicted y?
A)Decrease by 2
B)Decrease by 4
C)Decrease by 7
D)No change in predicted y
.When x1 increases 1 unit and x2 increases 2 units,while x3 and x4 remain unchanged,what change would you expect in the predicted y?A)Decrease by 2
B)Decrease by 4
C)Decrease by 7
D)No change in predicted y
Unlock Deck
Unlock for access to all 116 flashcards in this deck.
Unlock Deck
k this deck
53
Consider the sample regression equation: .When x1 increases 1 unit and x2 increases 2 units,while x3 and x4 remain unchanged,what change would you expect in the predicted y?
A)Decrease by 2
B)Decrease by 10
C)Increase by 2
D)No change in the predicted y
.When x1 increases 1 unit and x2 increases 2 units,while x3 and x4 remain unchanged,what change would you expect in the predicted y?A)Decrease by 2
B)Decrease by 10
C)Increase by 2
D)No change in the predicted y
Unlock Deck
Unlock for access to all 116 flashcards in this deck.
Unlock Deck
k this deck
54
The R2 of a multiple regression of y on x1 and x2 measures the
A)Percent variability of y that is explained by the variability of x1.
B)Percent variability of y that is explained by the variability of x2
C)Statistical significance of the coefficients in the regression equation.
D)Percent variability of y that is explained by the variability of x1 and x2.
A)Percent variability of y that is explained by the variability of x1.
B)Percent variability of y that is explained by the variability of x2
C)Statistical significance of the coefficients in the regression equation.
D)Percent variability of y that is explained by the variability of x1 and x2.
Unlock Deck
Unlock for access to all 116 flashcards in this deck.
Unlock Deck
k this deck
55
Given the augmented Phillips model: ,where y = actual rate of inflation (%),x1 = unemployment rate (%),and x2 = anticipated inflation rate (%).The explanatory variable(s)in this model is(are)the:
A)Unemployment rate
B)Actual inflation rate
C)Anticipated inflation rate
D)Unemployment rate and anticipated inflation rate
,where y = actual rate of inflation (%),x1 = unemployment rate (%),and x2 = anticipated inflation rate (%).The explanatory variable(s)in this model is(are)the:A)Unemployment rate
B)Actual inflation rate
C)Anticipated inflation rate
D)Unemployment rate and anticipated inflation rate
Unlock Deck
Unlock for access to all 116 flashcards in this deck.
Unlock Deck
k this deck
56
The standard error of the estimate measures
A)the standard deviation of the residuals.
B)the standard deviation of the response variable.
C)the standard deviation of the explanatory variable.
D)the standard deviation of the correlation coefficient.
A)the standard deviation of the residuals.
B)the standard deviation of the response variable.
C)the standard deviation of the explanatory variable.
D)the standard deviation of the correlation coefficient.
Unlock Deck
Unlock for access to all 116 flashcards in this deck.
Unlock Deck
k this deck
57
The capital asset pricing model is given by: ,where = expected return on the market, = risk-free market return,and = expected return on a stock or portfolio of interest.The response variable in this model is:
A) .
B) .
C) .
D)
,where = expected return on the market, = risk-free market return,and = expected return on a stock or portfolio of interest.The response variable in this model is:A)
.B)
.C)
.D)
Unlock Deck
Unlock for access to all 116 flashcards in this deck.
Unlock Deck
k this deck
58
A simple linear regression of the return of firm A ( )on the return of firm B ( ),based on 18 observations,is = 2.2 + 0.4 .If the coefficient of determination from this regression is 0.09 calculate the correlation between and .
A)0.03
B)0.04
C)0.09
D)0.30
)on the return of firm B ( ),based on 18 observations,is = 2.2 + 0.4 .If the coefficient of determination from this regression is 0.09 calculate the correlation between and .A)0.03
B)0.04
C)0.09
D)0.30
Unlock Deck
Unlock for access to all 116 flashcards in this deck.
Unlock Deck
k this deck
59
When two regression models applied on the same data set have the same response variable but a different number of explanatory variables,the model that would evidently provide the better fit is the one with a
A)Lower standard error of the estimate and a higher coefficient of determination.
B)Higher standard error of the estimate and a higher coefficient of determination.
C)Higher coefficient of determination and a lower adjusted coefficient of determination.
D)Lower standard error of the estimate and a higher adjusted coefficient of determination.
Unlock Deck
Unlock for access to all 116 flashcards in this deck.
Unlock Deck
k this deck
60
Unlike the coefficient of determination,the coefficient of correlation in a simple linear regression
A)Can never have an absolute value greater than 1.
B)Measures the percentage of variation explained by the regression line.
C)Indicates whether the slope of the regression line is positive or negative.
D)Measures the strength of association between the two variables more exactly.
A)Can never have an absolute value greater than 1.
B)Measures the percentage of variation explained by the regression line.
C)Indicates whether the slope of the regression line is positive or negative.
D)Measures the strength of association between the two variables more exactly.
Unlock Deck
Unlock for access to all 116 flashcards in this deck.
Unlock Deck
k this deck
61
Exhibit 14-5.An marketing analyst wants to examine the relationship between sales (in $1,000s)and advertising (in $100s)for firms in the food and beverage industry and collects monthly data for 25 firms.He estimates the model .The following table below shows a portion of the regression results. Refer to Exhibit 14-5.Calculate the coefficient of determination.
A)0.1348
B)0.1558
C)0.8442
D)0.8652
.The following table below shows a portion of the regression results. Refer to Exhibit 14-5.Calculate the coefficient of determination.A)0.1348
B)0.1558
C)0.8442
D)0.8652
Unlock Deck
Unlock for access to all 116 flashcards in this deck.
Unlock Deck
k this deck
62
Exhibit 14-5.An marketing analyst wants to examine the relationship between sales (in $1,000s)and advertising (in $100s)for firms in the food and beverage industry and collects monthly data for 25 firms.He estimates the model .The following table below shows a portion of the regression results. Refer to Exhibit 14-5.Interpret the slope coefficient.
A)If Advertising goes up by $100,then on average,Sales go up by $2,880.
B)If Sales go up by $100,then on average,Advertising goes up by $2,880.
C)If Advertising goes up by $100,then on average,Sales go up by $4,298.
D)If Sales go up by $100,then on average,Advertising goes up by $4,298.
.The following table below shows a portion of the regression results. Refer to Exhibit 14-5.Interpret the slope coefficient.A)If Advertising goes up by $100,then on average,Sales go up by $2,880.
B)If Sales go up by $100,then on average,Advertising goes up by $2,880.
C)If Advertising goes up by $100,then on average,Sales go up by $4,298.
D)If Sales go up by $100,then on average,Advertising goes up by $4,298.
Unlock Deck
Unlock for access to all 116 flashcards in this deck.
Unlock Deck
k this deck
63
Exhibit 14-2.A statistics student is asked to estimate .She calculates the following values. Refer to Exhibit 14-2.What is the sample regression equation?
A)
B)
C)
D)
.She calculates the following values. Refer to Exhibit 14-2.What is the sample regression equation?A)
B)
C)
D)
Unlock Deck
Unlock for access to all 116 flashcards in this deck.
Unlock Deck
k this deck
64
In the estimation of a multiple regression model with two explanatory variables and 20 observations, and .The value of adjusted R2 is closest to:
A)0.39
B)0.45
C)0.55
D)0.61
and .The value of adjusted R2 is closest to:A)0.39
B)0.45
C)0.55
D)0.61
Unlock Deck
Unlock for access to all 116 flashcards in this deck.
Unlock Deck
k this deck
65
Exhibit 14-3.Consider the following sample regression equation ,where y is the demand for Product A (in 1000s)and x is the price of the product (in $). Refer to Exhibit 14-3.If the price of Product A is $5,then we expect demand to be
A)50
B)500
C)5,000
D)50,000.
,where y is the demand for Product A (in 1000s)and x is the price of the product (in $). Refer to Exhibit 14-3.If the price of Product A is $5,then we expect demand to beA)50
B)500
C)5,000
D)50,000.
Unlock Deck
Unlock for access to all 116 flashcards in this deck.
Unlock Deck
k this deck
66
Exhibit 14-2.A statistics student is asked to estimate .She calculates the following values. Refer to Exhibit 14-2.Calculate b1.
A)-1.29
B)-0.51
C)0.51
D)1.29
.She calculates the following values. Refer to Exhibit 14-2.Calculate b1.A)-1.29
B)-0.51
C)0.51
D)1.29
Unlock Deck
Unlock for access to all 116 flashcards in this deck.
Unlock Deck
k this deck
67
In the estimation of a multiple regression model with four explanatory variables and 25 observations, and .What is the value of R2?
A)0.16
B)0.34
C)0.66
D)0.84
and .What is the value of R2?A)0.16
B)0.34
C)0.66
D)0.84
Unlock Deck
Unlock for access to all 116 flashcards in this deck.
Unlock Deck
k this deck
68
Exhibit 14-6.A manager at a local bank analyzed the relationship between monthly salary (y,in $)and length of service (x,measured in months)for 30 employees.She estimates .The following table summarizes a portion of the regression results: Refer to Exhibit 14-6.The monthly salary of an employee that has worked for 48 months at the bank is closest to:
A)$441.
B)$785.
C)$1050.
D)$1226.
.The following table summarizes a portion of the regression results: Refer to Exhibit 14-6.The monthly salary of an employee that has worked for 48 months at the bank is closest to:A)$441.
B)$785.
C)$1050.
D)$1226.
Unlock Deck
Unlock for access to all 116 flashcards in this deck.
Unlock Deck
k this deck
69
In the estimation of a multiple regression model with four explanatory variables and 25 observations, and .The value of adjusted R2 is closest to:
A)0.21
B)0.34
C)0.66
D)0.79
and .The value of adjusted R2 is closest to:A)0.21
B)0.34
C)0.66
D)0.79
Unlock Deck
Unlock for access to all 116 flashcards in this deck.
Unlock Deck
k this deck
70
Exhibit 14-1.Over the past 30 years,the sample standard deviations of the rates of return for stock X and Stock Y were 0.20 and 0.12,respectively.The sample covariance between the returns of X and Y is 0.0096. Refer to Exhibit 14-1.The correlation of the rates of return between X and Y is closest to:
A)0.20
B)0.24
C)0.36
D)0.40
A)0.20
B)0.24
C)0.36
D)0.40
Unlock Deck
Unlock for access to all 116 flashcards in this deck.
Unlock Deck
k this deck
71
Exhibit 14-1.Over the past 30 years,the sample standard deviations of the rates of return for stock X and Stock Y were 0.20 and 0.12,respectively.The sample covariance between the returns of X and Y is 0.0096. Refer to Exhibit 14-1.When testing whether the correlation coefficient differs from zero,the value of the test statistic is .At the 5% significance level,the critical value is .The conclusion to the hypothesis test is to:
A)Reject H0;we can conclude that the correlation coefficient differs from zero.
B)Reject H0;we cannot conclude that the correlation coefficient differs from zero.
C)Do not reject H0;we can conclude that the correlation coefficient differs from zero.
D)Do not reject H0;we cannot conclude that the correlation coefficient differs from zero.
.At the 5% significance level,the critical value is .The conclusion to the hypothesis test is to:A)Reject H0;we can conclude that the correlation coefficient differs from zero.
B)Reject H0;we cannot conclude that the correlation coefficient differs from zero.
C)Do not reject H0;we can conclude that the correlation coefficient differs from zero.
D)Do not reject H0;we cannot conclude that the correlation coefficient differs from zero.
Unlock Deck
Unlock for access to all 116 flashcards in this deck.
Unlock Deck
k this deck
72
Exhibit 14-4.Consider the following sample regression equation ,where y is the supply for Product A (in 1000s)and x is the price of Product A (in $). Refer to Exhibit 14-4.If the price of Product A increases by $3,then we expect the supply for Product A to
A)increase by 30.
B)decrease by 30.
C)increase by 30,000.
D)decrease by 30,000.
,where y is the supply for Product A (in 1000s)and x is the price of Product A (in $). Refer to Exhibit 14-4.If the price of Product A increases by $3,then we expect the supply for Product A toA)increase by 30.
B)decrease by 30.
C)increase by 30,000.
D)decrease by 30,000.
Unlock Deck
Unlock for access to all 116 flashcards in this deck.
Unlock Deck
k this deck
73
Exhibit 14-4.Consider the following sample regression equation ,where y is the supply for Product A (in 1000s)and x is the price of Product A (in $). Refer to Exhibit 14-4.If the price of Product A is $5,then we expect supply to be
A)250
B)2,500
C)25,000
D)250,000.
,where y is the supply for Product A (in 1000s)and x is the price of Product A (in $). Refer to Exhibit 14-4.If the price of Product A is $5,then we expect supply to beA)250
B)2,500
C)25,000
D)250,000.
Unlock Deck
Unlock for access to all 116 flashcards in this deck.
Unlock Deck
k this deck
74
Exhibit 14-3.Consider the following sample regression equation ,where y is the demand for Product A (in 1000s)and x is the price of the product (in $). Refer to Exhibit 14-3.If the price of the good increases by $3,then we expect demand for Product A to
A)increase by 60.
B)decrease by 60.
C)decrease by 60000.
D)increase by 60000.
,where y is the demand for Product A (in 1000s)and x is the price of the product (in $). Refer to Exhibit 14-3.If the price of the good increases by $3,then we expect demand for Product A toA)increase by 60.
B)decrease by 60.
C)decrease by 60000.
D)increase by 60000.
Unlock Deck
Unlock for access to all 116 flashcards in this deck.
Unlock Deck
k this deck
75
Exhibit 14-2.A statistics student is asked to estimate .She calculates the following values. Refer to Exhibit 14-2.What is y if x equals 2?
A)6.62
B)11.78
C)58.22
D)63.38
.She calculates the following values. Refer to Exhibit 14-2.What is y if x equals 2?A)6.62
B)11.78
C)58.22
D)63.38
Unlock Deck
Unlock for access to all 116 flashcards in this deck.
Unlock Deck
k this deck
76
Exhibit 14-1.Over the past 30 years,the sample standard deviations of the rates of return for stock X and Stock Y were 0.20 and 0.12,respectively.The sample covariance between the returns of X and Y is 0.0096. Refer to Exhibit 14-1.In order to determine whether the correlation coefficient is significantly different from zero,the appropriate hypotheses are:
A)
B)
C)
D)
A)
B)
C)
D)
Unlock Deck
Unlock for access to all 116 flashcards in this deck.
Unlock Deck
k this deck
77
Exhibit 14-5.An marketing analyst wants to examine the relationship between sales (in $1,000s)and advertising (in $100s)for firms in the food and beverage industry and collects monthly data for 25 firms.He estimates the model .The following table below shows a portion of the regression results. Refer to Exhibit 14-5.Predict Sales for a firm with Advertising of $500.
A)$1,480
B)$40,100
C)$54,500
D)$148,000
.The following table below shows a portion of the regression results. Refer to Exhibit 14-5.Predict Sales for a firm with Advertising of $500.A)$1,480
B)$40,100
C)$54,500
D)$148,000
Unlock Deck
Unlock for access to all 116 flashcards in this deck.
Unlock Deck
k this deck
78
Exhibit 14-4.Consider the following sample regression equation ,where y is the supply for Product A (in 1000s)and x is the price of Product A (in $). Refer to Exhibit 14-4.The slope coefficient indicates that if
A)the price of Product A increases by $1,then on average,supply decreases by 10.
B)the price of Product A increases by $1,then on average,supply increases by 10.
C)the price of Product A increases by $1,then on average,supply decreases by 10,000.
D)the price of Product A increases by $1,then on average,supply increases by 10,000.
,where y is the supply for Product A (in 1000s)and x is the price of Product A (in $). Refer to Exhibit 14-4.The slope coefficient indicates that ifA)the price of Product A increases by $1,then on average,supply decreases by 10.
B)the price of Product A increases by $1,then on average,supply increases by 10.
C)the price of Product A increases by $1,then on average,supply decreases by 10,000.
D)the price of Product A increases by $1,then on average,supply increases by 10,000.
Unlock Deck
Unlock for access to all 116 flashcards in this deck.
Unlock Deck
k this deck
79
Exhibit 14-5.An marketing analyst wants to examine the relationship between sales (in $1,000s)and advertising (in $100s)for firms in the food and beverage industry and collects monthly data for 25 firms.He estimates the model .The following table below shows a portion of the regression results. Refer to Exhibit 14-5.Calculate the standard error of the estimate.
A)4.68
B)8.86
C)21.91
D)78.53
.The following table below shows a portion of the regression results. Refer to Exhibit 14-5.Calculate the standard error of the estimate.A)4.68
B)8.86
C)21.91
D)78.53
Unlock Deck
Unlock for access to all 116 flashcards in this deck.
Unlock Deck
k this deck
80
Exhibit 14-3.Consider the following sample regression equation ,where y is the demand for Product A (in 1000s)and x is the price of the product (in $). Refer to Exhibit 14-3.The slope coefficient indicates that if
A)the price of Product A increases by $1,then on average,demand decreases by 20.
B)the price of Product A increases by $1,then on average,demand increases by 20.
C)the price of Product A increases by $1,then on average,demand decreases by 20000.
D)the price of Product A increases by $1,then on average,demand increases by 20000.
,where y is the demand for Product A (in 1000s)and x is the price of the product (in $). Refer to Exhibit 14-3.The slope coefficient indicates that ifA)the price of Product A increases by $1,then on average,demand decreases by 20.
B)the price of Product A increases by $1,then on average,demand increases by 20.
C)the price of Product A increases by $1,then on average,demand decreases by 20000.
D)the price of Product A increases by $1,then on average,demand increases by 20000.
Unlock Deck
Unlock for access to all 116 flashcards in this deck.
Unlock Deck
k this deck
Unlock Deck
Unlock for access to all 116 flashcards in this deck.


