Exam 14: Regression Analysis
Exam 1: Statistics and Data68 Questions
Exam 2: Tabular and Graphical Methods99 Questions
Exam 3: Numerical Descriptive Measures123 Questions
Exam 4: Basic Probability Concepts107 Questions
Exam 5: Discrete Probability Distributions118 Questions
Exam 6: Continuous Probability Distributions114 Questions
Exam 7: Sampling and Sampling Distributions110 Questions
Exam 8: Interval Estimation111 Questions
Exam 9: Hypothesis Testing111 Questions
Exam 10: Statistical Inference Concerning Two Populations104 Questions
Exam 11: Statistical Inference Concerning Variance96 Questions
Exam 12: Chi-Square Tests100 Questions
Exam 13: Analysis of Variance89 Questions
Exam 14: Regression Analysis116 Questions
Exam 15: Inference With Regression Models117 Questions
Exam 16: Regression Models for Nonlinear Relationships95 Questions
Exam 17: Regression Models With Dummy Variables117 Questions
Exam 18: Time Series and Forecasting103 Questions
Exam 19: Returns, Index Numbers and Inflation98 Questions
Exam 20: Nonparametric Tests99 Questions
Select questions type
A researcher analyzes the relationship between amusement park attendance and the price of admission.She estimates the following model: 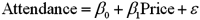 ,
where Attendance is the daily attendance (in 1000s)and Price is the gate price (in $).A portion of the regression results is shown in the accompanying table.
,
where Attendance is the daily attendance (in 1000s)and Price is the gate price (in $).A portion of the regression results is shown in the accompanying table.  a.Predict the Attendance for an amusement park that charges $80 for admission.
B)Interpret the slope coefficient attached to Price.
C)Calculate the standard error of the estimate.If the sample mean for Attendance is 75.9,what can you infer about the model's predictive power.
D)Calculate and interpret the coefficient of determination.How much of the variability in Attendance is unexplained.
a.Predict the Attendance for an amusement park that charges $80 for admission.
B)Interpret the slope coefficient attached to Price.
C)Calculate the standard error of the estimate.If the sample mean for Attendance is 75.9,what can you infer about the model's predictive power.
D)Calculate and interpret the coefficient of determination.How much of the variability in Attendance is unexplained.
Free
(Essay)
4.9/5  (29)
(29)
Correct Answer: Verified
a.86,600 people;
b.If the Price goes up by $1,then on average Attendance decreases by 3,100 people;
c.  ,since
  ,model may have some promise,but typically a ratio of less than 0.20 provides evidence of a good model.More assessing is necessary;
d.  ,61.5% of the variation in Attendance is explained by the variation in Price;this infers that 38.5% of the variability in Attendance is unexplained.
Consider the following simple linear regression model:  .The random error term is:
Free
(Multiple Choice)
4.8/5 (34)
Correct Answer:Verified
C
A statistics instructor wants to examine the relationship between the hours a student spends studying for the final exam (Hours)and a student's grade on the final exam (Grade).She takes a sample of five students. 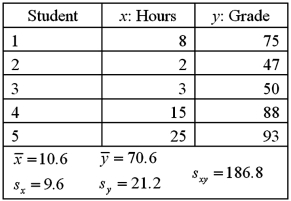 a.Compute the sample correlation coefficient.
B)Specify the competing hypotheses in order to determine whether the hours spent studying and the final grade are correlated.
C)Calculate the value of the test statistic and approximate the corresponding p-value.
D)At the 10% significance level,what is the conclusion to the test? Explain.
a.Compute the sample correlation coefficient.
B)Specify the competing hypotheses in order to determine whether the hours spent studying and the final grade are correlated.
C)Calculate the value of the test statistic and approximate the corresponding p-value.
D)At the 10% significance level,what is the conclusion to the test? Explain.
Free
(Essay)
4.8/5 (38)
Correct Answer:Verified
a.  ;
;
b.  ;
;
c.  ;using the t table,0.02 < p-value < 0.05;
d.Since the p-value < α = 0.10,we reject H0;we can conclude that the hours spent studying and the final grade are correlated.
Exhibit 14-6.A manager at a local bank analyzed the relationship between monthly salary (y,in $)and length of service (x,measured in months)for 30 employees.She estimates  .The following table summarizes a portion of the regression results:
 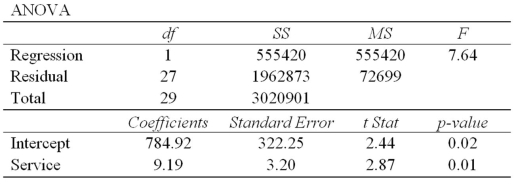 Refer to Exhibit 14-6.How much of the variation in Salary is unexplained by the model?
(Multiple Choice)
4.9/5 (30)
An economist examines the relationship between the number of patent applications filed and expenditures in research and development (R&D)for the 50 states and the District of Columbia.She believes that if a state spends more on research and development,then more patents will be filed.She estimates the following model: 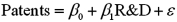 ,
where Patents is the number of patent applications filed and R&D is the state's expenditures on research and development (in $1,000,000s).Data was obtained from the 2012 Statistical Abstract of the United States for the year 2007.The regression results are shown in the accompanying table.
,
where Patents is the number of patent applications filed and R&D is the state's expenditures on research and development (in $1,000,000s).Data was obtained from the 2012 Statistical Abstract of the United States for the year 2007.The regression results are shown in the accompanying table.  a.Predict the number of patents filed for a state that spends $5,000,000 on R&D.
B)Interpret the coefficient attached to R&D.
C)Calculate the standard error of the estimate.
D)Interpret the coefficient of determination.
a.Predict the number of patents filed for a state that spends $5,000,000 on R&D.
B)Interpret the coefficient attached to R&D.
C)Calculate the standard error of the estimate.
D)Interpret the coefficient of determination.
(Essay)
4.8/5 (28)
In the estimation of a multiple regression model with four explanatory variables and 25 observations,  and
and  .The value of adjusted R2 is closest to:
(Multiple Choice)
4.9/5 (30)
Exhibit 14-9.When estimating  ,the following regression results were obtained.
 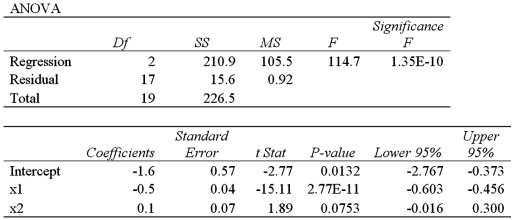 Refer to Exhibit 14-9.What is the adjusted R2?
(Multiple Choice)
4.8/5 (28)
Given the augmented Phillips model: 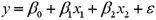 ,where y = actual rate of inflation (%),x1 = unemployment rate (%),and x2 = anticipated inflation rate (%).The explanatory variable(s)in this model is(are)the:
(Multiple Choice)
4.9/5 (28)
Consider the following sample data:  a.Construct a scatterplot and verify that estimating a simple linear regression is appropriate.
B)Calculate b0 and b1.What is the sample regression equation? Predict y if x equals 15.
C)Interpret the value of the slope coefficient,
a.Construct a scatterplot and verify that estimating a simple linear regression is appropriate.
B)Calculate b0 and b1.What is the sample regression equation? Predict y if x equals 15.
C)Interpret the value of the slope coefficient,  .
D)Calculate
.
D)Calculate  and
and  .
E)Calculate
.
E)Calculate  .
.
(Essay)
4.9/5 (32)
Using the same data set,four models are estimated using the same response variable,however,the number of explanatory variables differs.Which model provides the best fit? 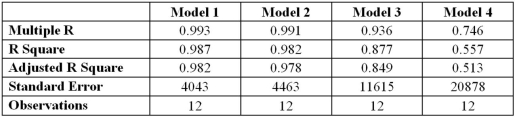
(Multiple Choice)
4.8/5 (37)
Each point in the scatterplot represents one observed value for one variable.
(True/False)
4.8/5 (29)
Exhibit 14-7.Assume you ran a multiple regression to gain a better understanding of the relationship between lumber sales,housing starts,and commercial construction.The regression uses lumber sales (in $100,000s)as the response variable with housing starts (in 1000s)and commercial construction (in 1000s)as the explanatory variables.The results of the regression are:  Refer to Exhibit 14-7.If housing starts were 17,000 and commercial construction was 3,200,the best estimate of lumber sales would be:
(Multiple Choice)
4.9/5 (37)
Exhibit 14-3.Consider the following sample regression equation  ,where y is the demand for Product A (in 1000s)and x is the price of the product (in $). Refer to Exhibit 14-3.If the price of Product A is $5,then we expect demand to be
(Multiple Choice)
4.9/5 (38)
Consider the following data:  ,and
,and  .Calculate the sample correlation coefficient,
  .
.
(Multiple Choice)
4.9/5 (30)
Exhibit 14-8.An real estate analyst believes that the three main factors that influence an apartment's rent in a college town are the number of bedrooms,the number of bathrooms,and the apartment's square footage.For 40 apartments,she collects data on the rent (y,in $),the number of bedrooms (x1),the number of bathrooms (x2),and its square footage (x3).She estimates the following model:  .The following table shows a portion of the regression results.
 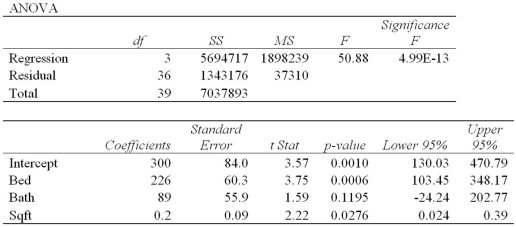 Refer to Exhibit 14-8.The standard deviation of the difference between actual rent and the estimate of rent is:
(Multiple Choice)
4.9/5 (36)
Exhibit 14-7.Assume you ran a multiple regression to gain a better understanding of the relationship between lumber sales,housing starts,and commercial construction.The regression uses lumber sales (in $100,000s)as the response variable with housing starts (in 1000s)and commercial construction (in 1000s)as the explanatory variables.The results of the regression are:  Refer to Exhibit 14-7.The standard deviation of the difference between actual lumber sales and the estimate of those sales is:
(Multiple Choice)
4.7/5 (34)
Consider the following information regarding a response variable y and an explanatory variable x. 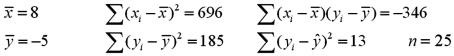 a.Calculate b0 and b1.
B)What is the sample regression equation? Predict y if x equals 10.
C)Calculate the standard error of the estimate.
D)Calculate and interpret the coefficient of determination.
a.Calculate b0 and b1.
B)What is the sample regression equation? Predict y if x equals 10.
C)Calculate the standard error of the estimate.
D)Calculate and interpret the coefficient of determination.
(Essay)
4.9/5 (38)
An investment analyst wants to examine the relationship between a mutual fund's return,its turnover rate and its expense ratio.She randomly selects 10 mutual funds and estimates: Return =  +
+  Turnover +
  Expense +
  ,where Return is the average five-year return (in %),Turnover is the annual holdings turnover (in %),Expense is the annual expense ratio (in %),and
  is the random error component.A portion of the regression results is shown in the accompanying table.
 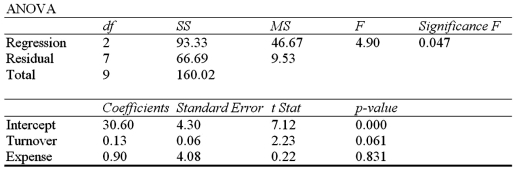 a.Predict the return for a mutual fund that has an annual holdings turnover of 60% and an annual expense ratio of 1.5%.
B)Interpret the slope coefficient attached to Expense.
C)Calculate the standard error of the estimate.If the sample mean for Return is 34.7%,what can you infer about the model's predictive power.
D)Calculate and interpret the coefficient of determination.
a.Predict the return for a mutual fund that has an annual holdings turnover of 60% and an annual expense ratio of 1.5%.
B)Interpret the slope coefficient attached to Expense.
C)Calculate the standard error of the estimate.If the sample mean for Return is 34.7%,what can you infer about the model's predictive power.
D)Calculate and interpret the coefficient of determination.
(Essay)
4.8/5 (30)
Exhibit 14-6.A manager at a local bank analyzed the relationship between monthly salary (y,in $)and length of service (x,measured in months)for 30 employees.She estimates  .The following table summarizes a portion of the regression results:
  Refer to Exhibit 14-6.The monthly salary of an employee that has worked for 48 months at the bank is closest to:
(Multiple Choice)
4.8/5 (36)
Simple linear regression includes more than one explanatory variable.
(True/False)
4.9/5 (32)
Filters
- Essay(0)
- Multiple Choice(0)
- Short Answer(0)
- True False(0)
- Matching(0)