Deck 12: Chi-Square Tests
Full screen (f)
Question
Question
Question
Which of the following null hypotheses is used to test if five population proportions are the same?
A)
B)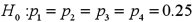
C)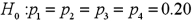
D)
A)
B)
C)
D)
Question
Question
Question
Question
Question
Question
Question
For a multinomial experiment,which of the following is not true?
A)The number of categories is at least two,
B)The trials are dependent
C)The sum of the category probabilities is 1,
D)The category probabilities are the same for each trial
A)The number of categories is at least two,
B)The trials are dependent
C)The sum of the category probabilities is 1,
D)The category probabilities are the same for each trial
Question
For the goodness-of-fit test,the sum of the expected frequencies must equal:
A)
B)n
C)k
D)k - 1
A)
B)n
C)k
D)k - 1
Question
Question
Question
Question
Question
Question
Question
For the chi-square test of a contingency table,the expected cell frequencies are found as 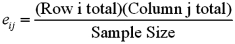 which is the same as:
A)The observed cell frequencies
B)The cell probability multiplied by the sample size
C)The row total
D)The column total
which is the same as:A)The observed cell frequencies
B)The cell probability multiplied by the sample size
C)The row total
D)The column total
Question
Question
Question
Question
Question
Question
Exhibit 12-1 A card dealing machine deals spades (1),hearts (2),clubs (3),and diamonds (4)at random as if from an infinite deck.In a randomness check,1,600 cards were dealt and counted.The results are shown below.  Refer to Exhibit 12.1.For the goodness-of-fit test,the value of the test statistic is:
A)2.25
B)3.125
C)6.45
D)7.815
Refer to Exhibit 12.1.For the goodness-of-fit test,the value of the test statistic is:A)2.25
B)3.125
C)6.45
D)7.815
Question
Exhibit 12-1 A card dealing machine deals spades (1),hearts (2),clubs (3),and diamonds (4)at random as if from an infinite deck.In a randomness check,1,600 cards were dealt and counted.The results are shown below.  Refer to Exhibit 12.1.Using the p-value approach and α = 0.05,the decision and conclusion are:
A)Do not reject the null hypothesis,all of the population proportions are the same
B)Reject the null hypothesis,conclude that not all proportions are equal to 0.20
C)Reject the null hypothesis,conclude that not all proportions are equal to 0.25
D)Do not reject the null hypothesis,cannot conclude that not all of the proportions are equal to 0.25
Refer to Exhibit 12.1.Using the p-value approach and α = 0.05,the decision and conclusion are:A)Do not reject the null hypothesis,all of the population proportions are the same
B)Reject the null hypothesis,conclude that not all proportions are equal to 0.20
C)Reject the null hypothesis,conclude that not all proportions are equal to 0.25
D)Do not reject the null hypothesis,cannot conclude that not all of the proportions are equal to 0.25
Question
Exhibit 12.2 A university has six colleges and takes a poll to gauge student support for a tuition increase.The university wants to insure each college is represented fairly.The below table shows the observed number students that participate in the poll from each college and the actual proportion of students in each college.  Refer to Exhibit 12.2.For the goodness-of-fit test,the alternative hypothesis states that
A)
B)
C)
D)
Refer to Exhibit 12.2.For the goodness-of-fit test,the alternative hypothesis states thatA)
B)
C)
D)
Question
Exhibit 12-1 A card dealing machine deals spades (1),hearts (2),clubs (3),and diamonds (4)at random as if from an infinite deck.In a randomness check,1,600 cards were dealt and counted.The results are shown below.  Refer to Exhibit 12.1.The p-value is:
A)Less than 0.01
B)Between 0.01 and 0.05
C)Between 0.05 and 0.10
D)Greater than 0.10
Refer to Exhibit 12.1.The p-value is:A)Less than 0.01
B)Between 0.01 and 0.05
C)Between 0.05 and 0.10
D)Greater than 0.10
Question
Exhibit 12-1 A card dealing machine deals spades (1),hearts (2),clubs (3),and diamonds (4)at random as if from an infinite deck.In a randomness check,1,600 cards were dealt and counted.The results are shown below.  Refer to Exhibit 12.1.For the goodness-of-fit test,the degrees of freedom are:
A)2
B)3
C)4
D)5
Refer to Exhibit 12.1.For the goodness-of-fit test,the degrees of freedom are:A)2
B)3
C)4
D)5
Question
Question
Exhibit 12.2 A university has six colleges and takes a poll to gauge student support for a tuition increase.The university wants to insure each college is represented fairly.The below table shows the observed number students that participate in the poll from each college and the actual proportion of students in each college.  Refer to Exhibit 12.2.For the goodness-of-fit test,the assumed degrees of freedom are:
A)2
B)3
C)4
D)5
Refer to Exhibit 12.2.For the goodness-of-fit test,the assumed degrees of freedom are:A)2
B)3
C)4
D)5
Question
Exhibit 12-1 A card dealing machine deals spades (1),hearts (2),clubs (3),and diamonds (4)at random as if from an infinite deck.In a randomness check,1,600 cards were dealt and counted.The results are shown below.  Refer to Exhibit 12.1.To test if the poker dealing machine deals cards at random,the null and alternative hypotheses are:
A)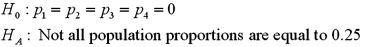
B)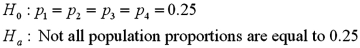
C)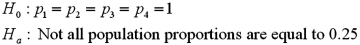
D)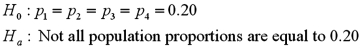
Refer to Exhibit 12.1.To test if the poker dealing machine deals cards at random,the null and alternative hypotheses are:A)
B)
C)
D)
Question
Question
For the goodness-of-fit test for normality,the null and alternative hypotheses are:
A)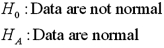
B)
C)
D)
A)
B)
C)
D)
Question
Exhibit 12-1 A card dealing machine deals spades (1),hearts (2),clubs (3),and diamonds (4)at random as if from an infinite deck.In a randomness check,1,600 cards were dealt and counted.The results are shown below.  Refer to Exhibit 12.1.At the 5% significance level,the critical value is:
A)6.251
B)7.815
C)9.348
D)11.345
Refer to Exhibit 12.1.At the 5% significance level,the critical value is:A)6.251
B)7.815
C)9.348
D)11.345
Question
Question
Exhibit 12.2 A university has six colleges and takes a poll to gauge student support for a tuition increase.The university wants to insure each college is represented fairly.The below table shows the observed number students that participate in the poll from each college and the actual proportion of students in each college.  Refer to Exhibit 12.2.What is the value of the goodness-of-fit test statistic?
A)3.08
B)15.09
C)15.64
D)16.75
Refer to Exhibit 12.2.What is the value of the goodness-of-fit test statistic?A)3.08
B)15.09
C)15.64
D)16.75
Question
For the Jarque-Bera test for normality,the null and alternative hypotheses are:
A)
B)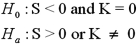
C)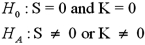
D)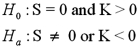
A)
B)
C)
D)
Question
Question
Question
Exhibit 12-1 A card dealing machine deals spades (1),hearts (2),clubs (3),and diamonds (4)at random as if from an infinite deck.In a randomness check,1,600 cards were dealt and counted.The results are shown below. 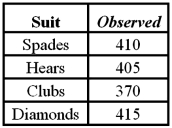 Refer to Exhibit 12.1.Using the critical value approach,the decision and conclusion are:
A)Do not reject the null hypothesis,cannot conclude that not all of the proportions are equal to 0.25
B)Do not reject the null hypothesis,all of the population proportions are the same
C)Reject the null hypothesis,conclude that not all proportions are equal to 0.25
D)Reject the null hypothesis,conclude that not all proportions are equal to 0.20
Refer to Exhibit 12.1.Using the critical value approach,the decision and conclusion are:A)Do not reject the null hypothesis,cannot conclude that not all of the proportions are equal to 0.25
B)Do not reject the null hypothesis,all of the population proportions are the same
C)Reject the null hypothesis,conclude that not all proportions are equal to 0.25
D)Reject the null hypothesis,conclude that not all proportions are equal to 0.20
Question
Exhibit 12.2 A university has six colleges and takes a poll to gauge student support for a tuition increase.The university wants to insure each college is represented fairly.The below table shows the observed number students that participate in the poll from each college and the actual proportion of students in each college. 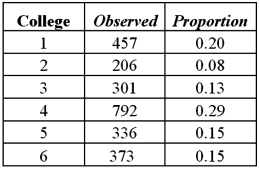 Refer to Exhibit 12.2.Using the p-value approach and α = 0.01,the decision and conclusion are:
A)Do not reject the null hypothesis;all proportions are equal to
B)Do not reject the null hypothesis;cannot conclude that not all of the proportions are the same
C)Reject the null hypothesis;at least one of the proportions is different from its hypothesized value
D)Reject the null hypothesis;all of the proportions are not the same
Refer to Exhibit 12.2.Using the p-value approach and α = 0.01,the decision and conclusion are:A)Do not reject the null hypothesis;all proportions are equal to
B)Do not reject the null hypothesis;cannot conclude that not all of the proportions are the same
C)Reject the null hypothesis;at least one of the proportions is different from its hypothesized value
D)Reject the null hypothesis;all of the proportions are not the same
Question
Exhibit 12.3 A fund manager wants to know if it equally likely that the Dow Jones Industrial average will go up each day of the week.For each day of the week,the fund manager observes the following number of days when the Dow Jones Industrial average goes up. 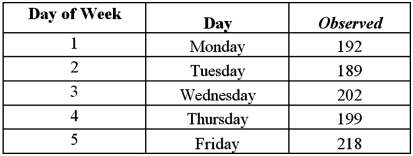 Refer to Exhibit 12.3.Using the critical value approach,the decision and conclusion are:
A)Reject the null hypothesis,not all of the proportions are the same
B)Reject the null hypothesis,all of the proportions are not the same
C)Do not reject the null hypothesis,all of the proportions are the same
D)Do not reject the null hypothesis,cannot conclude not all of the proportions are the same
Refer to Exhibit 12.3.Using the critical value approach,the decision and conclusion are:A)Reject the null hypothesis,not all of the proportions are the same
B)Reject the null hypothesis,all of the proportions are not the same
C)Do not reject the null hypothesis,all of the proportions are the same
D)Do not reject the null hypothesis,cannot conclude not all of the proportions are the same
Question
Exhibit 12.4 In the following table,likely voters' preferences of two candidates are cross-classified by gender.  Refer to Exhibit 12.4.At the 10% significance level,the critical value is:
A)6.635
B)5.024
C)3.841
D)2.706
Refer to Exhibit 12.4.At the 10% significance level,the critical value is:A)6.635
B)5.024
C)3.841
D)2.706
Question
Exhibit 12.3 A fund manager wants to know if it equally likely that the Dow Jones Industrial average will go up each day of the week.For each day of the week,the fund manager observes the following number of days when the Dow Jones Industrial average goes up.  Refer to Exhibit 12.3.For the goodness-of -fit test,the null and alternative hypotheses are:
A)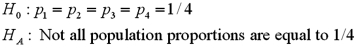
B)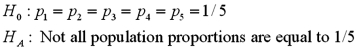
C)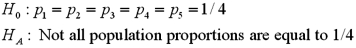
D)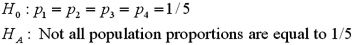
Refer to Exhibit 12.3.For the goodness-of -fit test,the null and alternative hypotheses are:A)
B)
C)
D)
Question
Exhibit 12.4 In the following table,likely voters' preferences of two candidates are cross-classified by gender.  Refer to Exhibit 12.4.Using the p-value approach and α = 0.10,the decision and conclusion are:
A)Reject the null hypothesis,gender and candidate preference are dependent
B)Do not reject the null hypothesis,gender and candidate preference are independent
C)Reject the null hypothesis,gender and candidate preference are independent
D)Do not reject null hypothesis,gender and candidate preference are dependent
Refer to Exhibit 12.4.Using the p-value approach and α = 0.10,the decision and conclusion are:A)Reject the null hypothesis,gender and candidate preference are dependent
B)Do not reject the null hypothesis,gender and candidate preference are independent
C)Reject the null hypothesis,gender and candidate preference are independent
D)Do not reject null hypothesis,gender and candidate preference are dependent
Question
Exhibit 12.4 In the following table,likely voters' preferences of two candidates are cross-classified by gender. 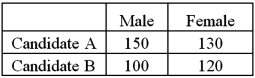 Refer to Exhibit 12.4.For the chi-square test of independence,the assumed degrees of freedom are:
A)1
B)2
C)3
D)4
Refer to Exhibit 12.4.For the chi-square test of independence,the assumed degrees of freedom are:A)1
B)2
C)3
D)4
Question
Exhibit 12.5 In the following table,individuals are cross-classified by their age group and income level.  Refer to Exhibit 12.5.Which of the following is the expected joint probability for the 'low income and 21-35 age group' cell assuming age group and income are independent?
A)0.0830
B)0.0874
C)0.0996
D)0.1328
Refer to Exhibit 12.5.Which of the following is the expected joint probability for the 'low income and 21-35 age group' cell assuming age group and income are independent?A)0.0830
B)0.0874
C)0.0996
D)0.1328
Question
Exhibit 12.4 In the following table,likely voters' preferences of two candidates are cross-classified by gender.  Refer to Exhibit 12.4.Using the critical value approach,the decision and conclusion are:
A)Reject the null hypothesis,gender and candidate preference are dependent
B)Do not reject the null hypothesis,gender and candidate preference are independent
C)Reject the null hypothesis,gender and candidate preference are independent
D)Do not reject the null hypothesis,gender and candidate preference are dependent
Refer to Exhibit 12.4.Using the critical value approach,the decision and conclusion are:A)Reject the null hypothesis,gender and candidate preference are dependent
B)Do not reject the null hypothesis,gender and candidate preference are independent
C)Reject the null hypothesis,gender and candidate preference are independent
D)Do not reject the null hypothesis,gender and candidate preference are dependent
Question
Exhibit 12.4 In the following table,likely voters' preferences of two candidates are cross-classified by gender.  Refer to Exhibit 12.4.To test that gender and candidate preference are independent,the null and alternative hypothesis are:
A)
B)
C)
D)
Refer to Exhibit 12.4.To test that gender and candidate preference are independent,the null and alternative hypothesis are:A)
B)
C)
D)
Question
Exhibit 12.2 A university has six colleges and takes a poll to gauge student support for a tuition increase.The university wants to insure each college is represented fairly.The below table shows the observed number students that participate in the poll from each college and the actual proportion of students in each college.  Refer to Exhibit 12.2.The p-value is:
A)Less than 0.01
B)Between 0.01 and 0.05
C)Between 0.05 and 0.10
D)Greater than 0.10
Refer to Exhibit 12.2.The p-value is:A)Less than 0.01
B)Between 0.01 and 0.05
C)Between 0.05 and 0.10
D)Greater than 0.10
Question
Exhibit 12.5 In the following table,individuals are cross-classified by their age group and income level.  Refer to Exhibit 12.5.Which of the following is the estimated joint probability for the 'low income and 21-35 age group' cell?
A)0.0830
B)0.0874
C)0.0996
D)0.1328
Refer to Exhibit 12.5.Which of the following is the estimated joint probability for the 'low income and 21-35 age group' cell?A)0.0830
B)0.0874
C)0.0996
D)0.1328
Question
Exhibit 12.3 A fund manager wants to know if it equally likely that the Dow Jones Industrial average will go up each day of the week.For each day of the week,the fund manager observes the following number of days when the Dow Jones Industrial average goes up.  Refer to Exhibit 12.3.What is the value of goodness-of-fit chi-square test statistic?
A)0.605
B)0.632
C)1.62
D)2.57
Refer to Exhibit 12.3.What is the value of goodness-of-fit chi-square test statistic?A)0.605
B)0.632
C)1.62
D)2.57
Question
Exhibit 12.3 A fund manager wants to know if it equally likely that the Dow Jones Industrial average will go up each day of the week.For each day of the week,the fund manager observes the following number of days when the Dow Jones Industrial average goes up.  Refer to Exhibit 12.3.Using the p-value approach and α = 0.05,the decision and conclusion are:
A)Do not reject the null hypothesis,all of the proportions are the same
B)Do not reject the null hypothesis,cannot conclude that not all of the proportions are the same
C)Reject the null hypothesis,not all of the proportions are the same
D)Reject the null hypothesis,all of the proportions are not the same
Refer to Exhibit 12.3.Using the p-value approach and α = 0.05,the decision and conclusion are:A)Do not reject the null hypothesis,all of the proportions are the same
B)Do not reject the null hypothesis,cannot conclude that not all of the proportions are the same
C)Reject the null hypothesis,not all of the proportions are the same
D)Reject the null hypothesis,all of the proportions are not the same
Question
Exhibit 12.3 A fund manager wants to know if it equally likely that the Dow Jones Industrial average will go up each day of the week.For each day of the week,the fund manager observes the following number of days when the Dow Jones Industrial average goes up.  Refer to Exhibit 12.3.For the goodness-of-fit test,what are the degrees of freedom for the chi-squared test statistic?
A)4
B)5
C)6
D)7
Refer to Exhibit 12.3.For the goodness-of-fit test,what are the degrees of freedom for the chi-squared test statistic?A)4
B)5
C)6
D)7
Question
Exhibit 12.3 A fund manager wants to know if it equally likely that the Dow Jones Industrial average will go up each day of the week.For each day of the week,the fund manager observes the following number of days when the Dow Jones Industrial average goes up.  Refer to Exhibit 12.3.The p-value is:
A)Less than 0.01
B)Between 0.01 and 0.05
C)Between 0.05 and 0.10
D)Greater than 0.10
Refer to Exhibit 12.3.The p-value is:A)Less than 0.01
B)Between 0.01 and 0.05
C)Between 0.05 and 0.10
D)Greater than 0.10
Question
Exhibit 12.2 A university has six colleges and takes a poll to gauge student support for a tuition increase.The university wants to insure each college is represented fairly.The below table shows the observed number students that participate in the poll from each college and the actual proportion of students in each college.  Refer to Exhibit 12.2.At the 1% significance level,the critical value is:
A)9.236
B)11.070
C)12.833
D)15.086
Refer to Exhibit 12.2.At the 1% significance level,the critical value is:A)9.236
B)11.070
C)12.833
D)15.086
Question
Exhibit 12.4 In the following table,likely voters' preferences of two candidates are cross-classified by gender.  Refer to Exhibit 12.4.For the chi-square test of independence,the value of the test statistic is:
A)2.34
B)1.62
C)3.25
D)4
Refer to Exhibit 12.4.For the chi-square test of independence,the value of the test statistic is:A)2.34
B)1.62
C)3.25
D)4
Question
Exhibit 12.3 A fund manager wants to know if it equally likely that the Dow Jones Industrial average will go up each day of the week.For each day of the week,the fund manager observes the following number of days when the Dow Jones Industrial average goes up.  Refer to Exhibit 12.3.At the 5% significance level,the critical value is:
A)7.779
B)9.488
C)11.143
D)13.277
Refer to Exhibit 12.3.At the 5% significance level,the critical value is:A)7.779
B)9.488
C)11.143
D)13.277
Question
Exhibit 12.2 A university has six colleges and takes a poll to gauge student support for a tuition increase.The university wants to insure each college is represented fairly.The below table shows the observed number students that participate in the poll from each college and the actual proportion of students in each college.  Refer to Exhibit 12.2.Using the critical value approach,the decision and conclusion are:
A)Reject the null hypothesis,at least one of the proportions is different from its hypothesized value
B)Reject the null hypothesis,all of the proportions are not the same
C)Do not reject the null hypothesis,all proportions are equal to 0.20
D)Do not reject the null hypothesis,cannot conclude not all of the proportions are the same
Refer to Exhibit 12.2.Using the critical value approach,the decision and conclusion are:A)Reject the null hypothesis,at least one of the proportions is different from its hypothesized value
B)Reject the null hypothesis,all of the proportions are not the same
C)Do not reject the null hypothesis,all proportions are equal to 0.20
D)Do not reject the null hypothesis,cannot conclude not all of the proportions are the same
Question
Exhibit 12.4 In the following table,likely voters' preferences of two candidates are cross-classified by gender.  Refer to Exhibit 12.4.The p-value is:
A)Less than 0.01
B)Between 0.01 and 0.05
C)Between 0.05 and 0.10
D)Greater than 0.10
Refer to Exhibit 12.4.The p-value is:A)Less than 0.01
B)Between 0.01 and 0.05
C)Between 0.05 and 0.10
D)Greater than 0.10
Question
Exhibit 12.5 In the following table,individuals are cross-classified by their age group and income level.  Refer to Exhibit 12.5.Using the critical value approach,the decision and conclusion are:
A)Do not reject the null hypothesis,age and income are dependent
B)Do not reject the null hypothesis,age and income are independent
C)Reject the null hypothesis,age and income are dependent
D)Reject the null hypothesis,age and income are independent
Refer to Exhibit 12.5.Using the critical value approach,the decision and conclusion are:A)Do not reject the null hypothesis,age and income are dependent
B)Do not reject the null hypothesis,age and income are independent
C)Reject the null hypothesis,age and income are dependent
D)Reject the null hypothesis,age and income are independent
Question
Exhibit 12.6 The following table shows the distribution of employees in an Organization.Martha Foreman,an analyst wants to see if race has a bearing on the position a person holds with this company.  Refer to Exhibit 12.6.For the chi-square test of independence,the value of the test statistic is:
A)12.221
B)15.378
C)17.853
D)20.154
Refer to Exhibit 12.6.For the chi-square test of independence,the value of the test statistic is:A)12.221
B)15.378
C)17.853
D)20.154
Question
Exhibit 12.5 In the following table,individuals are cross-classified by their age group and income level.  Refer to Exhibit 12.5.To test that age group and income are independent,the null and alternative hypothesis are:
A)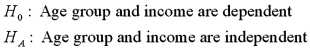
B)
C)
D)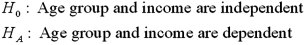
Refer to Exhibit 12.5.To test that age group and income are independent,the null and alternative hypothesis are:A)
B)
C)
D)
Question
Exhibit 12.5 In the following table,individuals are cross-classified by their age group and income level.  Refer to Exhibit 12.5.For the chi-square test of independence,the value of the test statistic is:
A)8.779
B)10.840
C)13.243
D)16.159
Refer to Exhibit 12.5.For the chi-square test of independence,the value of the test statistic is:A)8.779
B)10.840
C)13.243
D)16.159
Question
Exhibit 12.6 The following table shows the distribution of employees in an Organization.Martha Foreman,an analyst wants to see if race has a bearing on the position a person holds with this company. 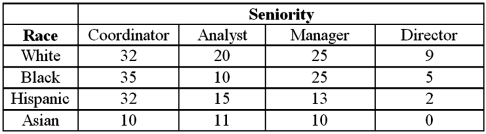 Refer to Exhibit 12.6.The row total for Asians is:
A)86
B)75
C)62
D)31
Refer to Exhibit 12.6.The row total for Asians is:A)86
B)75
C)62
D)31
Question
Exhibit 12.6 The following table shows the distribution of employees in an Organization.Martha Foreman,an analyst wants to see if race has a bearing on the position a person holds with this company.  Refer to Exhibit 12.6.Assuming that race and seniority are independent,what is the expected frequency of Asian directors?
A)0
B)1.95
C)3.91
D)5.42
Refer to Exhibit 12.6.Assuming that race and seniority are independent,what is the expected frequency of Asian directors?A)0
B)1.95
C)3.91
D)5.42
Question
Exhibit 12.6 The following table shows the distribution of employees in an Organization.Martha Foreman,an analyst wants to see if race has a bearing on the position a person holds with this company.  Refer to Exhibit 12.6.The column total for directors is:
A)16
B)56
C)73
D)109
Refer to Exhibit 12.6.The column total for directors is:A)16
B)56
C)73
D)109
Question
Exhibit 12.5 In the following table,individuals are cross-classified by their age group and income level.  Refer to Exhibit 12.5.The p-value is:
A)Less than 0.01
B)Between 0.01 and 0.05
C)Between 0.05 and 0.10
D)Greater than 0.10
Refer to Exhibit 12.5.The p-value is:A)Less than 0.01
B)Between 0.01 and 0.05
C)Between 0.05 and 0.10
D)Greater than 0.10
Question
Exhibit 12.5 In the following table,individuals are cross-classified by their age group and income level.  Refer to Exhibit 12.5.Using the p-value approach and α = 0.05,the decision and conclusion are:
A)Do not reject the null hypothesis,age and income are dependent
B)Do not reject the null hypothesis,age and income are independent
C)Reject the null hypothesis,age and income are dependent
D)Reject the null hypothesis,age and income are independent
Refer to Exhibit 12.5.Using the p-value approach and α = 0.05,the decision and conclusion are:A)Do not reject the null hypothesis,age and income are dependent
B)Do not reject the null hypothesis,age and income are independent
C)Reject the null hypothesis,age and income are dependent
D)Reject the null hypothesis,age and income are independent
Question
Exhibit 12.6 The following table shows the distribution of employees in an Organization.Martha Foreman,an analyst wants to see if race has a bearing on the position a person holds with this company.  Refer to Exhibit 12.6.At the 5% significance level,the critical value is:
A)14.684
B)16.919
C)19.023
D)21.666
Refer to Exhibit 12.6.At the 5% significance level,the critical value is:A)14.684
B)16.919
C)19.023
D)21.666
Question
Exhibit 12.5 In the following table,individuals are cross-classified by their age group and income level.  Refer to Exhibit 12.5.For the chi-square test of independence,the degrees of freedom are:
A)2
B)4
C)9
D)8
Refer to Exhibit 12.5.For the chi-square test of independence,the degrees of freedom are:A)2
B)4
C)9
D)8
Question
Exhibit 12.6 The following table shows the distribution of employees in an Organization.Martha Foreman,an analyst wants to see if race has a bearing on the position a person holds with this company.  Refer to Exhibit 12.6.Using the critical value approach,the decision and conclusion are:
A)Reject the hypothesis,conclude race and seniority are dependent
B)Reject the null hypothesis,conclude race and seniority are independent
C)Do not reject the null hypothesis,conclude race and seniority are dependent
D)Do not reject the null hypothesis,conclude race and seniority are independent
Refer to Exhibit 12.6.Using the critical value approach,the decision and conclusion are:A)Reject the hypothesis,conclude race and seniority are dependent
B)Reject the null hypothesis,conclude race and seniority are independent
C)Do not reject the null hypothesis,conclude race and seniority are dependent
D)Do not reject the null hypothesis,conclude race and seniority are independent
Question
Exhibit 12.5 In the following table,individuals are cross-classified by their age group and income level. 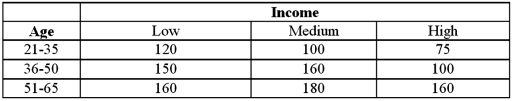 Refer to Exhibit 12.5.At the 5% significance level,the critical value is:
A)13.277
B)11.143
C)9.488
D)7.779
Refer to Exhibit 12.5.At the 5% significance level,the critical value is:A)13.277
B)11.143
C)9.488
D)7.779
Question
Exhibit 12.6 The following table shows the distribution of employees in an Organization.Martha Foreman,an analyst wants to see if race has a bearing on the position a person holds with this company.  Refer to Exhibit 12.6.The p-value is:
A)Less than 0.01
B)Between 0.01 and 0.05
C)Between 0.05 and 0.10
D)Greater than 0.10
Refer to Exhibit 12.6.The p-value is:A)Less than 0.01
B)Between 0.01 and 0.05
C)Between 0.05 and 0.10
D)Greater than 0.10
Question
Exhibit 12.6 The following table shows the distribution of employees in an Organization.Martha Foreman,an analyst wants to see if race has a bearing on the position a person holds with this company.  Refer to Exhibit 12.6.For the chi-square test for independence,the degrees of freedom used are:
A)2
B)16
C)9
D)0
Refer to Exhibit 12.6.For the chi-square test for independence,the degrees of freedom used are:A)2
B)16
C)9
D)0
Question
Exhibit 12.5 In the following table,individuals are cross-classified by their age group and income level.  Refer to Exhibit 12.5.Assuming age group and income are independent,the expected 'low income and 21-35 age group' cell frequency is:
A)105.27
B)107.72
C)146.31
D)178.42
Refer to Exhibit 12.5.Assuming age group and income are independent,the expected 'low income and 21-35 age group' cell frequency is:A)105.27
B)107.72
C)146.31
D)178.42
Question
Exhibit 12.6 The following table shows the distribution of employees in an Organization.Martha Foreman,an analyst wants to see if race has a bearing on the position a person holds with this company.  Refer to Exhibit 12.6.To test that race and seniority are independent,the null and alternative hypothesis are:
A)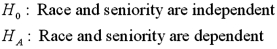
B)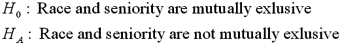
C)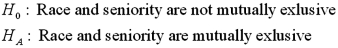
D)
Refer to Exhibit 12.6.To test that race and seniority are independent,the null and alternative hypothesis are:A)
B)
C)
D)
Question
Exhibit 12.7 The heights (in cm)for a random sample of 60 males were measured.The sample mean is 166.55,the standard deviation is 12.57,the sample kurtosis is 0.12,and the sample skewness is -0.23.The following table shows the heights subdivided into non-overlapping intervals. 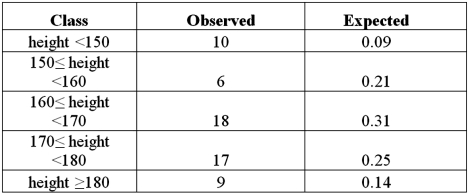 Refer to Exhibit 12.7.The heights are subdivided into five intervals.The degrees of freedom for the goodness-of-fit test for normality is:
A)2
B)3
C)4
D)5
Refer to Exhibit 12.7.The heights are subdivided into five intervals.The degrees of freedom for the goodness-of-fit test for normality is:A)2
B)3
C)4
D)5
Question
Exhibit 12.6 The following table shows the distribution of employees in an Organization.Martha Foreman,an analyst wants to see if race has a bearing on the position a person holds with this company.  Refer to Exhibit 12.5.Using the p-value approach and α = 0.05,the decision and conclusion are:
A)Reject the null hypothesis,conclude race and seniority are dependent
B)Reject the null hypothesis,conclude race and seniority are independent
C)Do not reject the null hypothesis,cannot conclude race and seniority are dependent
D)Do not reject the null hypothesis,conclude race and seniority are independent
Refer to Exhibit 12.5.Using the p-value approach and α = 0.05,the decision and conclusion are:A)Reject the null hypothesis,conclude race and seniority are dependent
B)Reject the null hypothesis,conclude race and seniority are independent
C)Do not reject the null hypothesis,cannot conclude race and seniority are dependent
D)Do not reject the null hypothesis,conclude race and seniority are independent
Question
Exhibit 12.7 The heights (in cm)for a random sample of 60 males were measured.The sample mean is 166.55,the standard deviation is 12.57,the sample kurtosis is 0.12,and the sample skewness is -0.23.The following table shows the heights subdivided into non-overlapping intervals.  Refer to Exhibit 12.7.For the chi-square test for normality,the null and alternative hypothesis are:
A)
B)
C)
D)
Refer to Exhibit 12.7.For the chi-square test for normality,the null and alternative hypothesis are:A)
B)
C)
D)

Unlock Deck
Sign up to unlock the cards in this deck!
Unlock Deck
Unlock Deck
1/100
Play
Full screen (f)
Deck 12: Chi-Square Tests
1
A goodness-of-fit test analyzes for two qualitative variables whereas a chi-square test of a contingency table is for a single qualitative variable.
False
2
For the goodness-of-fit test,the expected category frequencies found are the:
A)sample proportions
B)hypothesized proportions
C)average of the hypothesized and sample proportions
D)proportions specified under the alternative hypothesis
A)sample proportions
B)hypothesized proportions
C)average of the hypothesized and sample proportions
D)proportions specified under the alternative hypothesis
hypothesized proportions
3
Which of the following null hypotheses is used to test if five population proportions are the same?
A)
B)
C)
D)
A)
B)
C)
D)
4
For a chi-square test of a contingency table,the expected frequencies for each cell are calculated assuming the null hypothesis is true.
Unlock Deck
Unlock for access to all 100 flashcards in this deck.
Unlock Deck
k this deck
5
The chi-square test statistic measures the difference between the observed frequencies and the expected frequencies assuming the null hypothesis is true.
Unlock Deck
Unlock for access to all 100 flashcards in this deck.
Unlock Deck
k this deck
6
For the goodness-of-fit test,the chi-square test statistic will:
A)always equal zero
B)always be negative
C)be at least zero
D)always be equal to n
A)always equal zero
B)always be negative
C)be at least zero
D)always be equal to n
Unlock Deck
Unlock for access to all 100 flashcards in this deck.
Unlock Deck
k this deck
7
For a chi-square test of a contingency table,the degrees of freedom are calculated as (r - 1)(c - 1)where r and c are the number of rows and columns in the contingency table.
Unlock Deck
Unlock for access to all 100 flashcards in this deck.
Unlock Deck
k this deck
8
The chi-square test of a contingency table is a test of independence for:
A)A single qualitative variable
B)Two qualitative variables
C)Two quantitative variables
D)Three or more quantitative variables
A)A single qualitative variable
B)Two qualitative variables
C)Two quantitative variables
D)Three or more quantitative variables
Unlock Deck
Unlock for access to all 100 flashcards in this deck.
Unlock Deck
k this deck
9
For a chi-square goodness-of-fit test,the expected category frequencies are calculated using the sample category proportions.
Unlock Deck
Unlock for access to all 100 flashcards in this deck.
Unlock Deck
k this deck
10
For a multinomial experiment,which of the following is not true?
A)The number of categories is at least two,
B)The trials are dependent
C)The sum of the category probabilities is 1,
D)The category probabilities are the same for each trial
A)The number of categories is at least two,
B)The trials are dependent
C)The sum of the category probabilities is 1,
D)The category probabilities are the same for each trial
Unlock Deck
Unlock for access to all 100 flashcards in this deck.
Unlock Deck
k this deck
11
For the goodness-of-fit test,the sum of the expected frequencies must equal:
A)
B)n
C)k
D)k - 1
A)
B)n
C)k
D)k - 1
Unlock Deck
Unlock for access to all 100 flashcards in this deck.
Unlock Deck
k this deck
12
If the null hypothesis is rejected by the goodness-of-fit test,the alternative hypothesis specifies which of the population proportions differ from their hypothesized values.
Unlock Deck
Unlock for access to all 100 flashcards in this deck.
Unlock Deck
k this deck
13
The chi-square test of a contingency table is valid when the expected cell frequencies are:
A)Equal to 0
B)More than 0 but less than 5
C)At least 5
D)Negative
A)Equal to 0
B)More than 0 but less than 5
C)At least 5
D)Negative
Unlock Deck
Unlock for access to all 100 flashcards in this deck.
Unlock Deck
k this deck
14
When applying the goodness-of-fit test for normality,the quantitative data must be converted into a qualitative format.
Unlock Deck
Unlock for access to all 100 flashcards in this deck.
Unlock Deck
k this deck
15
For a multinomial experiment with k categories,the goodness-of-fit test statistic is assumed to follow a chi-square distribution with k degrees of freedom.
Unlock Deck
Unlock for access to all 100 flashcards in this deck.
Unlock Deck
k this deck
16
For a chi-square test of a contingency table,each observation may be counted in multiple cells of the contingency table.
Unlock Deck
Unlock for access to all 100 flashcards in this deck.
Unlock Deck
k this deck
17
For the Jarque-Bera test for normality,the test statistic is assumed to have a chi-square distribution with 2 degrees of freedom.
Unlock Deck
Unlock for access to all 100 flashcards in this deck.
Unlock Deck
k this deck
18
For the chi-square test of a contingency table,the expected cell frequencies are found as which is the same as:
A)The observed cell frequencies
B)The cell probability multiplied by the sample size
C)The row total
D)The column total
which is the same as:A)The observed cell frequencies
B)The cell probability multiplied by the sample size
C)The row total
D)The column total
Unlock Deck
Unlock for access to all 100 flashcards in this deck.
Unlock Deck
k this deck
19
What are the degrees of freedom for the goodness-of-fit test for normality?
A)2
B)k - 3
C)k - 2
D)k - 1
A)2
B)k - 3
C)k - 2
D)k - 1
Unlock Deck
Unlock for access to all 100 flashcards in this deck.
Unlock Deck
k this deck
20
For the chi-square test of a contingency table,the expected cell frequencies are found as:
A)The row total multiplied by the column total divided by the sample size
B)The observed cell frequency
C)(r - 1)(c - 1)
D)(r)(c)
A)The row total multiplied by the column total divided by the sample size
B)The observed cell frequency
C)(r - 1)(c - 1)
D)(r)(c)
Unlock Deck
Unlock for access to all 100 flashcards in this deck.
Unlock Deck
k this deck
21
If a test statistic has a value of X and is assumed to be χ2 distributed with df degrees of freedom,then the p-value for a right-tailed test found by Excel is:
A)CHISQ.DIST.RT(X,df)
B)CHISQ.DIST.RT(df,X)
C)1-CHISQ.DIST.RT(X,df)
D)1-CHISQ.DIST.RT(df,X)
A)CHISQ.DIST.RT(X,df)
B)CHISQ.DIST.RT(df,X)
C)1-CHISQ.DIST.RT(X,df)
D)1-CHISQ.DIST.RT(df,X)
Unlock Deck
Unlock for access to all 100 flashcards in this deck.
Unlock Deck
k this deck
22
Suppose you want to determine if mutual funds quarterly returns have a normal distribution using quantitative summary statistics.The most appropriate test is the:
A)Goodness-of-fit test for a multinomial experiment
B)Chi-square test for independence
C)Goodness-of-fit test for normality
D)Jarque-Bera test for normality
A)Goodness-of-fit test for a multinomial experiment
B)Chi-square test for independence
C)Goodness-of-fit test for normality
D)Jarque-Bera test for normality
Unlock Deck
Unlock for access to all 100 flashcards in this deck.
Unlock Deck
k this deck
23
Suppose you want to determine if gender and major are independent.Which test should you use?
A)Goodness-of-fit test for a multinomial experiment
B)Chi-square test for independence
C)Goodness-of-fit test for normality
D)Jarque-Bera test for normality
A)Goodness-of-fit test for a multinomial experiment
B)Chi-square test for independence
C)Goodness-of-fit test for normality
D)Jarque-Bera test for normality
Unlock Deck
Unlock for access to all 100 flashcards in this deck.
Unlock Deck
k this deck
24
Exhibit 12-1 A card dealing machine deals spades (1),hearts (2),clubs (3),and diamonds (4)at random as if from an infinite deck.In a randomness check,1,600 cards were dealt and counted.The results are shown below. Refer to Exhibit 12.1.For the goodness-of-fit test,the value of the test statistic is:
A)2.25
B)3.125
C)6.45
D)7.815
Refer to Exhibit 12.1.For the goodness-of-fit test,the value of the test statistic is:A)2.25
B)3.125
C)6.45
D)7.815
Unlock Deck
Unlock for access to all 100 flashcards in this deck.
Unlock Deck
k this deck
25
Exhibit 12-1 A card dealing machine deals spades (1),hearts (2),clubs (3),and diamonds (4)at random as if from an infinite deck.In a randomness check,1,600 cards were dealt and counted.The results are shown below. Refer to Exhibit 12.1.Using the p-value approach and α = 0.05,the decision and conclusion are:
A)Do not reject the null hypothesis,all of the population proportions are the same
B)Reject the null hypothesis,conclude that not all proportions are equal to 0.20
C)Reject the null hypothesis,conclude that not all proportions are equal to 0.25
D)Do not reject the null hypothesis,cannot conclude that not all of the proportions are equal to 0.25
Refer to Exhibit 12.1.Using the p-value approach and α = 0.05,the decision and conclusion are:A)Do not reject the null hypothesis,all of the population proportions are the same
B)Reject the null hypothesis,conclude that not all proportions are equal to 0.20
C)Reject the null hypothesis,conclude that not all proportions are equal to 0.25
D)Do not reject the null hypothesis,cannot conclude that not all of the proportions are equal to 0.25
Unlock Deck
Unlock for access to all 100 flashcards in this deck.
Unlock Deck
k this deck
26
Exhibit 12.2 A university has six colleges and takes a poll to gauge student support for a tuition increase.The university wants to insure each college is represented fairly.The below table shows the observed number students that participate in the poll from each college and the actual proportion of students in each college. Refer to Exhibit 12.2.For the goodness-of-fit test,the alternative hypothesis states that
A)
B)
C)
D)
Refer to Exhibit 12.2.For the goodness-of-fit test,the alternative hypothesis states thatA)
B)
C)
D)
Unlock Deck
Unlock for access to all 100 flashcards in this deck.
Unlock Deck
k this deck
27
Exhibit 12-1 A card dealing machine deals spades (1),hearts (2),clubs (3),and diamonds (4)at random as if from an infinite deck.In a randomness check,1,600 cards were dealt and counted.The results are shown below. Refer to Exhibit 12.1.The p-value is:
A)Less than 0.01
B)Between 0.01 and 0.05
C)Between 0.05 and 0.10
D)Greater than 0.10
Refer to Exhibit 12.1.The p-value is:A)Less than 0.01
B)Between 0.01 and 0.05
C)Between 0.05 and 0.10
D)Greater than 0.10
Unlock Deck
Unlock for access to all 100 flashcards in this deck.
Unlock Deck
k this deck
28
Exhibit 12-1 A card dealing machine deals spades (1),hearts (2),clubs (3),and diamonds (4)at random as if from an infinite deck.In a randomness check,1,600 cards were dealt and counted.The results are shown below. Refer to Exhibit 12.1.For the goodness-of-fit test,the degrees of freedom are:
A)2
B)3
C)4
D)5
Refer to Exhibit 12.1.For the goodness-of-fit test,the degrees of freedom are:A)2
B)3
C)4
D)5
Unlock Deck
Unlock for access to all 100 flashcards in this deck.
Unlock Deck
k this deck
29
For the goodness-of-fit test for normality to be applied,what is the minimum number of qualitative intervals the quantitative data can be converted to?
A)2
B)4
C)5
D)10
A)2
B)4
C)5
D)10
Unlock Deck
Unlock for access to all 100 flashcards in this deck.
Unlock Deck
k this deck
30
Exhibit 12.2 A university has six colleges and takes a poll to gauge student support for a tuition increase.The university wants to insure each college is represented fairly.The below table shows the observed number students that participate in the poll from each college and the actual proportion of students in each college. Refer to Exhibit 12.2.For the goodness-of-fit test,the assumed degrees of freedom are:
A)2
B)3
C)4
D)5
Refer to Exhibit 12.2.For the goodness-of-fit test,the assumed degrees of freedom are:A)2
B)3
C)4
D)5
Unlock Deck
Unlock for access to all 100 flashcards in this deck.
Unlock Deck
k this deck
31
Exhibit 12-1 A card dealing machine deals spades (1),hearts (2),clubs (3),and diamonds (4)at random as if from an infinite deck.In a randomness check,1,600 cards were dealt and counted.The results are shown below. Refer to Exhibit 12.1.To test if the poker dealing machine deals cards at random,the null and alternative hypotheses are:
A)
B)
C)
D)
Refer to Exhibit 12.1.To test if the poker dealing machine deals cards at random,the null and alternative hypotheses are:A)
B)
C)
D)
Unlock Deck
Unlock for access to all 100 flashcards in this deck.
Unlock Deck
k this deck
32
Suppose you want to determine if mutual funds quarterly returns have a normal distribution when your available data is partitioned into some non-overlapping intervals with given frequencies.The most appropriate test is the:
A)Goodness-of-fit test for a multinomial experiment
B)Chi-square test for independence
C)Goodness-of-fit test for normality
D)Jarque-Bera test for normality
A)Goodness-of-fit test for a multinomial experiment
B)Chi-square test for independence
C)Goodness-of-fit test for normality
D)Jarque-Bera test for normality
Unlock Deck
Unlock for access to all 100 flashcards in this deck.
Unlock Deck
k this deck
33
For the goodness-of-fit test for normality,the null and alternative hypotheses are:
A)
B)
C)
D)
A)
B)
C)
D)
Unlock Deck
Unlock for access to all 100 flashcards in this deck.
Unlock Deck
k this deck
34
Exhibit 12-1 A card dealing machine deals spades (1),hearts (2),clubs (3),and diamonds (4)at random as if from an infinite deck.In a randomness check,1,600 cards were dealt and counted.The results are shown below. Refer to Exhibit 12.1.At the 5% significance level,the critical value is:
A)6.251
B)7.815
C)9.348
D)11.345
Refer to Exhibit 12.1.At the 5% significance level,the critical value is:A)6.251
B)7.815
C)9.348
D)11.345
Unlock Deck
Unlock for access to all 100 flashcards in this deck.
Unlock Deck
k this deck
35
The calculation of the Jarque-Bera test statistic involves:
A)Only the sample size
B)The sample size,standard deviation,and average
C)The sample size,skewness coefficient,and the kurtosis coefficient
D)The sample average,skewness coefficient,and the kurtosis coefficient
A)Only the sample size
B)The sample size,standard deviation,and average
C)The sample size,skewness coefficient,and the kurtosis coefficient
D)The sample average,skewness coefficient,and the kurtosis coefficient
Unlock Deck
Unlock for access to all 100 flashcards in this deck.
Unlock Deck
k this deck
36
Exhibit 12.2 A university has six colleges and takes a poll to gauge student support for a tuition increase.The university wants to insure each college is represented fairly.The below table shows the observed number students that participate in the poll from each college and the actual proportion of students in each college. Refer to Exhibit 12.2.What is the value of the goodness-of-fit test statistic?
A)3.08
B)15.09
C)15.64
D)16.75
Refer to Exhibit 12.2.What is the value of the goodness-of-fit test statistic?A)3.08
B)15.09
C)15.64
D)16.75
Unlock Deck
Unlock for access to all 100 flashcards in this deck.
Unlock Deck
k this deck
37
For the Jarque-Bera test for normality,the null and alternative hypotheses are:
A)
B)
C)
D)
A)
B)
C)
D)
Unlock Deck
Unlock for access to all 100 flashcards in this deck.
Unlock Deck
k this deck
38
Packaged candies have three different types of colors,suppose you want to determine if the population proportion of each color is the same.The most appropriate test is the:
A)Goodness-of-fit test for a multinomial experiment
B)Chi-square test for independence
C)Goodness-of-fit test for normality
D)Jarque-Bera test for normality
A)Goodness-of-fit test for a multinomial experiment
B)Chi-square test for independence
C)Goodness-of-fit test for normality
D)Jarque-Bera test for normality
Unlock Deck
Unlock for access to all 100 flashcards in this deck.
Unlock Deck
k this deck
39
For the chi-square test for normality,the expected frequencies for each interval must be:
A)Exactly 2
B)k - 3
C)At least 5
D)k - 1
A)Exactly 2
B)k - 3
C)At least 5
D)k - 1
Unlock Deck
Unlock for access to all 100 flashcards in this deck.
Unlock Deck
k this deck
40
Exhibit 12-1 A card dealing machine deals spades (1),hearts (2),clubs (3),and diamonds (4)at random as if from an infinite deck.In a randomness check,1,600 cards were dealt and counted.The results are shown below. Refer to Exhibit 12.1.Using the critical value approach,the decision and conclusion are:
A)Do not reject the null hypothesis,cannot conclude that not all of the proportions are equal to 0.25
B)Do not reject the null hypothesis,all of the population proportions are the same
C)Reject the null hypothesis,conclude that not all proportions are equal to 0.25
D)Reject the null hypothesis,conclude that not all proportions are equal to 0.20
Refer to Exhibit 12.1.Using the critical value approach,the decision and conclusion are:A)Do not reject the null hypothesis,cannot conclude that not all of the proportions are equal to 0.25
B)Do not reject the null hypothesis,all of the population proportions are the same
C)Reject the null hypothesis,conclude that not all proportions are equal to 0.25
D)Reject the null hypothesis,conclude that not all proportions are equal to 0.20
Unlock Deck
Unlock for access to all 100 flashcards in this deck.
Unlock Deck
k this deck
41
Exhibit 12.2 A university has six colleges and takes a poll to gauge student support for a tuition increase.The university wants to insure each college is represented fairly.The below table shows the observed number students that participate in the poll from each college and the actual proportion of students in each college. Refer to Exhibit 12.2.Using the p-value approach and α = 0.01,the decision and conclusion are:
A)Do not reject the null hypothesis;all proportions are equal to
B)Do not reject the null hypothesis;cannot conclude that not all of the proportions are the same
C)Reject the null hypothesis;at least one of the proportions is different from its hypothesized value
D)Reject the null hypothesis;all of the proportions are not the same
Refer to Exhibit 12.2.Using the p-value approach and α = 0.01,the decision and conclusion are:A)Do not reject the null hypothesis;all proportions are equal to
B)Do not reject the null hypothesis;cannot conclude that not all of the proportions are the same
C)Reject the null hypothesis;at least one of the proportions is different from its hypothesized value
D)Reject the null hypothesis;all of the proportions are not the same
Unlock Deck
Unlock for access to all 100 flashcards in this deck.
Unlock Deck
k this deck
42
Exhibit 12.3 A fund manager wants to know if it equally likely that the Dow Jones Industrial average will go up each day of the week.For each day of the week,the fund manager observes the following number of days when the Dow Jones Industrial average goes up. Refer to Exhibit 12.3.Using the critical value approach,the decision and conclusion are:
A)Reject the null hypothesis,not all of the proportions are the same
B)Reject the null hypothesis,all of the proportions are not the same
C)Do not reject the null hypothesis,all of the proportions are the same
D)Do not reject the null hypothesis,cannot conclude not all of the proportions are the same
Refer to Exhibit 12.3.Using the critical value approach,the decision and conclusion are:A)Reject the null hypothesis,not all of the proportions are the same
B)Reject the null hypothesis,all of the proportions are not the same
C)Do not reject the null hypothesis,all of the proportions are the same
D)Do not reject the null hypothesis,cannot conclude not all of the proportions are the same
Unlock Deck
Unlock for access to all 100 flashcards in this deck.
Unlock Deck
k this deck
43
Exhibit 12.4 In the following table,likely voters' preferences of two candidates are cross-classified by gender. Refer to Exhibit 12.4.At the 10% significance level,the critical value is:
A)6.635
B)5.024
C)3.841
D)2.706
Refer to Exhibit 12.4.At the 10% significance level,the critical value is:A)6.635
B)5.024
C)3.841
D)2.706
Unlock Deck
Unlock for access to all 100 flashcards in this deck.
Unlock Deck
k this deck
44
Exhibit 12.3 A fund manager wants to know if it equally likely that the Dow Jones Industrial average will go up each day of the week.For each day of the week,the fund manager observes the following number of days when the Dow Jones Industrial average goes up. Refer to Exhibit 12.3.For the goodness-of -fit test,the null and alternative hypotheses are:
A)
B)
C)
D)
Refer to Exhibit 12.3.For the goodness-of -fit test,the null and alternative hypotheses are:A)
B)
C)
D)
Unlock Deck
Unlock for access to all 100 flashcards in this deck.
Unlock Deck
k this deck
45
Exhibit 12.4 In the following table,likely voters' preferences of two candidates are cross-classified by gender. Refer to Exhibit 12.4.Using the p-value approach and α = 0.10,the decision and conclusion are:
A)Reject the null hypothesis,gender and candidate preference are dependent
B)Do not reject the null hypothesis,gender and candidate preference are independent
C)Reject the null hypothesis,gender and candidate preference are independent
D)Do not reject null hypothesis,gender and candidate preference are dependent
Refer to Exhibit 12.4.Using the p-value approach and α = 0.10,the decision and conclusion are:A)Reject the null hypothesis,gender and candidate preference are dependent
B)Do not reject the null hypothesis,gender and candidate preference are independent
C)Reject the null hypothesis,gender and candidate preference are independent
D)Do not reject null hypothesis,gender and candidate preference are dependent
Unlock Deck
Unlock for access to all 100 flashcards in this deck.
Unlock Deck
k this deck
46
Exhibit 12.4 In the following table,likely voters' preferences of two candidates are cross-classified by gender. Refer to Exhibit 12.4.For the chi-square test of independence,the assumed degrees of freedom are:
A)1
B)2
C)3
D)4
Refer to Exhibit 12.4.For the chi-square test of independence,the assumed degrees of freedom are:A)1
B)2
C)3
D)4
Unlock Deck
Unlock for access to all 100 flashcards in this deck.
Unlock Deck
k this deck
47
Exhibit 12.5 In the following table,individuals are cross-classified by their age group and income level. Refer to Exhibit 12.5.Which of the following is the expected joint probability for the 'low income and 21-35 age group' cell assuming age group and income are independent?
A)0.0830
B)0.0874
C)0.0996
D)0.1328
Refer to Exhibit 12.5.Which of the following is the expected joint probability for the 'low income and 21-35 age group' cell assuming age group and income are independent?A)0.0830
B)0.0874
C)0.0996
D)0.1328
Unlock Deck
Unlock for access to all 100 flashcards in this deck.
Unlock Deck
k this deck
48
Exhibit 12.4 In the following table,likely voters' preferences of two candidates are cross-classified by gender. Refer to Exhibit 12.4.Using the critical value approach,the decision and conclusion are:
A)Reject the null hypothesis,gender and candidate preference are dependent
B)Do not reject the null hypothesis,gender and candidate preference are independent
C)Reject the null hypothesis,gender and candidate preference are independent
D)Do not reject the null hypothesis,gender and candidate preference are dependent
Refer to Exhibit 12.4.Using the critical value approach,the decision and conclusion are:A)Reject the null hypothesis,gender and candidate preference are dependent
B)Do not reject the null hypothesis,gender and candidate preference are independent
C)Reject the null hypothesis,gender and candidate preference are independent
D)Do not reject the null hypothesis,gender and candidate preference are dependent
Unlock Deck
Unlock for access to all 100 flashcards in this deck.
Unlock Deck
k this deck
49
Exhibit 12.4 In the following table,likely voters' preferences of two candidates are cross-classified by gender. Refer to Exhibit 12.4.To test that gender and candidate preference are independent,the null and alternative hypothesis are:
A)
B)
C)
D)
Refer to Exhibit 12.4.To test that gender and candidate preference are independent,the null and alternative hypothesis are:A)
B)
C)
D)
Unlock Deck
Unlock for access to all 100 flashcards in this deck.
Unlock Deck
k this deck
50
Exhibit 12.2 A university has six colleges and takes a poll to gauge student support for a tuition increase.The university wants to insure each college is represented fairly.The below table shows the observed number students that participate in the poll from each college and the actual proportion of students in each college. Refer to Exhibit 12.2.The p-value is:
A)Less than 0.01
B)Between 0.01 and 0.05
C)Between 0.05 and 0.10
D)Greater than 0.10
Refer to Exhibit 12.2.The p-value is:A)Less than 0.01
B)Between 0.01 and 0.05
C)Between 0.05 and 0.10
D)Greater than 0.10
Unlock Deck
Unlock for access to all 100 flashcards in this deck.
Unlock Deck
k this deck
51
Exhibit 12.5 In the following table,individuals are cross-classified by their age group and income level. Refer to Exhibit 12.5.Which of the following is the estimated joint probability for the 'low income and 21-35 age group' cell?
A)0.0830
B)0.0874
C)0.0996
D)0.1328
Refer to Exhibit 12.5.Which of the following is the estimated joint probability for the 'low income and 21-35 age group' cell?A)0.0830
B)0.0874
C)0.0996
D)0.1328
Unlock Deck
Unlock for access to all 100 flashcards in this deck.
Unlock Deck
k this deck
52
Exhibit 12.3 A fund manager wants to know if it equally likely that the Dow Jones Industrial average will go up each day of the week.For each day of the week,the fund manager observes the following number of days when the Dow Jones Industrial average goes up. Refer to Exhibit 12.3.What is the value of goodness-of-fit chi-square test statistic?
A)0.605
B)0.632
C)1.62
D)2.57
Refer to Exhibit 12.3.What is the value of goodness-of-fit chi-square test statistic?A)0.605
B)0.632
C)1.62
D)2.57
Unlock Deck
Unlock for access to all 100 flashcards in this deck.
Unlock Deck
k this deck
53
Exhibit 12.3 A fund manager wants to know if it equally likely that the Dow Jones Industrial average will go up each day of the week.For each day of the week,the fund manager observes the following number of days when the Dow Jones Industrial average goes up. Refer to Exhibit 12.3.Using the p-value approach and α = 0.05,the decision and conclusion are:
A)Do not reject the null hypothesis,all of the proportions are the same
B)Do not reject the null hypothesis,cannot conclude that not all of the proportions are the same
C)Reject the null hypothesis,not all of the proportions are the same
D)Reject the null hypothesis,all of the proportions are not the same
Refer to Exhibit 12.3.Using the p-value approach and α = 0.05,the decision and conclusion are:A)Do not reject the null hypothesis,all of the proportions are the same
B)Do not reject the null hypothesis,cannot conclude that not all of the proportions are the same
C)Reject the null hypothesis,not all of the proportions are the same
D)Reject the null hypothesis,all of the proportions are not the same
Unlock Deck
Unlock for access to all 100 flashcards in this deck.
Unlock Deck
k this deck
54
Exhibit 12.3 A fund manager wants to know if it equally likely that the Dow Jones Industrial average will go up each day of the week.For each day of the week,the fund manager observes the following number of days when the Dow Jones Industrial average goes up. Refer to Exhibit 12.3.For the goodness-of-fit test,what are the degrees of freedom for the chi-squared test statistic?
A)4
B)5
C)6
D)7
Refer to Exhibit 12.3.For the goodness-of-fit test,what are the degrees of freedom for the chi-squared test statistic?A)4
B)5
C)6
D)7
Unlock Deck
Unlock for access to all 100 flashcards in this deck.
Unlock Deck
k this deck
55
Exhibit 12.3 A fund manager wants to know if it equally likely that the Dow Jones Industrial average will go up each day of the week.For each day of the week,the fund manager observes the following number of days when the Dow Jones Industrial average goes up. Refer to Exhibit 12.3.The p-value is:
A)Less than 0.01
B)Between 0.01 and 0.05
C)Between 0.05 and 0.10
D)Greater than 0.10
Refer to Exhibit 12.3.The p-value is:A)Less than 0.01
B)Between 0.01 and 0.05
C)Between 0.05 and 0.10
D)Greater than 0.10
Unlock Deck
Unlock for access to all 100 flashcards in this deck.
Unlock Deck
k this deck
56
Exhibit 12.2 A university has six colleges and takes a poll to gauge student support for a tuition increase.The university wants to insure each college is represented fairly.The below table shows the observed number students that participate in the poll from each college and the actual proportion of students in each college. Refer to Exhibit 12.2.At the 1% significance level,the critical value is:
A)9.236
B)11.070
C)12.833
D)15.086
Refer to Exhibit 12.2.At the 1% significance level,the critical value is:A)9.236
B)11.070
C)12.833
D)15.086
Unlock Deck
Unlock for access to all 100 flashcards in this deck.
Unlock Deck
k this deck
57
Exhibit 12.4 In the following table,likely voters' preferences of two candidates are cross-classified by gender. Refer to Exhibit 12.4.For the chi-square test of independence,the value of the test statistic is:
A)2.34
B)1.62
C)3.25
D)4
Refer to Exhibit 12.4.For the chi-square test of independence,the value of the test statistic is:A)2.34
B)1.62
C)3.25
D)4
Unlock Deck
Unlock for access to all 100 flashcards in this deck.
Unlock Deck
k this deck
58
Exhibit 12.3 A fund manager wants to know if it equally likely that the Dow Jones Industrial average will go up each day of the week.For each day of the week,the fund manager observes the following number of days when the Dow Jones Industrial average goes up. Refer to Exhibit 12.3.At the 5% significance level,the critical value is:
A)7.779
B)9.488
C)11.143
D)13.277
Refer to Exhibit 12.3.At the 5% significance level,the critical value is:A)7.779
B)9.488
C)11.143
D)13.277
Unlock Deck
Unlock for access to all 100 flashcards in this deck.
Unlock Deck
k this deck
59
Exhibit 12.2 A university has six colleges and takes a poll to gauge student support for a tuition increase.The university wants to insure each college is represented fairly.The below table shows the observed number students that participate in the poll from each college and the actual proportion of students in each college. Refer to Exhibit 12.2.Using the critical value approach,the decision and conclusion are:
A)Reject the null hypothesis,at least one of the proportions is different from its hypothesized value
B)Reject the null hypothesis,all of the proportions are not the same
C)Do not reject the null hypothesis,all proportions are equal to 0.20
D)Do not reject the null hypothesis,cannot conclude not all of the proportions are the same
Refer to Exhibit 12.2.Using the critical value approach,the decision and conclusion are:A)Reject the null hypothesis,at least one of the proportions is different from its hypothesized value
B)Reject the null hypothesis,all of the proportions are not the same
C)Do not reject the null hypothesis,all proportions are equal to 0.20
D)Do not reject the null hypothesis,cannot conclude not all of the proportions are the same
Unlock Deck
Unlock for access to all 100 flashcards in this deck.
Unlock Deck
k this deck
60
Exhibit 12.4 In the following table,likely voters' preferences of two candidates are cross-classified by gender. Refer to Exhibit 12.4.The p-value is:
A)Less than 0.01
B)Between 0.01 and 0.05
C)Between 0.05 and 0.10
D)Greater than 0.10
Refer to Exhibit 12.4.The p-value is:A)Less than 0.01
B)Between 0.01 and 0.05
C)Between 0.05 and 0.10
D)Greater than 0.10
Unlock Deck
Unlock for access to all 100 flashcards in this deck.
Unlock Deck
k this deck
61
Exhibit 12.5 In the following table,individuals are cross-classified by their age group and income level. Refer to Exhibit 12.5.Using the critical value approach,the decision and conclusion are:
A)Do not reject the null hypothesis,age and income are dependent
B)Do not reject the null hypothesis,age and income are independent
C)Reject the null hypothesis,age and income are dependent
D)Reject the null hypothesis,age and income are independent
Refer to Exhibit 12.5.Using the critical value approach,the decision and conclusion are:A)Do not reject the null hypothesis,age and income are dependent
B)Do not reject the null hypothesis,age and income are independent
C)Reject the null hypothesis,age and income are dependent
D)Reject the null hypothesis,age and income are independent
Unlock Deck
Unlock for access to all 100 flashcards in this deck.
Unlock Deck
k this deck
62
Exhibit 12.6 The following table shows the distribution of employees in an Organization.Martha Foreman,an analyst wants to see if race has a bearing on the position a person holds with this company. Refer to Exhibit 12.6.For the chi-square test of independence,the value of the test statistic is:
A)12.221
B)15.378
C)17.853
D)20.154
Refer to Exhibit 12.6.For the chi-square test of independence,the value of the test statistic is:A)12.221
B)15.378
C)17.853
D)20.154
Unlock Deck
Unlock for access to all 100 flashcards in this deck.
Unlock Deck
k this deck
63
Exhibit 12.5 In the following table,individuals are cross-classified by their age group and income level. Refer to Exhibit 12.5.To test that age group and income are independent,the null and alternative hypothesis are:
A)
B)
C)
D)
Refer to Exhibit 12.5.To test that age group and income are independent,the null and alternative hypothesis are:A)
B)
C)
D)
Unlock Deck
Unlock for access to all 100 flashcards in this deck.
Unlock Deck
k this deck
64
Exhibit 12.5 In the following table,individuals are cross-classified by their age group and income level. Refer to Exhibit 12.5.For the chi-square test of independence,the value of the test statistic is:
A)8.779
B)10.840
C)13.243
D)16.159
Refer to Exhibit 12.5.For the chi-square test of independence,the value of the test statistic is:A)8.779
B)10.840
C)13.243
D)16.159
Unlock Deck
Unlock for access to all 100 flashcards in this deck.
Unlock Deck
k this deck
65
Exhibit 12.6 The following table shows the distribution of employees in an Organization.Martha Foreman,an analyst wants to see if race has a bearing on the position a person holds with this company. Refer to Exhibit 12.6.The row total for Asians is:
A)86
B)75
C)62
D)31
Refer to Exhibit 12.6.The row total for Asians is:A)86
B)75
C)62
D)31
Unlock Deck
Unlock for access to all 100 flashcards in this deck.
Unlock Deck
k this deck
66
Exhibit 12.6 The following table shows the distribution of employees in an Organization.Martha Foreman,an analyst wants to see if race has a bearing on the position a person holds with this company. Refer to Exhibit 12.6.Assuming that race and seniority are independent,what is the expected frequency of Asian directors?
A)0
B)1.95
C)3.91
D)5.42
Refer to Exhibit 12.6.Assuming that race and seniority are independent,what is the expected frequency of Asian directors?A)0
B)1.95
C)3.91
D)5.42
Unlock Deck
Unlock for access to all 100 flashcards in this deck.
Unlock Deck
k this deck
67
Exhibit 12.6 The following table shows the distribution of employees in an Organization.Martha Foreman,an analyst wants to see if race has a bearing on the position a person holds with this company. Refer to Exhibit 12.6.The column total for directors is:
A)16
B)56
C)73
D)109
Refer to Exhibit 12.6.The column total for directors is:A)16
B)56
C)73
D)109
Unlock Deck
Unlock for access to all 100 flashcards in this deck.
Unlock Deck
k this deck
68
Exhibit 12.5 In the following table,individuals are cross-classified by their age group and income level. Refer to Exhibit 12.5.The p-value is:
A)Less than 0.01
B)Between 0.01 and 0.05
C)Between 0.05 and 0.10
D)Greater than 0.10
Refer to Exhibit 12.5.The p-value is:A)Less than 0.01
B)Between 0.01 and 0.05
C)Between 0.05 and 0.10
D)Greater than 0.10
Unlock Deck
Unlock for access to all 100 flashcards in this deck.
Unlock Deck
k this deck
69
Exhibit 12.5 In the following table,individuals are cross-classified by their age group and income level. Refer to Exhibit 12.5.Using the p-value approach and α = 0.05,the decision and conclusion are:
A)Do not reject the null hypothesis,age and income are dependent
B)Do not reject the null hypothesis,age and income are independent
C)Reject the null hypothesis,age and income are dependent
D)Reject the null hypothesis,age and income are independent
Refer to Exhibit 12.5.Using the p-value approach and α = 0.05,the decision and conclusion are:A)Do not reject the null hypothesis,age and income are dependent
B)Do not reject the null hypothesis,age and income are independent
C)Reject the null hypothesis,age and income are dependent
D)Reject the null hypothesis,age and income are independent
Unlock Deck
Unlock for access to all 100 flashcards in this deck.
Unlock Deck
k this deck
70
Exhibit 12.6 The following table shows the distribution of employees in an Organization.Martha Foreman,an analyst wants to see if race has a bearing on the position a person holds with this company. Refer to Exhibit 12.6.At the 5% significance level,the critical value is:
A)14.684
B)16.919
C)19.023
D)21.666
Refer to Exhibit 12.6.At the 5% significance level,the critical value is:A)14.684
B)16.919
C)19.023
D)21.666
Unlock Deck
Unlock for access to all 100 flashcards in this deck.
Unlock Deck
k this deck
71
Exhibit 12.5 In the following table,individuals are cross-classified by their age group and income level. Refer to Exhibit 12.5.For the chi-square test of independence,the degrees of freedom are:
A)2
B)4
C)9
D)8
Refer to Exhibit 12.5.For the chi-square test of independence,the degrees of freedom are:A)2
B)4
C)9
D)8
Unlock Deck
Unlock for access to all 100 flashcards in this deck.
Unlock Deck
k this deck
72
Exhibit 12.6 The following table shows the distribution of employees in an Organization.Martha Foreman,an analyst wants to see if race has a bearing on the position a person holds with this company. Refer to Exhibit 12.6.Using the critical value approach,the decision and conclusion are:
A)Reject the hypothesis,conclude race and seniority are dependent
B)Reject the null hypothesis,conclude race and seniority are independent
C)Do not reject the null hypothesis,conclude race and seniority are dependent
D)Do not reject the null hypothesis,conclude race and seniority are independent
Refer to Exhibit 12.6.Using the critical value approach,the decision and conclusion are:A)Reject the hypothesis,conclude race and seniority are dependent
B)Reject the null hypothesis,conclude race and seniority are independent
C)Do not reject the null hypothesis,conclude race and seniority are dependent
D)Do not reject the null hypothesis,conclude race and seniority are independent
Unlock Deck
Unlock for access to all 100 flashcards in this deck.
Unlock Deck
k this deck
73
Exhibit 12.5 In the following table,individuals are cross-classified by their age group and income level. Refer to Exhibit 12.5.At the 5% significance level,the critical value is:
A)13.277
B)11.143
C)9.488
D)7.779
Refer to Exhibit 12.5.At the 5% significance level,the critical value is:A)13.277
B)11.143
C)9.488
D)7.779
Unlock Deck
Unlock for access to all 100 flashcards in this deck.
Unlock Deck
k this deck
74
Exhibit 12.6 The following table shows the distribution of employees in an Organization.Martha Foreman,an analyst wants to see if race has a bearing on the position a person holds with this company. Refer to Exhibit 12.6.The p-value is:
A)Less than 0.01
B)Between 0.01 and 0.05
C)Between 0.05 and 0.10
D)Greater than 0.10
Refer to Exhibit 12.6.The p-value is:A)Less than 0.01
B)Between 0.01 and 0.05
C)Between 0.05 and 0.10
D)Greater than 0.10
Unlock Deck
Unlock for access to all 100 flashcards in this deck.
Unlock Deck
k this deck
75
Exhibit 12.6 The following table shows the distribution of employees in an Organization.Martha Foreman,an analyst wants to see if race has a bearing on the position a person holds with this company. Refer to Exhibit 12.6.For the chi-square test for independence,the degrees of freedom used are:
A)2
B)16
C)9
D)0
Refer to Exhibit 12.6.For the chi-square test for independence,the degrees of freedom used are:A)2
B)16
C)9
D)0
Unlock Deck
Unlock for access to all 100 flashcards in this deck.
Unlock Deck
k this deck
76
Exhibit 12.5 In the following table,individuals are cross-classified by their age group and income level. Refer to Exhibit 12.5.Assuming age group and income are independent,the expected 'low income and 21-35 age group' cell frequency is:
A)105.27
B)107.72
C)146.31
D)178.42
Refer to Exhibit 12.5.Assuming age group and income are independent,the expected 'low income and 21-35 age group' cell frequency is:A)105.27
B)107.72
C)146.31
D)178.42
Unlock Deck
Unlock for access to all 100 flashcards in this deck.
Unlock Deck
k this deck
77
Exhibit 12.6 The following table shows the distribution of employees in an Organization.Martha Foreman,an analyst wants to see if race has a bearing on the position a person holds with this company. Refer to Exhibit 12.6.To test that race and seniority are independent,the null and alternative hypothesis are:
A)
B)
C)
D)
Refer to Exhibit 12.6.To test that race and seniority are independent,the null and alternative hypothesis are:A)
B)
C)
D)
Unlock Deck
Unlock for access to all 100 flashcards in this deck.
Unlock Deck
k this deck
78
Exhibit 12.7 The heights (in cm)for a random sample of 60 males were measured.The sample mean is 166.55,the standard deviation is 12.57,the sample kurtosis is 0.12,and the sample skewness is -0.23.The following table shows the heights subdivided into non-overlapping intervals. Refer to Exhibit 12.7.The heights are subdivided into five intervals.The degrees of freedom for the goodness-of-fit test for normality is:
A)2
B)3
C)4
D)5
Refer to Exhibit 12.7.The heights are subdivided into five intervals.The degrees of freedom for the goodness-of-fit test for normality is:A)2
B)3
C)4
D)5
Unlock Deck
Unlock for access to all 100 flashcards in this deck.
Unlock Deck
k this deck
79
Exhibit 12.6 The following table shows the distribution of employees in an Organization.Martha Foreman,an analyst wants to see if race has a bearing on the position a person holds with this company. Refer to Exhibit 12.5.Using the p-value approach and α = 0.05,the decision and conclusion are:
A)Reject the null hypothesis,conclude race and seniority are dependent
B)Reject the null hypothesis,conclude race and seniority are independent
C)Do not reject the null hypothesis,cannot conclude race and seniority are dependent
D)Do not reject the null hypothesis,conclude race and seniority are independent
Refer to Exhibit 12.5.Using the p-value approach and α = 0.05,the decision and conclusion are:A)Reject the null hypothesis,conclude race and seniority are dependent
B)Reject the null hypothesis,conclude race and seniority are independent
C)Do not reject the null hypothesis,cannot conclude race and seniority are dependent
D)Do not reject the null hypothesis,conclude race and seniority are independent
Unlock Deck
Unlock for access to all 100 flashcards in this deck.
Unlock Deck
k this deck
80
Exhibit 12.7 The heights (in cm)for a random sample of 60 males were measured.The sample mean is 166.55,the standard deviation is 12.57,the sample kurtosis is 0.12,and the sample skewness is -0.23.The following table shows the heights subdivided into non-overlapping intervals. Refer to Exhibit 12.7.For the chi-square test for normality,the null and alternative hypothesis are:
A)
B)
C)
D)
Refer to Exhibit 12.7.For the chi-square test for normality,the null and alternative hypothesis are:A)
B)
C)
D)
Unlock Deck
Unlock for access to all 100 flashcards in this deck.
Unlock Deck
k this deck
Unlock Deck
Unlock for access to all 100 flashcards in this deck.


