Exam 12: Chi-Square Tests
Exam 1: Statistics and Data68 Questions
Exam 2: Tabular and Graphical Methods99 Questions
Exam 3: Numerical Descriptive Measures123 Questions
Exam 4: Basic Probability Concepts107 Questions
Exam 5: Discrete Probability Distributions118 Questions
Exam 6: Continuous Probability Distributions114 Questions
Exam 7: Sampling and Sampling Distributions110 Questions
Exam 8: Interval Estimation111 Questions
Exam 9: Hypothesis Testing111 Questions
Exam 10: Statistical Inference Concerning Two Populations104 Questions
Exam 11: Statistical Inference Concerning Variance96 Questions
Exam 12: Chi-Square Tests100 Questions
Exam 13: Analysis of Variance89 Questions
Exam 14: Regression Analysis116 Questions
Exam 15: Inference With Regression Models117 Questions
Exam 16: Regression Models for Nonlinear Relationships95 Questions
Exam 17: Regression Models With Dummy Variables117 Questions
Exam 18: Time Series and Forecasting103 Questions
Exam 19: Returns, Index Numbers and Inflation98 Questions
Exam 20: Nonparametric Tests99 Questions
Select questions type
For a chi-square test of a contingency table,the expected frequencies for each cell are calculated assuming the null hypothesis is true.
Free
(True/False)
4.9/5  (33)
(33)
Correct Answer: Verified
True
Packaged candies have three different types of colors,suppose you want to determine if the population proportion of each color is the same.The most appropriate test is the:
Free
(Multiple Choice)
4.8/5 (33)
Correct Answer:Verified
A
Exhibit 12-1 A card dealing machine deals spades (1),hearts (2),clubs (3),and diamonds (4)at random as if from an infinite deck.In a randomness check,1,600 cards were dealt and counted.The results are shown below. 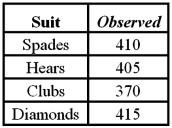 Refer to Exhibit 12.1.At the 5% significance level,the critical value is:
Free
(Multiple Choice)
4.9/5 (29)
Correct Answer:Verified
B
Exhibit 12.7 The heights (in cm)for a random sample of 60 males were measured.The sample mean is 166.55,the standard deviation is 12.57,the sample kurtosis is 0.12,and the sample skewness is -0.23.The following table shows the heights subdivided into non-overlapping intervals. 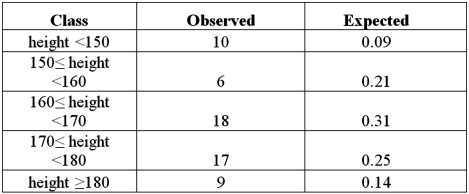 Refer to Exhibit 12.7.Using the p-value approach and
  ,the decision and conclusion are:
(Multiple Choice)
4.8/5 (33)
Exhibit 12.6 The following table shows the distribution of employees in an Organization.Martha Foreman,an analyst wants to see if race has a bearing on the position a person holds with this company. 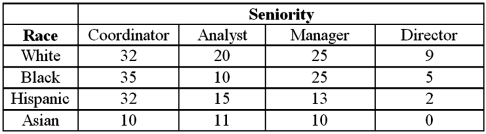 Refer to Exhibit 12.6.The row total for Asians is:
(Multiple Choice)
4.9/5 (35)
Exhibit 12.8 The heights (in cm)for a random sample of 60 male employees of S&M Construction Company were measured.The sample mean is 166.5,the standard deviation is 12.57,the sample kurtosis is 0.12,and the sample skewness is -0.23. Refer to Exhibit 12.8.The value of the Jarque-Bera test statistic is:
(Multiple Choice)
5.0/5 (36)
Exhibit 12.3 A fund manager wants to know if it equally likely that the Dow Jones Industrial average will go up each day of the week.For each day of the week,the fund manager observes the following number of days when the Dow Jones Industrial average goes up. 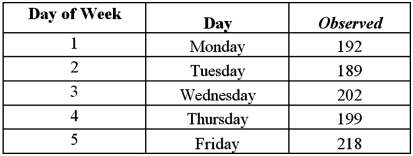 Refer to Exhibit 12.3.Using the critical value approach,the decision and conclusion are:
(Multiple Choice)
4.9/5 (34)
Exhibit 12.8 The heights (in cm)for a random sample of 60 male employees of S&M Construction Company were measured.The sample mean is 166.5,the standard deviation is 12.57,the sample kurtosis is 0.12,and the sample skewness is -0.23. Refer to Exhibit 12.8.The null and alternative hypotheses for the Jarque-Bera test for normality are:
(Multiple Choice)
4.8/5 (28)
Exhibit 12.3 A fund manager wants to know if it equally likely that the Dow Jones Industrial average will go up each day of the week.For each day of the week,the fund manager observes the following number of days when the Dow Jones Industrial average goes up.  Refer to Exhibit 12.3.At the 5% significance level,the critical value is:
(Multiple Choice)
4.9/5 (35)
Exhibit 12.4 In the following table,likely voters' preferences of two candidates are cross-classified by gender. 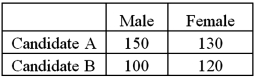 Refer to Exhibit 12.4.Using the critical value approach,the decision and conclusion are:
(Multiple Choice)
4.8/5 (39)
Suppose you want to determine if mutual funds quarterly returns have a normal distribution when your available data is partitioned into some non-overlapping intervals with given frequencies.The most appropriate test is the:
(Multiple Choice)
4.8/5 (43)
Exhibit 12.6 The following table shows the distribution of employees in an Organization.Martha Foreman,an analyst wants to see if race has a bearing on the position a person holds with this company.  Refer to Exhibit 12.6.Assuming that race and seniority are independent,what is the expected frequency of Asian directors?
(Multiple Choice)
4.8/5 (33)
For a chi-square goodness-of-fit test,the expected category frequencies are calculated using the sample category proportions.
(True/False)
4.9/5 (31)
Exhibit 12.6 The following table shows the distribution of employees in an Organization.Martha Foreman,an analyst wants to see if race has a bearing on the position a person holds with this company.  Refer to Exhibit 12.6.To test that race and seniority are independent,the null and alternative hypothesis are:
(Multiple Choice)
4.7/5 (31)
Exhibit 12.5 In the following table,individuals are cross-classified by their age group and income level. 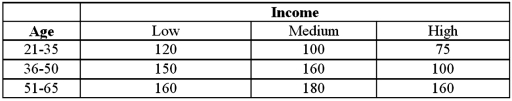 Refer to Exhibit 12.5.Assuming age group and income are independent,the expected 'low income and 21-35 age group' cell frequency is:
(Multiple Choice)
4.8/5 (40)
Exhibit 12-1 A card dealing machine deals spades (1),hearts (2),clubs (3),and diamonds (4)at random as if from an infinite deck.In a randomness check,1,600 cards were dealt and counted.The results are shown below.  Refer to Exhibit 12.1.For the goodness-of-fit test,the value of the test statistic is:
(Multiple Choice)
4.8/5 (34)
A researcher wants to determine if the distribution of races hired at government agencies is reflective of the overall U.S.population demographics.The researcher uses census data on demographics to obtain proportions for different races.The following table shows these proportions and the number of each race hired for a particular government agency. 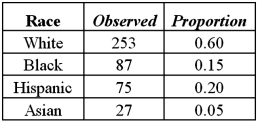 A)Set up the competing hypotheses to test if at least one proportion is different from the population demographics.
B)Calculate the value of the test statistic and determine the degrees of freedom.
C)Compute the p-value.Does the evidence suggest at least one proportion is different from the population demographics at the 1% significance level?
A)Set up the competing hypotheses to test if at least one proportion is different from the population demographics.
B)Calculate the value of the test statistic and determine the degrees of freedom.
C)Compute the p-value.Does the evidence suggest at least one proportion is different from the population demographics at the 1% significance level?
(Essay)
4.7/5 (27)
A travel agent wants to determine if clients have a preference of four different airlines.For a sample of 200 flight reservations,there were 70,45,48,and 37 reservations for the four different airlines.
A)Set up the competing hypotheses to test if the population proportions are not equal to each other.
B)Calculate the value of the test statistic.
C)Specify the critical value at the 5% significance level.
D)What is the conclusion of the hypothesis test?
(Essay)
4.8/5 (33)
Exhibit 12.4 In the following table,likely voters' preferences of two candidates are cross-classified by gender.  Refer to Exhibit 12.4.For the chi-square test of independence,the value of the test statistic is:
(Multiple Choice)
4.7/5 (31)
Exhibit 12-1 A card dealing machine deals spades (1),hearts (2),clubs (3),and diamonds (4)at random as if from an infinite deck.In a randomness check,1,600 cards were dealt and counted.The results are shown below.  Refer to Exhibit 12.1.To test if the poker dealing machine deals cards at random,the null and alternative hypotheses are:
(Multiple Choice)
4.9/5 (44)
Filters
- Essay(0)
- Multiple Choice(0)
- Short Answer(0)
- True False(0)
- Matching(0)