Deck 13: Inference for Regression
Full screen (f)
Question
You can visit the official website of any large restaurant chain to examine the nutritional data for menu items. For fast-food restaurants, many menu items are high in fat, so most of their calorie content comes from fat (rather than from carbohydrates or protein). Here we investigate the relationship between the amount of fat in a menu item (in grams) and the number of calories. To predict the number of calories in a menu item given its fat content, we use the simple linear regression model calories = + (fat), where the deviations are assumed to be independent and Normally distributed, with mean 0 and standard deviation . At one major fast-food restaurant chain, there were 26 items listed under the heading of "Sandwiches" (which includes hamburgers, chicken sandwiches, and other sandwich selections) on the menu. We fit the model to the data using the method of least squares. We treat these 26 menu items (which came from one restaurant) as a sample from the population of all sandwich items at all fast-food restaurants. This assumption is probably dubious. The following results were obtained from software. r2 = 0.846
S = 43.5747 The sample correlation between calories and fat in fast-food sandwich menu items is:
A)0.716.
B)0.92.
C)-0.92.
D)-0.716.
S = 43.5747
The sample correlation between calories and fat in fast-food sandwich menu items is:A)0.716.
B)0.92.
C)-0.92.
D)-0.716.
Question
Question
You can visit the official website of any large restaurant chain to examine the nutritional data for menu items. For fast-food restaurants, many menu items are high in fat, so most of their calorie content comes from fat (rather than from carbohydrates or protein). Here we investigate the relationship between the amount of fat in a menu item (in grams) and the number of calories. To predict the number of calories in a menu item given its fat content, we use the simple linear regression model calories = + (fat), where the deviations are assumed to be independent and Normally distributed, with mean 0 and standard deviation . At one major fast-food restaurant chain, there were 26 items listed under the heading of "Sandwiches" (which includes hamburgers, chicken sandwiches, and other sandwich selections) on the menu. We fit the model to the data using the method of least squares. We treat these 26 menu items (which came from one restaurant) as a sample from the population of all sandwich items at all fast-food restaurants. This assumption is probably dubious. The following results were obtained from software. r2 = 0.846
S = 43.5747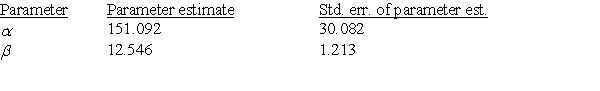 A 95% confidence interval for the mean number of calories per gram of fat in sandwich menu items at fast-food restaurants is:
A)99.627 to 202.553.
B)89.007 to 213.172.
C)10.169 to 14.923.
D)10.042 to 15.05.
S = 43.5747
A 95% confidence interval for the mean number of calories per gram of fat in sandwich menu items at fast-food restaurants is:A)99.627 to 202.553.
B)89.007 to 213.172.
C)10.169 to 14.923.
D)10.042 to 15.05.
Question
The following is a plot of the residuals versus fat for 26 menu items at a fast food restaurant. 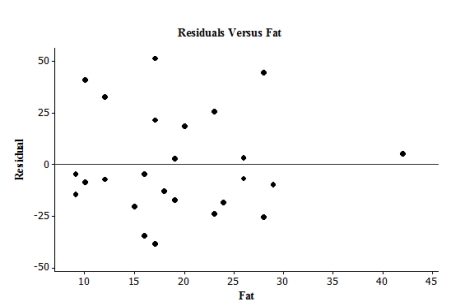 Which of the following statements is supported by this plot?
A)A linear model is appropriate for explaining the relationship between the explanatory and response variables for this case.
B)There is evidence that the deviations described by the model are not Normal in distribution.
C)The abundance of outliers and influential observations in the plot means that the assumptions for regression are clearly violated.
D)None of the answer options is correct.
Which of the following statements is supported by this plot?A)A linear model is appropriate for explaining the relationship between the explanatory and response variables for this case.
B)There is evidence that the deviations described by the model are not Normal in distribution.
C)The abundance of outliers and influential observations in the plot means that the assumptions for regression are clearly violated.
D)None of the answer options is correct.
Question
Question
The scatterplot below suggests a linear relationship between the age (in years) of an antique clock and its sale price (in euros) at auction. The data are age and sale price for 11 antique clocks sold at a recent auction.  We fit the least-squares regression line to the model price = + (age), where the deviations are assumed to be independent and Normally distributed, with mean 0 and standard deviation . A summary of the output is given. r2 = 0.848
S = 33.1559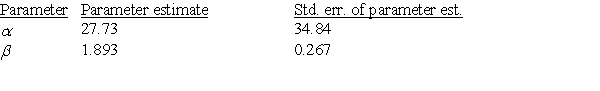 Suppose the researchers test the hypotheses H0: = 0, Ha: 0. The value of the t statistic for this test is:
A)-7.09.
B)1.893.
C)7.09.
D)0.796.
We fit the least-squares regression line to the model price = + (age), where the deviations are assumed to be independent and Normally distributed, with mean 0 and standard deviation . A summary of the output is given. r2 = 0.848S = 33.1559
Suppose the researchers test the hypotheses H0: = 0, Ha: 0. The value of the t statistic for this test is:A)-7.09.
B)1.893.
C)7.09.
D)0.796.
Question
Forced expiratory volume (FEV) is the volume of exhaled air, and it is related to lung size as well as to lung function. FEV is typically lower in persons with impaired lung function due to disease. The residual plots below are from two regressions: the first plot is from regressing height on FEV and the second is from regressing height on log(FEV). 
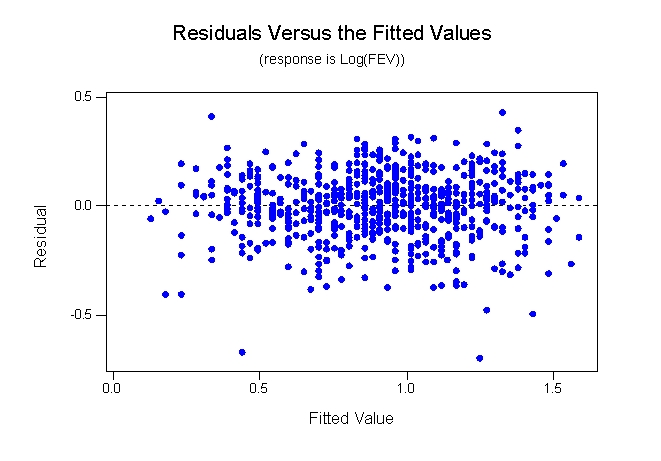 Based on these plots, which statement is correct?
A)The residual plot for height on FEV shows a nonconstant variance.
B)The residual plot for height regressed on FEV shows a nonlinear pattern.
C)The residual plot for the regression of height on log(FEV)shows a linear pattern.
D)All of the answer options are correct.
Based on these plots, which statement is correct?A)The residual plot for height on FEV shows a nonconstant variance.
B)The residual plot for height regressed on FEV shows a nonlinear pattern.
C)The residual plot for the regression of height on log(FEV)shows a linear pattern.
D)All of the answer options are correct.
Question
Question
Question
Question
A random sample of 19 companies from the Forbes 500 list was selected, and the relationship between sales (in hundreds of thousands of dollars) and profits (in hundreds of thousands of dollars) was investigated by regression. The following simple linear regression model was used: profits = + (sales), where the deviations were assumed to be independent and Normally distributed, with mean 0 and standard deviation . This model was fit to the data using the method of least squares. The following results were obtained from statistical software. r2 = 0.662
S = 466.2 Is there evidence of a straight-line relationship between sales and profits?
A)Yes, because the slope of the least-squares line is positive.
B)Yes, because the P-value for testing if the slope is 0 is quite large.
C)Yes, because the P-value for testing if the slope is 0 is quite small.
D)It is impossible to say, because we are not given the actual value of the correlation.
S = 466.2
Is there evidence of a straight-line relationship between sales and profits?A)Yes, because the slope of the least-squares line is positive.
B)Yes, because the P-value for testing if the slope is 0 is quite large.
C)Yes, because the P-value for testing if the slope is 0 is quite small.
D)It is impossible to say, because we are not given the actual value of the correlation.
Question
The scatterplot below suggests a linear relationship between the age (in years) of an antique clock and its sale price (in euros) at auction. The data are age and sale price for 11 antique clocks sold at a recent auction. 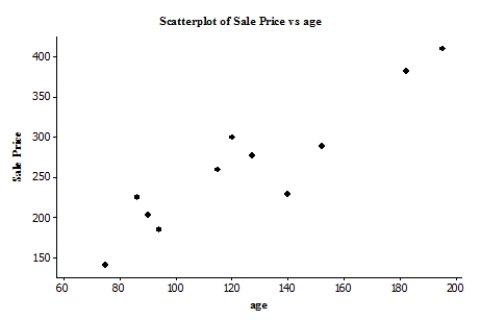 We fit the least-squares regression line to the model price = + (age), where the deviations are assumed to be independent and Normally distributed, with mean 0 and standard deviation . A summary of the output is given. r2 = 0.848
S = 33.1559 An approximate 95% confidence interval for the slope in the simple linear regression model is:
A)1.289 to 2.497 euros per year.
B)1.289 to 2.497 euros.
C)1.289 to 2.497 years per euro.
D)None of the answer options is correct.
We fit the least-squares regression line to the model price = + (age), where the deviations are assumed to be independent and Normally distributed, with mean 0 and standard deviation . A summary of the output is given. r2 = 0.848S = 33.1559
An approximate 95% confidence interval for the slope in the simple linear regression model is:A)1.289 to 2.497 euros per year.
B)1.289 to 2.497 euros.
C)1.289 to 2.497 years per euro.
D)None of the answer options is correct.
Question
A random sample of 19 companies from the Forbes 500 list was selected, and the relationship between sales (in hundreds of thousands of dollars) and profits (in hundreds of thousands of dollars) was investigated by regression. The following simple linear regression model was used: profits = + (sales), where the deviations were assumed to be independent and Normally distributed, with mean 0 and standard deviation . This model was fit to the data using the method of least squares. The following results were obtained from statistical software. r2 = 0.662
S = 466.2 Suppose the researchers test the hypotheses H0: 1 = 0, Ha: 1 > 0. The P-value of the test is:
A)greater than 0.10.
B)between 0.10 and 0.05.
C)between 0.05 and 0.01.
D)less than 0.01.
S = 466.2
Suppose the researchers test the hypotheses H0: 1 = 0, Ha: 1 > 0. The P-value of the test is:A)greater than 0.10.
B)between 0.10 and 0.05.
C)between 0.05 and 0.01.
D)less than 0.01.
Question
You can visit the official website of any large restaurant chain to examine the nutritional data for menu items. For fast-food restaurants, many menu items are high in fat, so most of their calorie content comes from fat (rather than from carbohydrates or protein). Here we investigate the relationship between the amount of fat in a menu item (in grams) and the number of calories. To predict the number of calories in a menu item given its fat content, we use the simple linear regression model calories = + (fat), where the deviations are assumed to be independent and Normally distributed, with mean 0 and standard deviation . At one major fast-food restaurant chain, there were 26 items listed under the heading of "Sandwiches" (which includes hamburgers, chicken sandwiches, and other sandwich selections) on the menu. We fit the model to the data using the method of least squares. We treat these 26 menu items (which came from one restaurant) as a sample from the population of all sandwich items at all fast-food restaurants. This assumption is probably dubious. The following results were obtained from software. r2 = 0.846
S = 43.5747 The slope of the least-squares regression line is:
A)151.09.
B)12.546.
C)0.846.
D)None of the answer options is correct.
S = 43.5747
The slope of the least-squares regression line is:A)151.09.
B)12.546.
C)0.846.
D)None of the answer options is correct.
Question
A random sample of 19 companies from the Forbes 500 list was selected, and the relationship between sales (in hundreds of thousands of dollars) and profits (in hundreds of thousands of dollars) was investigated by regression. The following simple linear regression model was used: profits = + (sales), where the deviations were assumed to be independent and Normally distributed, with mean 0 and standard deviation . This model was fit to the data using the method of least squares. The following results were obtained from statistical software. r2 = 0.662
S = 466.2 The approximate slope of the least-squares regression line is:
A)0.09.
B)0.0075.
C)-176.64.
D)61.16.
S = 466.2
The approximate slope of the least-squares regression line is:A)0.09.
B)0.0075.
C)-176.64.
D)61.16.
Question
A random sample of 19 companies from the Forbes 500 list was selected, and the relationship between sales (in hundreds of thousands of dollars) and profits (in hundreds of thousands of dollars) was investigated by regression. The following simple linear regression model was used: profits = + (sales), where the deviations were assumed to be independent and Normally distributed, with mean 0 and standard deviation . This model was fit to the data using the method of least squares. The following results were obtained from statistical software. r2 = 0.662
S = 466.2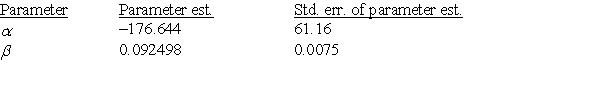 An approximate 90% confidence interval for the slope in the simple linear regression model is:
A)-176.66 to -176.63.
B)0.079 to 0.106.
C)0.071 to 0.114.
D)None of the answer options is correct.
S = 466.2
An approximate 90% confidence interval for the slope in the simple linear regression model is:A)-176.66 to -176.63.
B)0.079 to 0.106.
C)0.071 to 0.114.
D)None of the answer options is correct.
Question
You can visit the official website of any large restaurant chain to examine the nutritional data for menu items. For fast-food restaurants, many menu items are high in fat, so most of their calorie content comes from fat (rather than from carbohydrates or protein). Here we investigate the relationship between the amount of fat in a menu item (in grams) and the number of calories. To predict the number of calories in a menu item given its fat content, we use the simple linear regression model calories = + (fat), where the deviations are assumed to be independent and Normally distributed, with mean 0 and standard deviation . At one major fast-food restaurant chain, there were 26 items listed under the heading of "Sandwiches" (which includes hamburgers, chicken sandwiches, and other sandwich selections) on the menu. We fit the model to the data using the method of least squares. We treat these 26 menu items (which came from one restaurant) as a sample from the population of all sandwich items at all fast-food restaurants. This assumption is probably dubious. The following results were obtained from software. r2 = 0.846
S = 43.5747 Suppose the researchers test the hypotheses H0: = 0, Ha: > 0. The value of the t statistic for this test is:
A)10.343.
B)5.023.
C)-5.023.
D)-10.343.
S = 43.5747
Suppose the researchers test the hypotheses H0: = 0, Ha: > 0. The value of the t statistic for this test is:A)10.343.
B)5.023.
C)-5.023.
D)-10.343.
Question
Question
The scatterplot below suggests a linear relationship between the age (in years) of an antique clock and its sale price (in euros) at auction. The data are age and sale price for 11 antique clocks sold at a recent auction.  We fit the least-squares regression line to the model price = + (age), where the deviations are assumed to be independent and Normally distributed, with mean 0 and standard deviation . A summary of the output is given. r2 = 0.848
S = 33.1559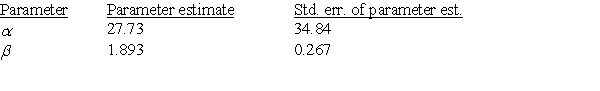 The correlation between the age of the antique clock and the auction price of the antique clock is:
A)-0.921.
B)0.921.
C)-0.719.
D)0.719.
We fit the least-squares regression line to the model price = + (age), where the deviations are assumed to be independent and Normally distributed, with mean 0 and standard deviation . A summary of the output is given. r2 = 0.848S = 33.1559
The correlation between the age of the antique clock and the auction price of the antique clock is:A)-0.921.
B)0.921.
C)-0.719.
D)0.719.
Question
The scatterplot below suggests a linear relationship between the age (in years) of an antique clock and its sale price (in euros) at auction. The data are age and sale price for 11 antique clocks sold at a recent auction. We fit the least-squares regression line to the model price = + (age), where the deviations are assumed to be independent and Normally distributed, with mean 0 and standard deviation . A summary of the output is given.
R2 = 0.848
S = 33.1559 The approximate intercept of the least-squares regression line is:
A)27.73.
B)1.893.
C)34.84.
D)0.267.
R2 = 0.848
S = 33.1559
The approximate intercept of the least-squares regression line is:A)27.73.
B)1.893.
C)34.84.
D)0.267.
Question
The following is a scatterplot of a company's profits versus their sales (in dollars). Each point on the plot represents profits and sales during one of the months in the sample.  Which of the following statements is supported by the plot?
A)There is no striking evidence that the assumptions for regression are violated and there is a clear, straight-line trend.
B)There are very influential observations suggesting that the least-squares regression line must be interpreted with extreme caution.
C)The plot contains dramatic evidence that the standard deviation of the response about the true regression line is not even approximately the same everywhere.
D)The plot contains many fewer points than are needed to fit the least-squares regression line; obviously there is a major error present.
Which of the following statements is supported by the plot?A)There is no striking evidence that the assumptions for regression are violated and there is a clear, straight-line trend.
B)There are very influential observations suggesting that the least-squares regression line must be interpreted with extreme caution.
C)The plot contains dramatic evidence that the standard deviation of the response about the true regression line is not even approximately the same everywhere.
D)The plot contains many fewer points than are needed to fit the least-squares regression line; obviously there is a major error present.
Question
A study of obesity risk in children in a head start program used a food score calculated from a 45-question food survey to predict body mass index (BMI) percentile in these children 18 months after the initial survey. The study enrolled 20 children. The researchers used a linear regression model for the prediction of BMI percentile. The food scores ranged from 45 to 245. 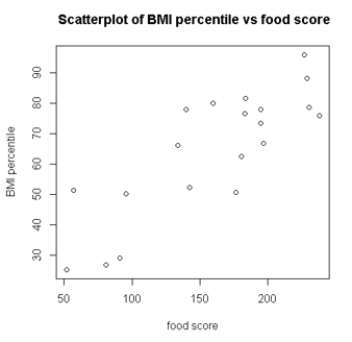 Which feature, supported by the scatterplot, is important to determine if a linear regression model can be used?
A)scatter of points around a straight line
B)even spread at each value of food score
C)correlation between BMI percentiles for subjects with similar food scores
D)options (a)and (b)only
Which feature, supported by the scatterplot, is important to determine if a linear regression model can be used?A)scatter of points around a straight line
B)even spread at each value of food score
C)correlation between BMI percentiles for subjects with similar food scores
D)options (a)and (b)only
Question
Question
A study of obesity risk in children in a head start program used a food score calculated from a 45-question food survey to predict body mass index (BMI) percentile in these children 18 months after the initial survey. The study enrolled 20 children. The researchers used a linear regression model for the prediction of BMI percentile. The food scores ranged from 45 to 245. The residual plot below was obtained by the researchers. 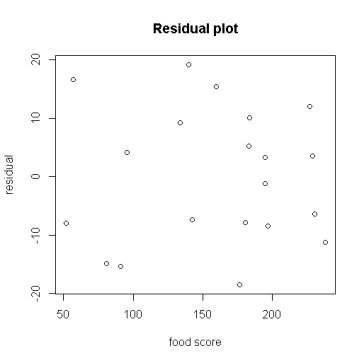 The plot does not show any obvious model violations because:
A)there is no pattern in the plot.
B)the residuals are spread evenly around the horizontal line through zero.
C)there are no obvious outliers.
D)All of the answer options are correct.
The plot does not show any obvious model violations because:A)there is no pattern in the plot.
B)the residuals are spread evenly around the horizontal line through zero.
C)there are no obvious outliers.
D)All of the answer options are correct.
Question
Question
Question
The following is a scatterplot of a company's profits versus their sales (in dollars). Each point on the plot represents profits and sales during one of the months in the sample. 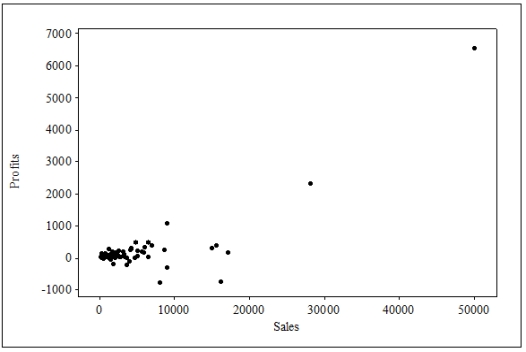 What should you do about the two points that represent profits for sales of $20K or more?
A)The two points are clearly outliers and should be eliminated from the data set prior to analysis.
B)The two points are clearly outliers, and the point in the far upper right should be eliminated from the data set prior to analysis because it is such an extreme outlier.
C)The two points may or may not be outliers, but they are definitely influential points. Prior to analysis, the data should be inspected (if possible)to validate that these points are accurate and are not the result of faulty data entry or other issues.
D)There is no need to do anything prior to analysis-all data points are equally valid and cannot simply be eliminated.
What should you do about the two points that represent profits for sales of $20K or more?A)The two points are clearly outliers and should be eliminated from the data set prior to analysis.
B)The two points are clearly outliers, and the point in the far upper right should be eliminated from the data set prior to analysis because it is such an extreme outlier.
C)The two points may or may not be outliers, but they are definitely influential points. Prior to analysis, the data should be inspected (if possible)to validate that these points are accurate and are not the result of faulty data entry or other issues.
D)There is no need to do anything prior to analysis-all data points are equally valid and cannot simply be eliminated.
Question
Suppose we wish to predict the profits (in hundreds of thousands of dollars) for companies that had sales (in hundreds of thousands of dollars) of 500 units. We use statistical software to do the prediction and obtain the following output. 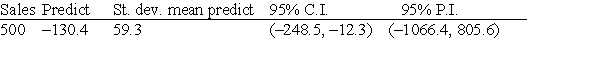 A random sample of 19 companies from the Forbes 500 list was selected, and the relationship between sales (in hundreds of thousands of dollars) and profits (in hundreds of thousands of dollars) was investigated by regression. The following simple linear regression model was used: profits = + (sales), where the deviations were assumed to be independent and Normally distributed, with mean 0 and standard deviation . This model was fit to the data using the method of least squares. The following results were obtained from statistical software. r2 = 0.662
S = 466.2 A 95% confidence interval for the average profit of companies with 500 units of sales is:
A)-1066.4 to 805.6.
B)-248.5 to -12.3.
C)-189.7 to -71.1.
D)400.7 to 559.3.
A random sample of 19 companies from the Forbes 500 list was selected, and the relationship between sales (in hundreds of thousands of dollars) and profits (in hundreds of thousands of dollars) was investigated by regression. The following simple linear regression model was used: profits = + (sales), where the deviations were assumed to be independent and Normally distributed, with mean 0 and standard deviation . This model was fit to the data using the method of least squares. The following results were obtained from statistical software. r2 = 0.662S = 466.2
A 95% confidence interval for the average profit of companies with 500 units of sales is:A)-1066.4 to 805.6.
B)-248.5 to -12.3.
C)-189.7 to -71.1.
D)400.7 to 559.3.
Question
Question
Question
The following is a scatterplot of a company's profits versus their sales (in dollars). Each point on the plot represents profits and sales during one of the months in the sample.  Assume that the point in the far upper right was erroneous, resulting from inaccurate data entry. Which of the following statements will be correct once that point is removed from the regression analysis?
A)The slope will decrease but will remain positive.
B)The slope will decrease and may become negative.
C)There will still be a clear linear trend, because the points are randomly scattered above and below the zero line.
D)The assumptions for regression will be violated and there can be no definitive, straight-line trend.
Assume that the point in the far upper right was erroneous, resulting from inaccurate data entry. Which of the following statements will be correct once that point is removed from the regression analysis?A)The slope will decrease but will remain positive.
B)The slope will decrease and may become negative.
C)There will still be a clear linear trend, because the points are randomly scattered above and below the zero line.
D)The assumptions for regression will be violated and there can be no definitive, straight-line trend.
Question
Question
Question
Question
Question
Suppose we wish to predict the profits (in hundreds of thousands of dollars) for companies that had sales (in hundreds of thousands of dollars) of 500 units. We use statistical software to do the prediction and obtain the following output.  A random sample of 19 companies from the Forbes 500 list was selected, and the relationship between sales (in hundreds of thousands of dollars) and profits (in hundreds of thousands of dollars) was investigated by regression. The following simple linear regression model was used: profits = + (sales), where the deviations were assumed to be independent and Normally distributed, with mean 0 and standard deviation . This model was fit to the data using the method of least squares. The following results were obtained from statistical software. r2 = 0.662
S = 466.2 A 95% interval for this prediction is:
A)-1066.4 to 805.6.
B)-248.5 to -12.3.
C)-189.7 to -71.1.
D)400.7 to 559.3.
A random sample of 19 companies from the Forbes 500 list was selected, and the relationship between sales (in hundreds of thousands of dollars) and profits (in hundreds of thousands of dollars) was investigated by regression. The following simple linear regression model was used: profits = + (sales), where the deviations were assumed to be independent and Normally distributed, with mean 0 and standard deviation . This model was fit to the data using the method of least squares. The following results were obtained from statistical software. r2 = 0.662S = 466.2
A 95% interval for this prediction is:A)-1066.4 to 805.6.
B)-248.5 to -12.3.
C)-189.7 to -71.1.
D)400.7 to 559.3.

Unlock Deck
Sign up to unlock the cards in this deck!
Unlock Deck
Unlock Deck
1/36
Play
Full screen (f)
Deck 13: Inference for Regression
1
You can visit the official website of any large restaurant chain to examine the nutritional data for menu items. For fast-food restaurants, many menu items are high in fat, so most of their calorie content comes from fat (rather than from carbohydrates or protein). Here we investigate the relationship between the amount of fat in a menu item (in grams) and the number of calories. To predict the number of calories in a menu item given its fat content, we use the simple linear regression model calories = + (fat), where the deviations are assumed to be independent and Normally distributed, with mean 0 and standard deviation . At one major fast-food restaurant chain, there were 26 items listed under the heading of "Sandwiches" (which includes hamburgers, chicken sandwiches, and other sandwich selections) on the menu. We fit the model to the data using the method of least squares. We treat these 26 menu items (which came from one restaurant) as a sample from the population of all sandwich items at all fast-food restaurants. This assumption is probably dubious. The following results were obtained from software. r2 = 0.846
S = 43.5747 The sample correlation between calories and fat in fast-food sandwich menu items is:
A)0.716.
B)0.92.
C)-0.92.
D)-0.716.
S = 43.5747
The sample correlation between calories and fat in fast-food sandwich menu items is:A)0.716.
B)0.92.
C)-0.92.
D)-0.716.
0.92.
2
Forced expiratory volume (FEV) is the volume of exhaled air and is related to lung size as well as lung function. It is typically lower in persons with impaired lung function due to disease. A regression of height (in inches) on FEV (in liters) showed a nonlinear pattern. Therefore, height was regressed on log(FEV) (natural log) and the residual plot showed a much improved fit. The intercept a and slope b from the regression of height on log(FEV) are a = -2.2 and b = 0.06. The correlation for this regression is:
A)positive.
B)negative.
C)zero.
D)There is not enough information to determine the answer.
A)positive.
B)negative.
C)zero.
D)There is not enough information to determine the answer.
positive.
3
You can visit the official website of any large restaurant chain to examine the nutritional data for menu items. For fast-food restaurants, many menu items are high in fat, so most of their calorie content comes from fat (rather than from carbohydrates or protein). Here we investigate the relationship between the amount of fat in a menu item (in grams) and the number of calories. To predict the number of calories in a menu item given its fat content, we use the simple linear regression model calories = + (fat), where the deviations are assumed to be independent and Normally distributed, with mean 0 and standard deviation . At one major fast-food restaurant chain, there were 26 items listed under the heading of "Sandwiches" (which includes hamburgers, chicken sandwiches, and other sandwich selections) on the menu. We fit the model to the data using the method of least squares. We treat these 26 menu items (which came from one restaurant) as a sample from the population of all sandwich items at all fast-food restaurants. This assumption is probably dubious. The following results were obtained from software. r2 = 0.846
S = 43.5747 A 95% confidence interval for the mean number of calories per gram of fat in sandwich menu items at fast-food restaurants is:
A)99.627 to 202.553.
B)89.007 to 213.172.
C)10.169 to 14.923.
D)10.042 to 15.05.
S = 43.5747
A 95% confidence interval for the mean number of calories per gram of fat in sandwich menu items at fast-food restaurants is:A)99.627 to 202.553.
B)89.007 to 213.172.
C)10.169 to 14.923.
D)10.042 to 15.05.
10.042 to 15.05.
4
The following is a plot of the residuals versus fat for 26 menu items at a fast food restaurant. Which of the following statements is supported by this plot?
A)A linear model is appropriate for explaining the relationship between the explanatory and response variables for this case.
B)There is evidence that the deviations described by the model are not Normal in distribution.
C)The abundance of outliers and influential observations in the plot means that the assumptions for regression are clearly violated.
D)None of the answer options is correct.
Which of the following statements is supported by this plot?A)A linear model is appropriate for explaining the relationship between the explanatory and response variables for this case.
B)There is evidence that the deviations described by the model are not Normal in distribution.
C)The abundance of outliers and influential observations in the plot means that the assumptions for regression are clearly violated.
D)None of the answer options is correct.
Unlock Deck
Unlock for access to all 36 flashcards in this deck.
Unlock Deck
k this deck
5
Forced expiratory volume (FEV) is the volume of exhaled air and is related to lung size as well as lung function. It is typically lower in persons with impaired lung function due to disease. A regression of height (in inches) on FEV (in liters) showed a nonlinear pattern. Therefore, height was regressed on log(FEV) (natural log) and the residual plot showed a much improved fit. The intercept a and slope b from the regression of height on log(FEV) are a = -2.2 and b = 0.06. A 5-foot-tall person is predicted to have a lung volume of:
A)1.4 liters.
B)4.1 liters.
C)2.2 liters.
D)0.06 liters.
A)1.4 liters.
B)4.1 liters.
C)2.2 liters.
D)0.06 liters.
Unlock Deck
Unlock for access to all 36 flashcards in this deck.
Unlock Deck
k this deck
6
The scatterplot below suggests a linear relationship between the age (in years) of an antique clock and its sale price (in euros) at auction. The data are age and sale price for 11 antique clocks sold at a recent auction. We fit the least-squares regression line to the model price = + (age), where the deviations are assumed to be independent and Normally distributed, with mean 0 and standard deviation . A summary of the output is given. r2 = 0.848
S = 33.1559 Suppose the researchers test the hypotheses H0: = 0, Ha: 0. The value of the t statistic for this test is:
A)-7.09.
B)1.893.
C)7.09.
D)0.796.
We fit the least-squares regression line to the model price = + (age), where the deviations are assumed to be independent and Normally distributed, with mean 0 and standard deviation . A summary of the output is given. r2 = 0.848S = 33.1559
Suppose the researchers test the hypotheses H0: = 0, Ha: 0. The value of the t statistic for this test is:A)-7.09.
B)1.893.
C)7.09.
D)0.796.
Unlock Deck
Unlock for access to all 36 flashcards in this deck.
Unlock Deck
k this deck
7
Forced expiratory volume (FEV) is the volume of exhaled air, and it is related to lung size as well as to lung function. FEV is typically lower in persons with impaired lung function due to disease. The residual plots below are from two regressions: the first plot is from regressing height on FEV and the second is from regressing height on log(FEV). Based on these plots, which statement is correct?
A)The residual plot for height on FEV shows a nonconstant variance.
B)The residual plot for height regressed on FEV shows a nonlinear pattern.
C)The residual plot for the regression of height on log(FEV)shows a linear pattern.
D)All of the answer options are correct.
Based on these plots, which statement is correct?A)The residual plot for height on FEV shows a nonconstant variance.
B)The residual plot for height regressed on FEV shows a nonlinear pattern.
C)The residual plot for the regression of height on log(FEV)shows a linear pattern.
D)All of the answer options are correct.
Unlock Deck
Unlock for access to all 36 flashcards in this deck.
Unlock Deck
k this deck
8
You can visit the official website of any large restaurant chain to examine the nutritional data for menu items. For fast-food restaurants, many menu items are high in fat, so most of their calorie content comes from fat (rather than from carbohydrates or protein). Here we investigate the relationship between the amount of fat in a menu item (in grams) and the number of calories. To predict the number of calories in a menu item given its fat content, we use the simple linear regression model calories = + (fat), where the deviations are assumed to be independent and Normally distributed, with mean 0 and standard deviation . The explanatory variable in this study is:
A)number of calories.
B)fat content (grams of fat).
C)the slope, .
D)12.546.
A)number of calories.
B)fat content (grams of fat).
C)the slope, .
D)12.546.
Unlock Deck
Unlock for access to all 36 flashcards in this deck.
Unlock Deck
k this deck
9
Frequent food questionnaires (FFQs) are often given to large groups of people to obtain information on their dietary habits. Study participants are asked about the frequency with which they consume certain goods. Another method to obtain information on foods consumed is a food diary. People are asked to record every type of food and amount consumed for a few days. Food diaries are more difficult to obtain and response rates are lower than for FFQs. A study was conducted to see how well FFQs predict food consumed based on food diaries. In this study, the explanatory variable is:
A)the amount of food consumed.
B)the amount of food consumed according to the food diary.
C)the amount of food consumed according to the FFQ.
D)dependent on the response.
A)the amount of food consumed.
B)the amount of food consumed according to the food diary.
C)the amount of food consumed according to the FFQ.
D)dependent on the response.
Unlock Deck
Unlock for access to all 36 flashcards in this deck.
Unlock Deck
k this deck
10
Frequent food questionnaires (FFQs) are often given to large groups of people to obtain information on their dietary habits. Study participants are asked about the frequency with which they consume certain goods. Another method to obtain information on foods consumed is a food diary. People are asked to record every type of food and amount consumed for a few days. Food diaries are more difficult to obtain and response rates are lower than for FFQs. A study was conducted to see how well frequent food questionnaires predict food consumed based on food diaries. The regression of alcohol consumption FFQ on alcohol consumption food diary had an intercept of a = 2.96 and a slope of b = 0.67. The predicted number of drinks consumed in the food diary, if the FFQ states 5 drinks, is:
A)6.31.
B)0.67.
C)2.96.
D)5.
A)6.31.
B)0.67.
C)2.96.
D)5.
Unlock Deck
Unlock for access to all 36 flashcards in this deck.
Unlock Deck
k this deck
11
A random sample of 19 companies from the Forbes 500 list was selected, and the relationship between sales (in hundreds of thousands of dollars) and profits (in hundreds of thousands of dollars) was investigated by regression. The following simple linear regression model was used: profits = + (sales), where the deviations were assumed to be independent and Normally distributed, with mean 0 and standard deviation . This model was fit to the data using the method of least squares. The following results were obtained from statistical software. r2 = 0.662
S = 466.2 Is there evidence of a straight-line relationship between sales and profits?
A)Yes, because the slope of the least-squares line is positive.
B)Yes, because the P-value for testing if the slope is 0 is quite large.
C)Yes, because the P-value for testing if the slope is 0 is quite small.
D)It is impossible to say, because we are not given the actual value of the correlation.
S = 466.2
Is there evidence of a straight-line relationship between sales and profits?A)Yes, because the slope of the least-squares line is positive.
B)Yes, because the P-value for testing if the slope is 0 is quite large.
C)Yes, because the P-value for testing if the slope is 0 is quite small.
D)It is impossible to say, because we are not given the actual value of the correlation.
Unlock Deck
Unlock for access to all 36 flashcards in this deck.
Unlock Deck
k this deck
12
The scatterplot below suggests a linear relationship between the age (in years) of an antique clock and its sale price (in euros) at auction. The data are age and sale price for 11 antique clocks sold at a recent auction. We fit the least-squares regression line to the model price = + (age), where the deviations are assumed to be independent and Normally distributed, with mean 0 and standard deviation . A summary of the output is given. r2 = 0.848
S = 33.1559 An approximate 95% confidence interval for the slope in the simple linear regression model is:
A)1.289 to 2.497 euros per year.
B)1.289 to 2.497 euros.
C)1.289 to 2.497 years per euro.
D)None of the answer options is correct.
We fit the least-squares regression line to the model price = + (age), where the deviations are assumed to be independent and Normally distributed, with mean 0 and standard deviation . A summary of the output is given. r2 = 0.848S = 33.1559
An approximate 95% confidence interval for the slope in the simple linear regression model is:A)1.289 to 2.497 euros per year.
B)1.289 to 2.497 euros.
C)1.289 to 2.497 years per euro.
D)None of the answer options is correct.
Unlock Deck
Unlock for access to all 36 flashcards in this deck.
Unlock Deck
k this deck
13
A random sample of 19 companies from the Forbes 500 list was selected, and the relationship between sales (in hundreds of thousands of dollars) and profits (in hundreds of thousands of dollars) was investigated by regression. The following simple linear regression model was used: profits = + (sales), where the deviations were assumed to be independent and Normally distributed, with mean 0 and standard deviation . This model was fit to the data using the method of least squares. The following results were obtained from statistical software. r2 = 0.662
S = 466.2 Suppose the researchers test the hypotheses H0: 1 = 0, Ha: 1 > 0. The P-value of the test is:
A)greater than 0.10.
B)between 0.10 and 0.05.
C)between 0.05 and 0.01.
D)less than 0.01.
S = 466.2
Suppose the researchers test the hypotheses H0: 1 = 0, Ha: 1 > 0. The P-value of the test is:A)greater than 0.10.
B)between 0.10 and 0.05.
C)between 0.05 and 0.01.
D)less than 0.01.
Unlock Deck
Unlock for access to all 36 flashcards in this deck.
Unlock Deck
k this deck
14
You can visit the official website of any large restaurant chain to examine the nutritional data for menu items. For fast-food restaurants, many menu items are high in fat, so most of their calorie content comes from fat (rather than from carbohydrates or protein). Here we investigate the relationship between the amount of fat in a menu item (in grams) and the number of calories. To predict the number of calories in a menu item given its fat content, we use the simple linear regression model calories = + (fat), where the deviations are assumed to be independent and Normally distributed, with mean 0 and standard deviation . At one major fast-food restaurant chain, there were 26 items listed under the heading of "Sandwiches" (which includes hamburgers, chicken sandwiches, and other sandwich selections) on the menu. We fit the model to the data using the method of least squares. We treat these 26 menu items (which came from one restaurant) as a sample from the population of all sandwich items at all fast-food restaurants. This assumption is probably dubious. The following results were obtained from software. r2 = 0.846
S = 43.5747 The slope of the least-squares regression line is:
A)151.09.
B)12.546.
C)0.846.
D)None of the answer options is correct.
S = 43.5747
The slope of the least-squares regression line is:A)151.09.
B)12.546.
C)0.846.
D)None of the answer options is correct.
Unlock Deck
Unlock for access to all 36 flashcards in this deck.
Unlock Deck
k this deck
15
A random sample of 19 companies from the Forbes 500 list was selected, and the relationship between sales (in hundreds of thousands of dollars) and profits (in hundreds of thousands of dollars) was investigated by regression. The following simple linear regression model was used: profits = + (sales), where the deviations were assumed to be independent and Normally distributed, with mean 0 and standard deviation . This model was fit to the data using the method of least squares. The following results were obtained from statistical software. r2 = 0.662
S = 466.2 The approximate slope of the least-squares regression line is:
A)0.09.
B)0.0075.
C)-176.64.
D)61.16.
S = 466.2
The approximate slope of the least-squares regression line is:A)0.09.
B)0.0075.
C)-176.64.
D)61.16.
Unlock Deck
Unlock for access to all 36 flashcards in this deck.
Unlock Deck
k this deck
16
A random sample of 19 companies from the Forbes 500 list was selected, and the relationship between sales (in hundreds of thousands of dollars) and profits (in hundreds of thousands of dollars) was investigated by regression. The following simple linear regression model was used: profits = + (sales), where the deviations were assumed to be independent and Normally distributed, with mean 0 and standard deviation . This model was fit to the data using the method of least squares. The following results were obtained from statistical software. r2 = 0.662
S = 466.2 An approximate 90% confidence interval for the slope in the simple linear regression model is:
A)-176.66 to -176.63.
B)0.079 to 0.106.
C)0.071 to 0.114.
D)None of the answer options is correct.
S = 466.2
An approximate 90% confidence interval for the slope in the simple linear regression model is:A)-176.66 to -176.63.
B)0.079 to 0.106.
C)0.071 to 0.114.
D)None of the answer options is correct.
Unlock Deck
Unlock for access to all 36 flashcards in this deck.
Unlock Deck
k this deck
17
You can visit the official website of any large restaurant chain to examine the nutritional data for menu items. For fast-food restaurants, many menu items are high in fat, so most of their calorie content comes from fat (rather than from carbohydrates or protein). Here we investigate the relationship between the amount of fat in a menu item (in grams) and the number of calories. To predict the number of calories in a menu item given its fat content, we use the simple linear regression model calories = + (fat), where the deviations are assumed to be independent and Normally distributed, with mean 0 and standard deviation . At one major fast-food restaurant chain, there were 26 items listed under the heading of "Sandwiches" (which includes hamburgers, chicken sandwiches, and other sandwich selections) on the menu. We fit the model to the data using the method of least squares. We treat these 26 menu items (which came from one restaurant) as a sample from the population of all sandwich items at all fast-food restaurants. This assumption is probably dubious. The following results were obtained from software. r2 = 0.846
S = 43.5747 Suppose the researchers test the hypotheses H0: = 0, Ha: > 0. The value of the t statistic for this test is:
A)10.343.
B)5.023.
C)-5.023.
D)-10.343.
S = 43.5747
Suppose the researchers test the hypotheses H0: = 0, Ha: > 0. The value of the t statistic for this test is:A)10.343.
B)5.023.
C)-5.023.
D)-10.343.
Unlock Deck
Unlock for access to all 36 flashcards in this deck.
Unlock Deck
k this deck
18
You can visit the official website of any large restaurant chain to examine the nutritional data for menu items. For fast-food restaurants, many menu items are high in fat, so most of their calorie content comes from fat (rather than from carbohydrates or protein). Here we investigate the relationship between the amount of fat in a menu item (in grams) and the number of calories. To predict the number of calories in a menu item given its fat content, we use the simple linear regression model calories = + (fat), where the deviations are assumed to be independent and Normally distributed, with mean 0 and standard deviation . At one major fast-food restaurant chain, there were 26 items listed under the heading of "Sandwiches" (which includes hamburgers, chicken sandwiches, and other sandwich selections) on the menu. We fit the model to the data using the method of least squares. We treat these 26 menu items (which came from one restaurant) as a sample from the population of all sandwich items at all fast-food restaurants. Suppose the researchers test the hypotheses H0: = 0, Ha: > 0. The value of the t statistic for this test is greater than 5. The P-value corresponding to the test of the hypotheses is:
A)more than 0.02.
B)between 0.001 and 0.02.
C)between 0.0005 and 0.001.
D)less than 0.0005.
A)more than 0.02.
B)between 0.001 and 0.02.
C)between 0.0005 and 0.001.
D)less than 0.0005.
Unlock Deck
Unlock for access to all 36 flashcards in this deck.
Unlock Deck
k this deck
19
The scatterplot below suggests a linear relationship between the age (in years) of an antique clock and its sale price (in euros) at auction. The data are age and sale price for 11 antique clocks sold at a recent auction. We fit the least-squares regression line to the model price = + (age), where the deviations are assumed to be independent and Normally distributed, with mean 0 and standard deviation . A summary of the output is given. r2 = 0.848
S = 33.1559 The correlation between the age of the antique clock and the auction price of the antique clock is:
A)-0.921.
B)0.921.
C)-0.719.
D)0.719.
We fit the least-squares regression line to the model price = + (age), where the deviations are assumed to be independent and Normally distributed, with mean 0 and standard deviation . A summary of the output is given. r2 = 0.848S = 33.1559
The correlation between the age of the antique clock and the auction price of the antique clock is:A)-0.921.
B)0.921.
C)-0.719.
D)0.719.
Unlock Deck
Unlock for access to all 36 flashcards in this deck.
Unlock Deck
k this deck
20
The scatterplot below suggests a linear relationship between the age (in years) of an antique clock and its sale price (in euros) at auction. The data are age and sale price for 11 antique clocks sold at a recent auction. We fit the least-squares regression line to the model price = + (age), where the deviations are assumed to be independent and Normally distributed, with mean 0 and standard deviation . A summary of the output is given.
R2 = 0.848
S = 33.1559 The approximate intercept of the least-squares regression line is:
A)27.73.
B)1.893.
C)34.84.
D)0.267.
R2 = 0.848
S = 33.1559
The approximate intercept of the least-squares regression line is:A)27.73.
B)1.893.
C)34.84.
D)0.267.
Unlock Deck
Unlock for access to all 36 flashcards in this deck.
Unlock Deck
k this deck
21
The following is a scatterplot of a company's profits versus their sales (in dollars). Each point on the plot represents profits and sales during one of the months in the sample. Which of the following statements is supported by the plot?
A)There is no striking evidence that the assumptions for regression are violated and there is a clear, straight-line trend.
B)There are very influential observations suggesting that the least-squares regression line must be interpreted with extreme caution.
C)The plot contains dramatic evidence that the standard deviation of the response about the true regression line is not even approximately the same everywhere.
D)The plot contains many fewer points than are needed to fit the least-squares regression line; obviously there is a major error present.
Which of the following statements is supported by the plot?A)There is no striking evidence that the assumptions for regression are violated and there is a clear, straight-line trend.
B)There are very influential observations suggesting that the least-squares regression line must be interpreted with extreme caution.
C)The plot contains dramatic evidence that the standard deviation of the response about the true regression line is not even approximately the same everywhere.
D)The plot contains many fewer points than are needed to fit the least-squares regression line; obviously there is a major error present.
Unlock Deck
Unlock for access to all 36 flashcards in this deck.
Unlock Deck
k this deck
22
A study of obesity risk in children in a head start program used a food score calculated from a 45-question food survey to predict body mass index (BMI) percentile in these children 18 months after the initial survey. The study enrolled 20 children. The researchers used a linear regression model for the prediction of BMI percentile. The food scores ranged from 45 to 245. Which feature, supported by the scatterplot, is important to determine if a linear regression model can be used?
A)scatter of points around a straight line
B)even spread at each value of food score
C)correlation between BMI percentiles for subjects with similar food scores
D)options (a)and (b)only
Which feature, supported by the scatterplot, is important to determine if a linear regression model can be used?A)scatter of points around a straight line
B)even spread at each value of food score
C)correlation between BMI percentiles for subjects with similar food scores
D)options (a)and (b)only
Unlock Deck
Unlock for access to all 36 flashcards in this deck.
Unlock Deck
k this deck
23
A study of obesity risk in children in a head start program used a food score calculated from a 45-question food survey to predict body mass index (BMI) percentile in these children 18 months after the initial survey. The study enrolled 130 children. The researchers used a linear regression model for the prediction of BMI percentile. The food scores ranged from 45 to 245. Fifteen children had a food score of 170. A boxplot of those 15 children showed BMI percentile to be very skewed. This information is:
A)irrelevant, because the relationship between food score and BMI percentile is being studied, not the BMI percentile values themselves.
B)important, because one requirement for the validity of inference is that BMI percentile is Normally distributed at each value of the food score.
C)irrelevant, as long as variation about the regression line is constant.
D)probably due to some outlier and should simply be ignored.
Unlock Deck
Unlock for access to all 36 flashcards in this deck.
Unlock Deck
k this deck
24
A study of obesity risk in children in a head start program used a food score calculated from a 45-question food survey to predict body mass index (BMI) percentile in these children 18 months after the initial survey. The study enrolled 20 children. The researchers used a linear regression model for the prediction of BMI percentile. The food scores ranged from 45 to 245. The residual plot below was obtained by the researchers. The plot does not show any obvious model violations because:
A)there is no pattern in the plot.
B)the residuals are spread evenly around the horizontal line through zero.
C)there are no obvious outliers.
D)All of the answer options are correct.
The plot does not show any obvious model violations because:A)there is no pattern in the plot.
B)the residuals are spread evenly around the horizontal line through zero.
C)there are no obvious outliers.
D)All of the answer options are correct.
Unlock Deck
Unlock for access to all 36 flashcards in this deck.
Unlock Deck
k this deck
25
A study of obesity risk in children in a head start program used a food score calculated from a 45-question food survey to predict body mass index (BMI) percentile in these children 18 months after the initial survey. The study enrolled 20 children. The researchers used a linear regression model for the prediction of BMI percentile. The food scores ranged from 45 to 245. A regression model has:
A)one unknown parameter to be estimated.
B)two unknown parameters to be estimated.
C)three unknown parameters to be estimated.
D)four unknown parameters to be estimated.
A)one unknown parameter to be estimated.
B)two unknown parameters to be estimated.
C)three unknown parameters to be estimated.
D)four unknown parameters to be estimated.
Unlock Deck
Unlock for access to all 36 flashcards in this deck.
Unlock Deck
k this deck
26
A study of obesity risk in children in a head start program used a food score calculated from a 45-question food survey to predict body mass index (BMI) percentile in these children 18 months after the initial survey. The study enrolled 20 children. The researchers used a linear regression model for the prediction of BMI percentile. The food scores ranged from 45 to 245. "Linear" refers to which of the following?
A)Mean BMI percentile varies linearly with food score.
B)Variation about the regression line varies linearly with food score.
C)Each BMI percentile is linearly related to food score.
D)All of the answer options are correct.
A)Mean BMI percentile varies linearly with food score.
B)Variation about the regression line varies linearly with food score.
C)Each BMI percentile is linearly related to food score.
D)All of the answer options are correct.
Unlock Deck
Unlock for access to all 36 flashcards in this deck.
Unlock Deck
k this deck
27
The following is a scatterplot of a company's profits versus their sales (in dollars). Each point on the plot represents profits and sales during one of the months in the sample. What should you do about the two points that represent profits for sales of $20K or more?
A)The two points are clearly outliers and should be eliminated from the data set prior to analysis.
B)The two points are clearly outliers, and the point in the far upper right should be eliminated from the data set prior to analysis because it is such an extreme outlier.
C)The two points may or may not be outliers, but they are definitely influential points. Prior to analysis, the data should be inspected (if possible)to validate that these points are accurate and are not the result of faulty data entry or other issues.
D)There is no need to do anything prior to analysis-all data points are equally valid and cannot simply be eliminated.
What should you do about the two points that represent profits for sales of $20K or more?A)The two points are clearly outliers and should be eliminated from the data set prior to analysis.
B)The two points are clearly outliers, and the point in the far upper right should be eliminated from the data set prior to analysis because it is such an extreme outlier.
C)The two points may or may not be outliers, but they are definitely influential points. Prior to analysis, the data should be inspected (if possible)to validate that these points are accurate and are not the result of faulty data entry or other issues.
D)There is no need to do anything prior to analysis-all data points are equally valid and cannot simply be eliminated.
Unlock Deck
Unlock for access to all 36 flashcards in this deck.
Unlock Deck
k this deck
28
Suppose we wish to predict the profits (in hundreds of thousands of dollars) for companies that had sales (in hundreds of thousands of dollars) of 500 units. We use statistical software to do the prediction and obtain the following output. A random sample of 19 companies from the Forbes 500 list was selected, and the relationship between sales (in hundreds of thousands of dollars) and profits (in hundreds of thousands of dollars) was investigated by regression. The following simple linear regression model was used: profits = + (sales), where the deviations were assumed to be independent and Normally distributed, with mean 0 and standard deviation . This model was fit to the data using the method of least squares. The following results were obtained from statistical software. r2 = 0.662
S = 466.2 A 95% confidence interval for the average profit of companies with 500 units of sales is:
A)-1066.4 to 805.6.
B)-248.5 to -12.3.
C)-189.7 to -71.1.
D)400.7 to 559.3.
A random sample of 19 companies from the Forbes 500 list was selected, and the relationship between sales (in hundreds of thousands of dollars) and profits (in hundreds of thousands of dollars) was investigated by regression. The following simple linear regression model was used: profits = + (sales), where the deviations were assumed to be independent and Normally distributed, with mean 0 and standard deviation . This model was fit to the data using the method of least squares. The following results were obtained from statistical software. r2 = 0.662S = 466.2
A 95% confidence interval for the average profit of companies with 500 units of sales is:A)-1066.4 to 805.6.
B)-248.5 to -12.3.
C)-189.7 to -71.1.
D)400.7 to 559.3.
Unlock Deck
Unlock for access to all 36 flashcards in this deck.
Unlock Deck
k this deck
29
A study of obesity risk in children in a head start program used a food score calculated from a 45-question food survey to predict body mass index (BMI) percentile in these children 18 months after the initial survey. The study enrolled 20 children. The researchers used a linear regression model for the prediction of BMI percentile. The food scores ranged from 45 to 245. The linear regression had slope = 0.29 and intercept = 18.3. The average BMI percentile for a child with food score 150 equals 61.8, and an individual child with food score 150 will be predicted to have a BMI percentile of:
A)18.3.
B)61.8.
C)80.1.
D)43.5.
A)18.3.
B)61.8.
C)80.1.
D)43.5.
Unlock Deck
Unlock for access to all 36 flashcards in this deck.
Unlock Deck
k this deck
30
A study of obesity risk in children in a head start program used a food score calculated from a 45-question food survey to predict body mass index (BMI) percentile in these children 18 months after the initial survey. The study enrolled 130 children. The researchers used a linear regression model for the prediction of BMI percentile. Which of the following is not a condition for linear regression?
A)BMI percentile varies according to a Normal distribution for a fixed food score.
B)The variation of BMI percentile around the regression line is the same for all food scores.
C)Mean BMI percentile increases for all children over the 18-month period.
D)Mean BMI percentile varies linearly with the food score.
Unlock Deck
Unlock for access to all 36 flashcards in this deck.
Unlock Deck
k this deck
31
The following is a scatterplot of a company's profits versus their sales (in dollars). Each point on the plot represents profits and sales during one of the months in the sample. Assume that the point in the far upper right was erroneous, resulting from inaccurate data entry. Which of the following statements will be correct once that point is removed from the regression analysis?
A)The slope will decrease but will remain positive.
B)The slope will decrease and may become negative.
C)There will still be a clear linear trend, because the points are randomly scattered above and below the zero line.
D)The assumptions for regression will be violated and there can be no definitive, straight-line trend.
Assume that the point in the far upper right was erroneous, resulting from inaccurate data entry. Which of the following statements will be correct once that point is removed from the regression analysis?A)The slope will decrease but will remain positive.
B)The slope will decrease and may become negative.
C)There will still be a clear linear trend, because the points are randomly scattered above and below the zero line.
D)The assumptions for regression will be violated and there can be no definitive, straight-line trend.
Unlock Deck
Unlock for access to all 36 flashcards in this deck.
Unlock Deck
k this deck
32
A study of obesity risk in children in a head start program used a food score calculated from a 45-question food survey to predict body mass index (BMI) percentile in these children 18 months after the initial survey. The study enrolled 20 children. The researchers used a linear regression model for the prediction of BMI percentile with food scores ranging between 45 and 245. The least-squares estimates were slope = 0.29 and intercept = 18.3. If child A has a food score of 145 and child B has a food score of 180, then the difference in BMI percentile between child B and child A is:
A)10.15.
B)0.29.
C)18.3.
D)28.45.
A)10.15.
B)0.29.
C)18.3.
D)28.45.
Unlock Deck
Unlock for access to all 36 flashcards in this deck.
Unlock Deck
k this deck
33
A study of obesity risk in children in a head start program used a food score calculated from a 45-question food survey to predict body mass index (BMI) percentile in these children 18 months after the initial survey. The study enrolled 20 children. The researchers used a linear regression model for the prediction of BMI percentile. The food scores ranged from 45 to 245. The least-squares estimate for the slope was 0.29 with standard error SE = 0.046. The t statistic for the hypothesis H0: = 0 is given by:
A)1.96.
B)6.3.
C)2.39.
D)4.62.
A)1.96.
B)6.3.
C)2.39.
D)4.62.
Unlock Deck
Unlock for access to all 36 flashcards in this deck.
Unlock Deck
k this deck
34
A study of obesity risk in children in a head start program used a food score calculated from a 45-question food survey to predict body mass index (BMI) percentile in these children 18 months after the initial survey. The study enrolled 20 children. The researchers used a linear regression model for the prediction of BMI percentile. The food scores ranged from 45 to 245. The regression line that is calculated by standard regression programs or by hand is called the least-squares line because it:
A)minimizes the distances of actual BMI percentiles from the regression line.
B)minimizes the squared distances of the actual BMI percentiles from the regression line.
C)minimizes sum of the squared distances of the actual BMI percentiles from the regression line.
D)minimizes the sum of the distances of the actual BMI percentiles from the regression line.
Unlock Deck
Unlock for access to all 36 flashcards in this deck.
Unlock Deck
k this deck
35
A study of obesity risk in children in a head start program used a food score calculated from a 45-question food survey to predict body mass index (BMI) percentile in these children 18 months after the initial survey. The study enrolled 20 children. The researchers used a linear regression model for the prediction of BMI percentile. The food scores ranged from 45 to 245. Two computer programs the researchers used to obtain their regression model and related calculations also provided two intervals for a child with food score 150. Interval I1 = (56.13, 67.35) and interval I2 = (36.35, 87.13). These intervals, respectively, are called:
A)the regression and residual intervals.
B)the mean interval and the regression interval.
C)the interval for prediction of value and the interval for regression.
D)the interval for mean BMI and the prediction interval for food score 150.
A)the regression and residual intervals.
B)the mean interval and the regression interval.
C)the interval for prediction of value and the interval for regression.
D)the interval for mean BMI and the prediction interval for food score 150.
Unlock Deck
Unlock for access to all 36 flashcards in this deck.
Unlock Deck
k this deck
36
Suppose we wish to predict the profits (in hundreds of thousands of dollars) for companies that had sales (in hundreds of thousands of dollars) of 500 units. We use statistical software to do the prediction and obtain the following output. A random sample of 19 companies from the Forbes 500 list was selected, and the relationship between sales (in hundreds of thousands of dollars) and profits (in hundreds of thousands of dollars) was investigated by regression. The following simple linear regression model was used: profits = + (sales), where the deviations were assumed to be independent and Normally distributed, with mean 0 and standard deviation . This model was fit to the data using the method of least squares. The following results were obtained from statistical software. r2 = 0.662
S = 466.2 A 95% interval for this prediction is:
A)-1066.4 to 805.6.
B)-248.5 to -12.3.
C)-189.7 to -71.1.
D)400.7 to 559.3.
A random sample of 19 companies from the Forbes 500 list was selected, and the relationship between sales (in hundreds of thousands of dollars) and profits (in hundreds of thousands of dollars) was investigated by regression. The following simple linear regression model was used: profits = + (sales), where the deviations were assumed to be independent and Normally distributed, with mean 0 and standard deviation . This model was fit to the data using the method of least squares. The following results were obtained from statistical software. r2 = 0.662S = 466.2
A 95% interval for this prediction is:A)-1066.4 to 805.6.
B)-248.5 to -12.3.
C)-189.7 to -71.1.
D)400.7 to 559.3.
Unlock Deck
Unlock for access to all 36 flashcards in this deck.
Unlock Deck
k this deck
Unlock Deck
Unlock for access to all 36 flashcards in this deck.


