Deck 19: Understanding Regression Residuals
Full screen (f)
Question
Data on Internet usage (per 100 inhabitants) and population were collected for a sample of 52 countries (United Nations database). The data resulted in the following scatterplot. 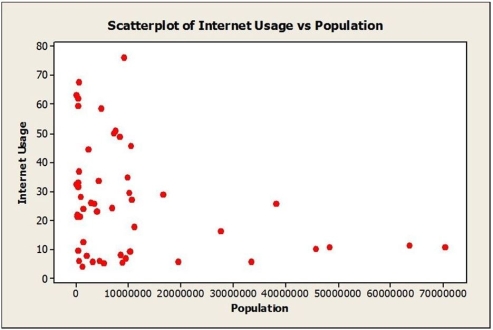 a. Do you think there is a clear pattern? Describe the association between Internet usage and population.
b. Comment on any unusual data point or points in the data set. Explain.
c. Do you think a model could accurately predict the Internet usage in India with a population of 1,339,346,874? Explain.
a. Do you think there is a clear pattern? Describe the association between Internet usage and population.b. Comment on any unusual data point or points in the data set. Explain.
c. Do you think a model could accurately predict the Internet usage in India with a population of 1,339,346,874? Explain.
Question
Data were collected for a sample of companies regarding their investment in quality improvement efforts and cost savings realized as a result (both measured as a percentage of sales revenue). Below is the scatterplot. 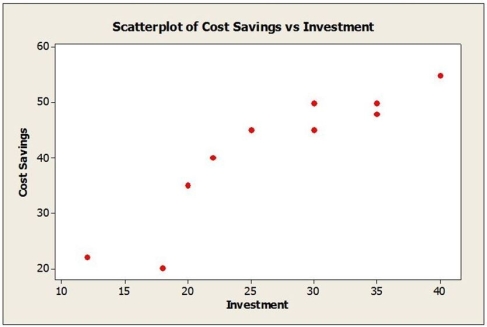 The correlation coefficient for these data is r = 0.913. If data were collected for individual departments within companies rather than at the company level, would you expect the correlation to be weaker, stronger or about the same? Explain.
The correlation coefficient for these data is r = 0.913. If data were collected for individual departments within companies rather than at the company level, would you expect the correlation to be weaker, stronger or about the same? Explain. Question
Monthly closing stock prices for a utility company were obtained from January 2014 through August 2015. A regression model was estimated to describe the trend in closing stock prices over time.
a. Based on the plot of residuals versus predicted values, is the linear model appropriate? Explain.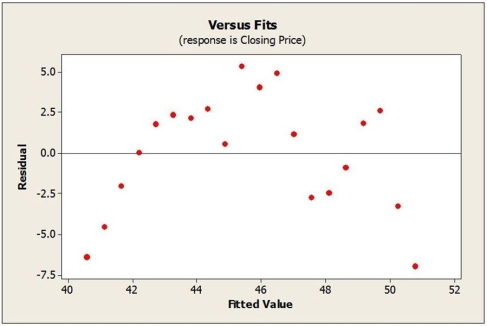 b. The Durbin-Watson statistic for the collected data was found to be 0.5626. What can you conclude from this statistic at the 0.01 level of significance?
a. Based on the plot of residuals versus predicted values, is the linear model appropriate? Explain.
b. The Durbin-Watson statistic for the collected data was found to be 0.5626. What can you conclude from this statistic at the 0.01 level of significance? Question
The following scatterplot shows the population of Canada plotted against 5 year intervals from 1970 through 2015.
a. Based on the scatterplot, is the linear model appropriate? Explain.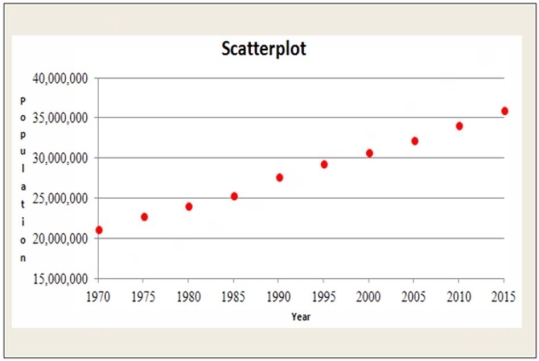 b. A linear regression model was estimated to describe the trend in the population of Canada over time. Examine the plot of Residuals against Year shown below. Is the association between Population and Year reasonably straight?
 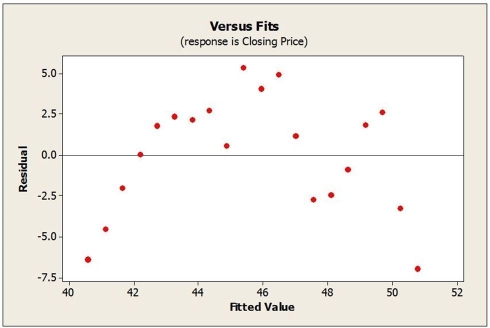 c. Would a re-expression of the data help? If so, what would you recommend?
a. Based on the scatterplot, is the linear model appropriate? Explain.
b. A linear regression model was estimated to describe the trend in the population of Canada over time. Examine the plot of Residuals against Year shown below. Is the association between Population and Year reasonably straight? c. Would a re-expression of the data help? If so, what would you recommend? Question
Quarterly sales figures for e-commerce retail sales were obtained from the first quarter of 2009 through the fourth quarter of 2015. A regression model was estimated to describe the trend in e-commerce retail sales over time.
a. Based on the plot of residuals versus predicted values, is the linear model appropriate? Explain.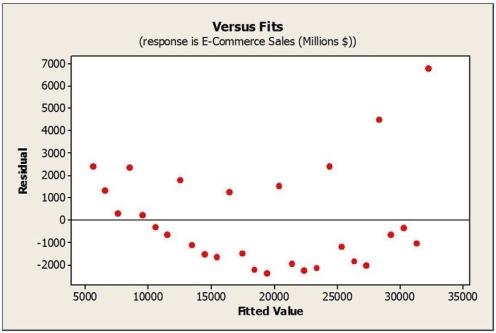 b. The Durbin-Watson statistic for this regression model was found to be 1.727. What can you conclude from this statistic at the 0.01 level of significance?
a. Based on the plot of residuals versus predicted values, is the linear model appropriate? Explain.
b. The Durbin-Watson statistic for this regression model was found to be 1.727. What can you conclude from this statistic at the 0.01 level of significance? Question
A food company launches an advertising campaign for a high fibre cereal and wants to claim that high fibre cereals are lower in calories. In order to research this claim, they obtain nutritional information for 34 breakfast cereals including the amount of fibre (in grams) and the number of calories per serving. The data resulted in the following scatterplot. 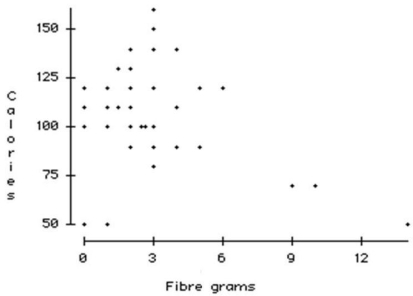 Which statement is true?
A) The points in the bottom right corner seem to be high-leverage points.
B) There is a strong positive association between amount of fibre and number of calories per serving.
C) As the amount of fibre increases so does the number of calories per serving.
D) There are no unusual observations.
E) Five points in the bottom part of the scatterplot have low numbers of calories. Thus, they cannot be influential points.
Which statement is true?A) The points in the bottom right corner seem to be high-leverage points.
B) There is a strong positive association between amount of fibre and number of calories per serving.
C) As the amount of fibre increases so does the number of calories per serving.
D) There are no unusual observations.
E) Five points in the bottom part of the scatterplot have low numbers of calories. Thus, they cannot be influential points.
Question
Consider the following to answer the question(s) below:
Monthly closing stock prices for a utility company were obtained from January 2014 through August 2015. A regression model was estimated to describe the trend in closing stock prices over time.
What does the plot of residuals above suggest?
A) An outlier is present in the data set.
B) The Linearity condition is not satisfied.
C) A high-leverage point is present in the data set.
D) Extrapolation was used.
E) There is no pattern. The relationship seems reasonably straight.
Question
Consider the following to answer the question(s) below:
Monthly closing stock prices for a utility company were obtained from January 2014 through August 2015. A regression model was estimated to describe the trend in closing stock prices over time.
Suppose that for the regression model estimated using the data described, the Durbin-Watson statistic was calculated as 0.5626. Using α = 0.01 we can conclude that
A) there is evidence of positive autocorrelation.
B) there is evidence of negative autocorrelation.
C) there is no evidence of positive autocorrelation.
D) there is no evidence of negative autocorrelation.
E) as dL < 0.5626 < dU, the test is inconclusive.
Question
Consider the following to answer the question(s) below:
Monthly closing stock prices for a utility company were obtained from January 2014 through August 2015. A regression model was estimated to describe the trend in closing stock prices over time.
Which of the following statement is true about autocorrelation?
A) We use autocorrelation to predict values of y for values x far from the ones used to find the linear model equation.
B) When a regression model applied to autocorrelated data, the Independence assumption is satisfied.
C) When data highly correlated over time, each data point is similar to those around it. The Independence assumption is violated.
D) We use χ2 statistic to test for autocorrelation.
E) Autocorrelation occurs only if there is at least one extreme outlier.
Question
Consider the following to answer the question(s) below:
Consider the following scatter diagram for 24 of the top grossing movies of all time. The data include the highest grossing films for which world box office receipts and budgets were available. The top two were Avatar and Titanic.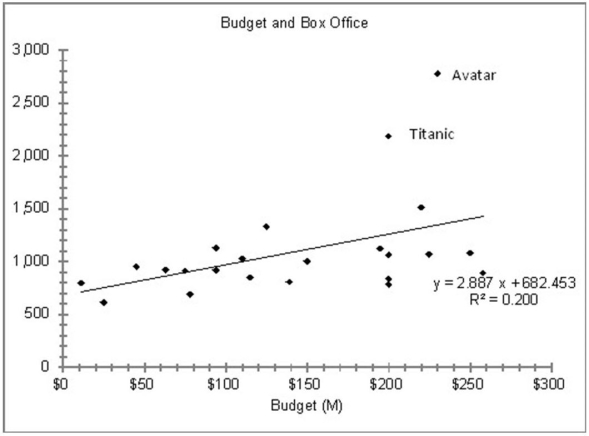
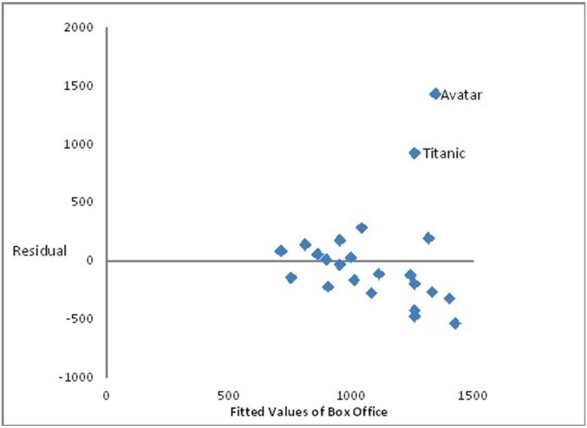
What does the plot of the residuals and the fitted values suggest?
A) The Equal Variance assumption is not satisfied.
B) The plot does not contain any evident outliers.
C) The Linearity condition is not satisfied.
D) There may be autocorrelation.
E) The plot does not fan out. Thus, the Equal Spread condition is satisfied.
Consider the following scatter diagram for 24 of the top grossing movies of all time. The data include the highest grossing films for which world box office receipts and budgets were available. The top two were Avatar and Titanic.
What does the plot of the residuals and the fitted values suggest?
A) The Equal Variance assumption is not satisfied.
B) The plot does not contain any evident outliers.
C) The Linearity condition is not satisfied.
D) There may be autocorrelation.
E) The plot does not fan out. Thus, the Equal Spread condition is satisfied.
Question
Consider the following to answer the question(s) below:
Consider the following scatter diagram for 24 of the top grossing movies of all time. The data include the highest grossing films for which world box office receipts and budgets were available. The top two were Avatar and Titanic.
Which statement is not true?
A) The scatterplot shows no unusual observations.
B) The data contain high-leverage points.
C) The data contain potential influential points.
D) The data contain points which are associated with large residuals.
E) We would consider setting aside outliers and re-running the regression.
Question
Quarterly figures for e-commerce retail sales were obtained from the first quarter of 2009 through the fourth quarter of 2015. A regression model was estimated to describe the trend in e-commerce retail sales over time. What does the plot of residuals versus predicted values suggest? 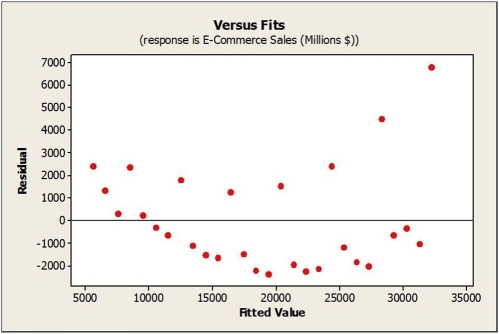
A) The relationship seems reasonably straight.
B) There is no reason to be alert for autocorrelation.
C) The Equal Spread condition is satisfied.
D) The Linearity condition is satisfied.
E) The Linearity condition is not satisfied, and the Equal Spread condition is not satisfied as well.
A) The relationship seems reasonably straight.
B) There is no reason to be alert for autocorrelation.
C) The Equal Spread condition is satisfied.
D) The Linearity condition is satisfied.
E) The Linearity condition is not satisfied, and the Equal Spread condition is not satisfied as well.
Question
A regression model was developed relating average annual pay to the percentage of women employed for a sample of companies. Below is the plot of residuals versus predicted values. 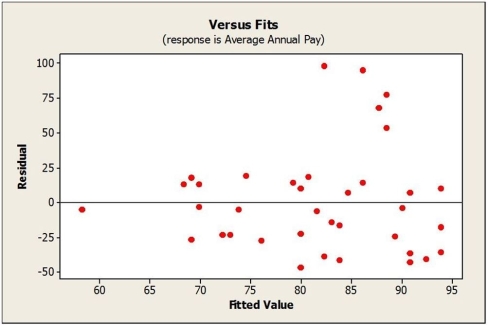 a. What can you see in the plot of residuals that may not have been clear in the original scatterplot of the data?
b. Would a re-expression of the data help? If so, what would you recommend?
a. What can you see in the plot of residuals that may not have been clear in the original scatterplot of the data?b. Would a re-expression of the data help? If so, what would you recommend?
Question
Consider the following to answer the question(s) below:
A regression model was developed relating average annual pay to the percentage of women employed for a sample of companies. Below is the plot of residuals versus predicted values.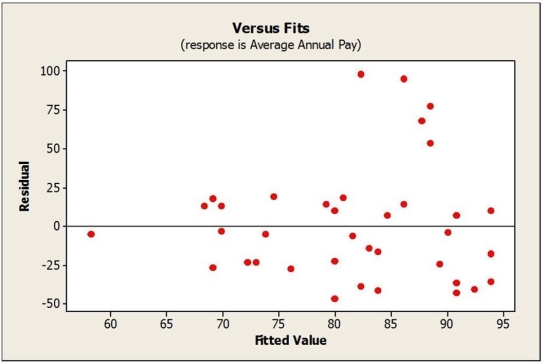
Which of the following re-expressions of the data would be appropriate?
A) Square the data values.
B) Cube the data values.
C) Use a logarithmic transformation.
D) Use a geometric transformation.
E) Only extrapolation would help.
Question
Question
A food company launches an advertising campaign for a high fibre cereal and wants to claim that high fibre cereals are lower in calories. In order to research this claim, they obtain nutritional information for 34 breakfast cereals including the amount of fibre (in grams) and the number of calories per serving. The data resulted in the following scatterplot.  a. Do you think there is a clear pattern? Describe the association between fibre and calories.
b. Comment on any unusual data point or points in the data set. Explain.
c. Do you think a model could accurately predict the number of calories in a serving of cereal that has 22 grams of fibre? Explain.
a. Do you think there is a clear pattern? Describe the association between fibre and calories.b. Comment on any unusual data point or points in the data set. Explain.
c. Do you think a model could accurately predict the number of calories in a serving of cereal that has 22 grams of fibre? Explain.
Question
Consider the following to answer the question(s) below:
Consider the following scatter diagram for 24 of the top grossing movies of all time. The data include the highest grossing films for which world box office receipts and budgets were available. The top two were Avatar and Titanic.
The effect of including the data for Avatar and Titanic is
A) making the value of the slope of the regression line larger.
B) making the value of the slope of the regression line smaller.
C) making the correlation between the two variables negative.
D) reducing the residual standard deviation.
E) making the regression line curvier.
Question
Suppose that data on labour productivity and unit labour costs were obtained for the retail industry from 1995 through 2014. A regression was estimated to describe the linear relationship between the two variables.
a. Based on the plot of residuals versus predicted values, is the linear model appropriate? Explain. b. Would a re-expression of the data help? If so, what would you recommend?
a. Based on the plot of residuals versus predicted values, is the linear model appropriate? Explain.
b. Would a re-expression of the data help? If so, what would you recommend? Question
Consider the following to answer the question(s) below:
A regression model was developed relating average annual pay to the percentage of women employed for a sample of companies. Below is the plot of residuals versus predicted values.
What does the plot of residuals suggest?
A) The plot of residuals shows no unusual pattern. The Equal Variance assumption is satisfied.
B) The plot of residuals has no particular structure. So, the Equal Spread condition is definitely satisfied.
C) The spread in the residuals decreases as the fitted value increases.
D) The residuals show that the plot thickens. The spread in the residuals increases as the fitted value increases. The equal spread condition is not satisfied.
E) The spread in the residuals remains unchanged as the fitted value increases. The Equal Spread condition is satisfied.
Question
Question
Question
Consider the following to answer the question(s) below:
Consider the following scatter diagram for 24 of the top grossing movies of all time. The data include the highest grossing films for which world box office receipts and budgets were available. The top two were Avatar and Titanic.
A new movie is in the making which has a budget of $350 million. Using the equation in the scatter diagram to predict sales we can say
A) that the prediction is based on autocorrelation.
B) that the prediction is very close to the actual value as it is based on the strong correlation.
C) that we should be cautious with a prediction such as this since it is beyond the range of the x-values; the prediction is an extrapolation.
D) that our prediction is trustworthy
E) that $350 million falls into the range of the x-values. So, we do not need to worry about extrapolation.
Question
Consider the following to answer the question(s) below:
The average monthly residential mortgage lending rate in Canada is available monthly beginning in 1951. A scatterplot of the residuals against time for 747 months from January 1951 to March 2013 is shown below. The rate peaked in September of 1981 at 21.46%.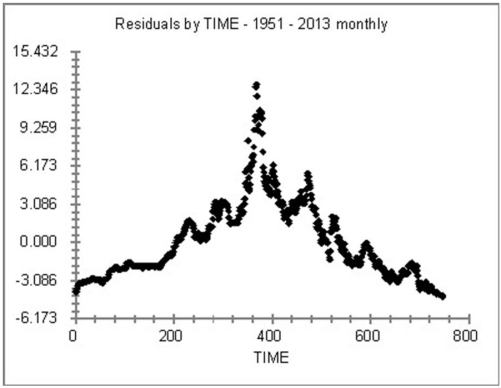 The Durbin-Watson statistic has a value of D = 0.01.
The critical values for the Durbin-Watson statistic for α = 0.05 and n = 750 are: dL= 1.87736 and dU = 1.88270. What does this tell us about the assumption of the independence of the errors?
A) The assumption of independent errors is violated.
B) The assumption of independent errors is not violated.
C) The errors are not related to one another over time.
D) Since D falls between the critical values, the test is inconclusive. So, we suppose that the errors are independent.
E) As D is very small, the errors are independent.
The average monthly residential mortgage lending rate in Canada is available monthly beginning in 1951. A scatterplot of the residuals against time for 747 months from January 1951 to March 2013 is shown below. The rate peaked in September of 1981 at 21.46%.
The Durbin-Watson statistic has a value of D = 0.01.The critical values for the Durbin-Watson statistic for α = 0.05 and n = 750 are: dL= 1.87736 and dU = 1.88270. What does this tell us about the assumption of the independence of the errors?
A) The assumption of independent errors is violated.
B) The assumption of independent errors is not violated.
C) The errors are not related to one another over time.
D) Since D falls between the critical values, the test is inconclusive. So, we suppose that the errors are independent.
E) As D is very small, the errors are independent.
Question
Consider the following to answer the question(s) below:
Consider the following scatter diagram for 24 of the top grossing movies of all time. The data include the highest grossing films for which world box office receipts and budgets were available. The top two were Avatar and Titanic.
The best practice for modelling this data set given the scatter plot would be
A) to estimate the model both including and excluding the data for Avatar and Titanic and then to compare the two regression models to understand how they differ.
B) to include the data for Avatar and Titanic and use the model without any doubt.
C) to exclude the data for Avatar and Titanic, construct the new model and use only new one.
D) to find different data that will measure box office success and perfectly fit to the given equation.
E) to use the given regression equation and treat Avatar and Titanic as extrapolation points.
Question
Consider the following to answer the question(s) below:
The average monthly residential mortgage lending rate in Canada is available monthly beginning in 1951. A scatterplot of the residuals against time for 747 months from January 1951 to March 2013 is shown below. The rate peaked in September of 1981 at 21.46%. The Durbin-Watson statistic has a value of D = 0.01.
What conclusion about autocorrelation in the model can we draw using the value of the Durbin-Watson statistic and the critical limits, dL=1.87736 and dU=1.88270?
A) There is evidence of positive autocorrelation.
B) There is evidence of negative autocorrelation.
C) There is no evidence of positive autocorrelation.
D) There is no evidence of negative autocorrelation.
E) As D falls between the critical values, the test is inconclusive.
The average monthly residential mortgage lending rate in Canada is available monthly beginning in 1951. A scatterplot of the residuals against time for 747 months from January 1951 to March 2013 is shown below. The rate peaked in September of 1981 at 21.46%.
The Durbin-Watson statistic has a value of D = 0.01.What conclusion about autocorrelation in the model can we draw using the value of the Durbin-Watson statistic and the critical limits, dL=1.87736 and dU=1.88270?
A) There is evidence of positive autocorrelation.
B) There is evidence of negative autocorrelation.
C) There is no evidence of positive autocorrelation.
D) There is no evidence of negative autocorrelation.
E) As D falls between the critical values, the test is inconclusive.
Question
Consider the following to answer the question(s) below:
Suppose that data on labour productivity and unit labour costs were obtained for the retail industry from 1995 through 2014. A regression was estimated to describe the linear relationship between the two variables.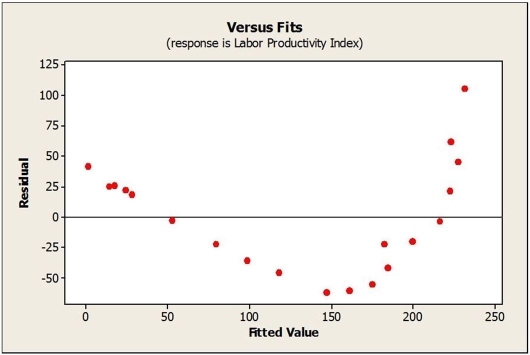
What does the plot of residuals suggest?
A) The plot shows curvature. So, the Equal Spread condition is not satisfied.
B) The residual plot has no clear pattern.
C) The Equal Variance assumption is met.
D) All assumption and condition for regression inference appear to be met.
E) As the given residual plot appears generally patternless, we can construct the linear regression model.
Question
Consider the following to answer the question(s) below:
Consider the following scatter diagram for 24 of the top grossing movies of all time. The data include the highest grossing films for which world box office receipts and budgets were available. The top two were Avatar and Titanic.
A new movie is in the making which has a budget of $350 million. What would the equation in the scatter diagram predict for its box office receipts?
A) $1,693 million
B) $2,388 million
C) $1,010 million
D) $328 million
E) $3,000 million
Question
Consider the following to answer the question(s) below:
Suppose that data on labour productivity and unit labour costs were obtained for the retail industry from 1995 through 2014. A regression was estimated to describe the linear relationship between the two variables.
Which of the following re-expressions of the data would be appropriate?
A) Use a logarithmic transformation.
B) Square the data.
C) Use a geometric transformation.
D) Take the square root of the data.
E) Take the reciprocal of the data.

Unlock Deck
Sign up to unlock the cards in this deck!
Unlock Deck
Unlock Deck
1/28
Play
Full screen (f)
Deck 19: Understanding Regression Residuals
1
Data on Internet usage (per 100 inhabitants) and population were collected for a sample of 52 countries (United Nations database). The data resulted in the following scatterplot. a. Do you think there is a clear pattern? Describe the association between Internet usage and population.
b. Comment on any unusual data point or points in the data set. Explain.
c. Do you think a model could accurately predict the Internet usage in India with a population of 1,339,346,874? Explain.
a. Do you think there is a clear pattern? Describe the association between Internet usage and population.b. Comment on any unusual data point or points in the data set. Explain.
c. Do you think a model could accurately predict the Internet usage in India with a population of 1,339,346,874? Explain.
a. There is no clear pattern. At first glance, there appears to be a weak, negative association between Internet usage and population because of the points at the bottom right of the graph representing countries with low Internet usage and large populations.
b. The points in the bottom right corner seem to have extremely low Internet usage for densely populated countries, making them outliers and influential points. These points would also be leverage points, creating the impression that there is a negative association between Internet usage and population.
c. It would be extrapolation to try to use this data to predict the Internet usage in India since its population is outside the range of population values in the data set. The predicted value would hardly be trustworthy.
2
Data were collected for a sample of companies regarding their investment in quality improvement efforts and cost savings realized as a result (both measured as a percentage of sales revenue). Below is the scatterplot. The correlation coefficient for these data is r = 0.913. If data were collected for individual departments within companies rather than at the company level, would you expect the correlation to be weaker, stronger or about the same? Explain.
The correlation coefficient for these data is r = 0.913. If data were collected for individual departments within companies rather than at the company level, would you expect the correlation to be weaker, stronger or about the same? Explain.Relationships based on averages have higher correlation coefficients than relationships based on individual data. Therefore, a scatterplot of the investment and cost savings of quality improvement efforts for individual departments would show much more scatter and a weaker correlation coefficient.
3
Monthly closing stock prices for a utility company were obtained from January 2014 through August 2015. A regression model was estimated to describe the trend in closing stock prices over time.
a. Based on the plot of residuals versus predicted values, is the linear model appropriate? Explain. b. The Durbin-Watson statistic for the collected data was found to be 0.5626. What can you conclude from this statistic at the 0.01 level of significance?
a. Based on the plot of residuals versus predicted values, is the linear model appropriate? Explain.
b. The Durbin-Watson statistic for the collected data was found to be 0.5626. What can you conclude from this statistic at the 0.01 level of significance?a. The residual plot shows a clear pattern and curvature. It appears that a linear model would not be appropriate.
b. At the 0.01 level of significance, dL = 0.95. Since 0.5626 is less than this value, we can conclude that there is evidence of positive autocorrelation.
b. At the 0.01 level of significance, dL = 0.95. Since 0.5626 is less than this value, we can conclude that there is evidence of positive autocorrelation.
4
The following scatterplot shows the population of Canada plotted against 5 year intervals from 1970 through 2015.
a. Based on the scatterplot, is the linear model appropriate? Explain. b. A linear regression model was estimated to describe the trend in the population of Canada over time. Examine the plot of Residuals against Year shown below. Is the association between Population and Year reasonably straight? c. Would a re-expression of the data help? If so, what would you recommend?
a. Based on the scatterplot, is the linear model appropriate? Explain.
b. A linear regression model was estimated to describe the trend in the population of Canada over time. Examine the plot of Residuals against Year shown below. Is the association between Population and Year reasonably straight? c. Would a re-expression of the data help? If so, what would you recommend? Unlock Deck
Unlock for access to all 28 flashcards in this deck.
Unlock Deck
k this deck
5
Quarterly sales figures for e-commerce retail sales were obtained from the first quarter of 2009 through the fourth quarter of 2015. A regression model was estimated to describe the trend in e-commerce retail sales over time.
a. Based on the plot of residuals versus predicted values, is the linear model appropriate? Explain. b. The Durbin-Watson statistic for this regression model was found to be 1.727. What can you conclude from this statistic at the 0.01 level of significance?
a. Based on the plot of residuals versus predicted values, is the linear model appropriate? Explain.
b. The Durbin-Watson statistic for this regression model was found to be 1.727. What can you conclude from this statistic at the 0.01 level of significance? Unlock Deck
Unlock for access to all 28 flashcards in this deck.
Unlock Deck
k this deck
6
A food company launches an advertising campaign for a high fibre cereal and wants to claim that high fibre cereals are lower in calories. In order to research this claim, they obtain nutritional information for 34 breakfast cereals including the amount of fibre (in grams) and the number of calories per serving. The data resulted in the following scatterplot. Which statement is true?
A) The points in the bottom right corner seem to be high-leverage points.
B) There is a strong positive association between amount of fibre and number of calories per serving.
C) As the amount of fibre increases so does the number of calories per serving.
D) There are no unusual observations.
E) Five points in the bottom part of the scatterplot have low numbers of calories. Thus, they cannot be influential points.
Which statement is true?A) The points in the bottom right corner seem to be high-leverage points.
B) There is a strong positive association between amount of fibre and number of calories per serving.
C) As the amount of fibre increases so does the number of calories per serving.
D) There are no unusual observations.
E) Five points in the bottom part of the scatterplot have low numbers of calories. Thus, they cannot be influential points.
Unlock Deck
Unlock for access to all 28 flashcards in this deck.
Unlock Deck
k this deck
7
Consider the following to answer the question(s) below:
Monthly closing stock prices for a utility company were obtained from January 2014 through August 2015. A regression model was estimated to describe the trend in closing stock prices over time.
What does the plot of residuals above suggest?
A) An outlier is present in the data set.
B) The Linearity condition is not satisfied.
C) A high-leverage point is present in the data set.
D) Extrapolation was used.
E) There is no pattern. The relationship seems reasonably straight.
Unlock Deck
Unlock for access to all 28 flashcards in this deck.
Unlock Deck
k this deck
8
Consider the following to answer the question(s) below:
Monthly closing stock prices for a utility company were obtained from January 2014 through August 2015. A regression model was estimated to describe the trend in closing stock prices over time.
Suppose that for the regression model estimated using the data described, the Durbin-Watson statistic was calculated as 0.5626. Using α = 0.01 we can conclude that
A) there is evidence of positive autocorrelation.
B) there is evidence of negative autocorrelation.
C) there is no evidence of positive autocorrelation.
D) there is no evidence of negative autocorrelation.
E) as dL < 0.5626 < dU, the test is inconclusive.
Unlock Deck
Unlock for access to all 28 flashcards in this deck.
Unlock Deck
k this deck
9
Consider the following to answer the question(s) below:
Monthly closing stock prices for a utility company were obtained from January 2014 through August 2015. A regression model was estimated to describe the trend in closing stock prices over time.
Which of the following statement is true about autocorrelation?
A) We use autocorrelation to predict values of y for values x far from the ones used to find the linear model equation.
B) When a regression model applied to autocorrelated data, the Independence assumption is satisfied.
C) When data highly correlated over time, each data point is similar to those around it. The Independence assumption is violated.
D) We use χ2 statistic to test for autocorrelation.
E) Autocorrelation occurs only if there is at least one extreme outlier.
Unlock Deck
Unlock for access to all 28 flashcards in this deck.
Unlock Deck
k this deck
10
Consider the following to answer the question(s) below:
Consider the following scatter diagram for 24 of the top grossing movies of all time. The data include the highest grossing films for which world box office receipts and budgets were available. The top two were Avatar and Titanic.
What does the plot of the residuals and the fitted values suggest?
A) The Equal Variance assumption is not satisfied.
B) The plot does not contain any evident outliers.
C) The Linearity condition is not satisfied.
D) There may be autocorrelation.
E) The plot does not fan out. Thus, the Equal Spread condition is satisfied.
Unlock Deck
Unlock for access to all 28 flashcards in this deck.
Unlock Deck
k this deck
11
Consider the following to answer the question(s) below:
Consider the following scatter diagram for 24 of the top grossing movies of all time. The data include the highest grossing films for which world box office receipts and budgets were available. The top two were Avatar and Titanic.
Which statement is not true?
A) The scatterplot shows no unusual observations.
B) The data contain high-leverage points.
C) The data contain potential influential points.
D) The data contain points which are associated with large residuals.
E) We would consider setting aside outliers and re-running the regression.
Unlock Deck
Unlock for access to all 28 flashcards in this deck.
Unlock Deck
k this deck
12
Quarterly figures for e-commerce retail sales were obtained from the first quarter of 2009 through the fourth quarter of 2015. A regression model was estimated to describe the trend in e-commerce retail sales over time. What does the plot of residuals versus predicted values suggest?
A) The relationship seems reasonably straight.
B) There is no reason to be alert for autocorrelation.
C) The Equal Spread condition is satisfied.
D) The Linearity condition is satisfied.
E) The Linearity condition is not satisfied, and the Equal Spread condition is not satisfied as well.
A) The relationship seems reasonably straight.
B) There is no reason to be alert for autocorrelation.
C) The Equal Spread condition is satisfied.
D) The Linearity condition is satisfied.
E) The Linearity condition is not satisfied, and the Equal Spread condition is not satisfied as well.
Unlock Deck
Unlock for access to all 28 flashcards in this deck.
Unlock Deck
k this deck
13
A regression model was developed relating average annual pay to the percentage of women employed for a sample of companies. Below is the plot of residuals versus predicted values. a. What can you see in the plot of residuals that may not have been clear in the original scatterplot of the data?
b. Would a re-expression of the data help? If so, what would you recommend?
a. What can you see in the plot of residuals that may not have been clear in the original scatterplot of the data?b. Would a re-expression of the data help? If so, what would you recommend?
Unlock Deck
Unlock for access to all 28 flashcards in this deck.
Unlock Deck
k this deck
14
Consider the following to answer the question(s) below:
A regression model was developed relating average annual pay to the percentage of women employed for a sample of companies. Below is the plot of residuals versus predicted values.
Which of the following re-expressions of the data would be appropriate?
A) Square the data values.
B) Cube the data values.
C) Use a logarithmic transformation.
D) Use a geometric transformation.
E) Only extrapolation would help.
Unlock Deck
Unlock for access to all 28 flashcards in this deck.
Unlock Deck
k this deck
15
Data were collected for a sample of companies regarding their investment in quality improvement efforts and cost savings realized as a result (both measured as a percentage of sales revenue). The correlation coefficient for these data is r = 0.913. If the data were collected for individual departments within companies rather than at the company level, we would expect
A) a stronger correlation.
B) a weaker correlation.
C) the same correlation.
D) fewer outliers in the data.
E) the correlation coefficient of 1.
A) a stronger correlation.
B) a weaker correlation.
C) the same correlation.
D) fewer outliers in the data.
E) the correlation coefficient of 1.
Unlock Deck
Unlock for access to all 28 flashcards in this deck.
Unlock Deck
k this deck
16
A food company launches an advertising campaign for a high fibre cereal and wants to claim that high fibre cereals are lower in calories. In order to research this claim, they obtain nutritional information for 34 breakfast cereals including the amount of fibre (in grams) and the number of calories per serving. The data resulted in the following scatterplot. a. Do you think there is a clear pattern? Describe the association between fibre and calories.
b. Comment on any unusual data point or points in the data set. Explain.
c. Do you think a model could accurately predict the number of calories in a serving of cereal that has 22 grams of fibre? Explain.
a. Do you think there is a clear pattern? Describe the association between fibre and calories.b. Comment on any unusual data point or points in the data set. Explain.
c. Do you think a model could accurately predict the number of calories in a serving of cereal that has 22 grams of fibre? Explain.
Unlock Deck
Unlock for access to all 28 flashcards in this deck.
Unlock Deck
k this deck
17
Consider the following to answer the question(s) below:
Consider the following scatter diagram for 24 of the top grossing movies of all time. The data include the highest grossing films for which world box office receipts and budgets were available. The top two were Avatar and Titanic.
The effect of including the data for Avatar and Titanic is
A) making the value of the slope of the regression line larger.
B) making the value of the slope of the regression line smaller.
C) making the correlation between the two variables negative.
D) reducing the residual standard deviation.
E) making the regression line curvier.
Unlock Deck
Unlock for access to all 28 flashcards in this deck.
Unlock Deck
k this deck
18
Suppose that data on labour productivity and unit labour costs were obtained for the retail industry from 1995 through 2014. A regression was estimated to describe the linear relationship between the two variables.
a. Based on the plot of residuals versus predicted values, is the linear model appropriate? Explain. b. Would a re-expression of the data help? If so, what would you recommend?
a. Based on the plot of residuals versus predicted values, is the linear model appropriate? Explain.
b. Would a re-expression of the data help? If so, what would you recommend? Unlock Deck
Unlock for access to all 28 flashcards in this deck.
Unlock Deck
k this deck
19
Consider the following to answer the question(s) below:
A regression model was developed relating average annual pay to the percentage of women employed for a sample of companies. Below is the plot of residuals versus predicted values.
What does the plot of residuals suggest?
A) The plot of residuals shows no unusual pattern. The Equal Variance assumption is satisfied.
B) The plot of residuals has no particular structure. So, the Equal Spread condition is definitely satisfied.
C) The spread in the residuals decreases as the fitted value increases.
D) The residuals show that the plot thickens. The spread in the residuals increases as the fitted value increases. The equal spread condition is not satisfied.
E) The spread in the residuals remains unchanged as the fitted value increases. The Equal Spread condition is satisfied.
Unlock Deck
Unlock for access to all 28 flashcards in this deck.
Unlock Deck
k this deck
20
Quarterly figures for e-commerce retail sales were obtained from the first quarter of 2009 through the fourth quarter of 2015. A regression model was estimated to describe the trend in e-commerce retail sales over time. Suppose that for the regression model estimated using the data described, the Durbin-Watson statistic was calculated as 1.727. Using α = 0.01 we can conclude that
A) there is evidence of positive autocorrelation.
B) there is evidence of negative autocorrelation.
C) there is no evidence of positive or negative autocorrelation.
D) since 1.727 is greater than upper critical value, there is evidence of an outlier.
E) as dL < 1.727 < dU, the test is inconclusive.
A) there is evidence of positive autocorrelation.
B) there is evidence of negative autocorrelation.
C) there is no evidence of positive or negative autocorrelation.
D) since 1.727 is greater than upper critical value, there is evidence of an outlier.
E) as dL < 1.727 < dU, the test is inconclusive.
Unlock Deck
Unlock for access to all 28 flashcards in this deck.
Unlock Deck
k this deck
21
After transforming data, a model of retail sales of furniture and fixtures in Canada on value of building permits yielded the following equation: log10 (Sales) = 2.33 + 0.57 log10 (Value of permits)
What is the predicted value of retail sales if the value of building permits is $700,000?
A) $458,887.14
B) $5.66
C) $2,137.96
D) $3.33
E) $22,060.33
What is the predicted value of retail sales if the value of building permits is $700,000?
A) $458,887.14
B) $5.66
C) $2,137.96
D) $3.33
E) $22,060.33
Unlock Deck
Unlock for access to all 28 flashcards in this deck.
Unlock Deck
k this deck
22
Consider the following to answer the question(s) below:
Consider the following scatter diagram for 24 of the top grossing movies of all time. The data include the highest grossing films for which world box office receipts and budgets were available. The top two were Avatar and Titanic.
A new movie is in the making which has a budget of $350 million. Using the equation in the scatter diagram to predict sales we can say
A) that the prediction is based on autocorrelation.
B) that the prediction is very close to the actual value as it is based on the strong correlation.
C) that we should be cautious with a prediction such as this since it is beyond the range of the x-values; the prediction is an extrapolation.
D) that our prediction is trustworthy
E) that $350 million falls into the range of the x-values. So, we do not need to worry about extrapolation.
Unlock Deck
Unlock for access to all 28 flashcards in this deck.
Unlock Deck
k this deck
23
Consider the following to answer the question(s) below:
The average monthly residential mortgage lending rate in Canada is available monthly beginning in 1951. A scatterplot of the residuals against time for 747 months from January 1951 to March 2013 is shown below. The rate peaked in September of 1981 at 21.46%. The Durbin-Watson statistic has a value of D = 0.01.
The critical values for the Durbin-Watson statistic for α = 0.05 and n = 750 are: dL= 1.87736 and dU = 1.88270. What does this tell us about the assumption of the independence of the errors?
A) The assumption of independent errors is violated.
B) The assumption of independent errors is not violated.
C) The errors are not related to one another over time.
D) Since D falls between the critical values, the test is inconclusive. So, we suppose that the errors are independent.
E) As D is very small, the errors are independent.
The average monthly residential mortgage lending rate in Canada is available monthly beginning in 1951. A scatterplot of the residuals against time for 747 months from January 1951 to March 2013 is shown below. The rate peaked in September of 1981 at 21.46%.
The Durbin-Watson statistic has a value of D = 0.01.The critical values for the Durbin-Watson statistic for α = 0.05 and n = 750 are: dL= 1.87736 and dU = 1.88270. What does this tell us about the assumption of the independence of the errors?
A) The assumption of independent errors is violated.
B) The assumption of independent errors is not violated.
C) The errors are not related to one another over time.
D) Since D falls between the critical values, the test is inconclusive. So, we suppose that the errors are independent.
E) As D is very small, the errors are independent.
Unlock Deck
Unlock for access to all 28 flashcards in this deck.
Unlock Deck
k this deck
24
Consider the following to answer the question(s) below:
Consider the following scatter diagram for 24 of the top grossing movies of all time. The data include the highest grossing films for which world box office receipts and budgets were available. The top two were Avatar and Titanic.
The best practice for modelling this data set given the scatter plot would be
A) to estimate the model both including and excluding the data for Avatar and Titanic and then to compare the two regression models to understand how they differ.
B) to include the data for Avatar and Titanic and use the model without any doubt.
C) to exclude the data for Avatar and Titanic, construct the new model and use only new one.
D) to find different data that will measure box office success and perfectly fit to the given equation.
E) to use the given regression equation and treat Avatar and Titanic as extrapolation points.
Unlock Deck
Unlock for access to all 28 flashcards in this deck.
Unlock Deck
k this deck
25
Consider the following to answer the question(s) below:
The average monthly residential mortgage lending rate in Canada is available monthly beginning in 1951. A scatterplot of the residuals against time for 747 months from January 1951 to March 2013 is shown below. The rate peaked in September of 1981 at 21.46%. The Durbin-Watson statistic has a value of D = 0.01.
What conclusion about autocorrelation in the model can we draw using the value of the Durbin-Watson statistic and the critical limits, dL=1.87736 and dU=1.88270?
A) There is evidence of positive autocorrelation.
B) There is evidence of negative autocorrelation.
C) There is no evidence of positive autocorrelation.
D) There is no evidence of negative autocorrelation.
E) As D falls between the critical values, the test is inconclusive.
The average monthly residential mortgage lending rate in Canada is available monthly beginning in 1951. A scatterplot of the residuals against time for 747 months from January 1951 to March 2013 is shown below. The rate peaked in September of 1981 at 21.46%.
The Durbin-Watson statistic has a value of D = 0.01.What conclusion about autocorrelation in the model can we draw using the value of the Durbin-Watson statistic and the critical limits, dL=1.87736 and dU=1.88270?
A) There is evidence of positive autocorrelation.
B) There is evidence of negative autocorrelation.
C) There is no evidence of positive autocorrelation.
D) There is no evidence of negative autocorrelation.
E) As D falls between the critical values, the test is inconclusive.
Unlock Deck
Unlock for access to all 28 flashcards in this deck.
Unlock Deck
k this deck
26
Consider the following to answer the question(s) below:
Suppose that data on labour productivity and unit labour costs were obtained for the retail industry from 1995 through 2014. A regression was estimated to describe the linear relationship between the two variables.
What does the plot of residuals suggest?
A) The plot shows curvature. So, the Equal Spread condition is not satisfied.
B) The residual plot has no clear pattern.
C) The Equal Variance assumption is met.
D) All assumption and condition for regression inference appear to be met.
E) As the given residual plot appears generally patternless, we can construct the linear regression model.
Unlock Deck
Unlock for access to all 28 flashcards in this deck.
Unlock Deck
k this deck
27
Consider the following to answer the question(s) below:
Consider the following scatter diagram for 24 of the top grossing movies of all time. The data include the highest grossing films for which world box office receipts and budgets were available. The top two were Avatar and Titanic.
A new movie is in the making which has a budget of $350 million. What would the equation in the scatter diagram predict for its box office receipts?
A) $1,693 million
B) $2,388 million
C) $1,010 million
D) $328 million
E) $3,000 million
Unlock Deck
Unlock for access to all 28 flashcards in this deck.
Unlock Deck
k this deck
28
Consider the following to answer the question(s) below:
Suppose that data on labour productivity and unit labour costs were obtained for the retail industry from 1995 through 2014. A regression was estimated to describe the linear relationship between the two variables.
Which of the following re-expressions of the data would be appropriate?
A) Use a logarithmic transformation.
B) Square the data.
C) Use a geometric transformation.
D) Take the square root of the data.
E) Take the reciprocal of the data.
Unlock Deck
Unlock for access to all 28 flashcards in this deck.
Unlock Deck
k this deck
Unlock Deck
Unlock for access to all 28 flashcards in this deck.


