Exam 19: Understanding Regression Residuals
Exam 2: Data30 Questions
Exam 3: Surveys and Sampling28 Questions
Exam 4: Displaying and Describing Categorical Data32 Questions
Exam 5: Displaying and Describing Quantitative Data32 Questions
Exam 6: Scatterplots, Association, and Correlation32 Questions
Exam 7: Introduction to Linear Regression32 Questions
Exam 8: Randomness and Probability32 Questions
Exam 9: Random Variables and Probability Distributions28 Questions
Exam 10: Sampling Distributions28 Questions
Exam 11: Confidence Intervals for Proportions32 Questions
Exam 12: Testing Hypotheses About Proportions36 Questions
Exam 13: Confidence Intervals and Hypothesis Tests for Means36 Questions
Exam 14: Comparing Two Means32 Questions
Exam 15: Design of Experiments and Analysis of Variance Anova24 Questions
Exam 16: Inference for Counts: Chi-Square Tests26 Questions
Exam 17: Nonparametric Methods26 Questions
Exam 18: Inference for Regression32 Questions
Exam 19: Understanding Regression Residuals28 Questions
Exam 20: Multiple Regression22 Questions
Exam 21: Building Multiple Regression Models22 Questions
Exam 22: Time Series Analysis28 Questions
Exam 23: Decision Making and Risk32 Questions
Exam 24: Quality Control28 Questions
Exam 25: Exploring and Collecting Data32 Questions
Exam 26: Understanding Probability Distributions and Statistical Inference73 Questions
Exam 27: Exploring Relationships Among Variables40 Questions
Exam 28: Using Statistics for Decision Making26 Questions
Select questions type
A regression model was developed relating average annual pay to the percentage of women employed for a sample of companies. Below is the plot of residuals versus predicted values. 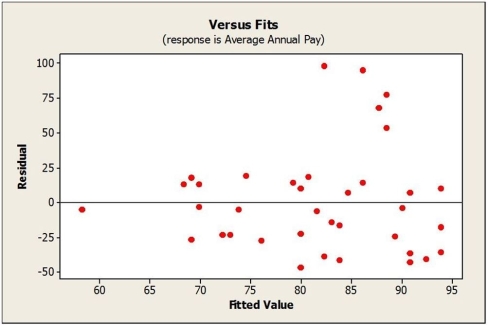 a. What can you see in the plot of residuals that may not have been clear in the original scatterplot of the data?
b. Would a re-expression of the data help? If so, what would you recommend?
a. What can you see in the plot of residuals that may not have been clear in the original scatterplot of the data?
b. Would a re-expression of the data help? If so, what would you recommend?
Free
(Essay)
4.8/5  (30)
(30)
Correct Answer: Verified
a. The residuals show that the plot thickens. The spread in the residuals increases as the fitted value increases.
b. Yes. A logarithmic transformation might be an appropriate re-expression of the data.
Consider the following to answer the question(s) below:
Suppose that data on labour productivity and unit labour costs were obtained for the retail industry from 1995 through 2014. A regression was estimated to describe the linear relationship between the two variables. 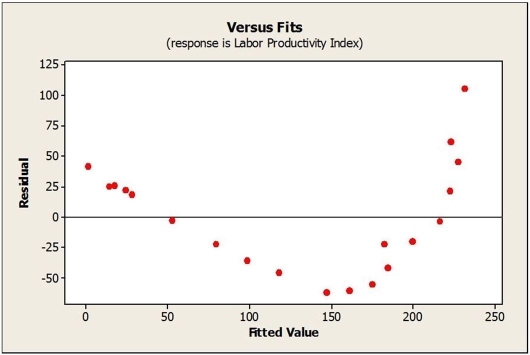 -What does the plot of residuals suggest?
Free
(Multiple Choice)
4.9/5 (34)
Correct Answer:Verified
A
Consider the following to answer the question(s) below:
A regression model was developed relating average annual pay to the percentage of women employed for a sample of companies. Below is the plot of residuals versus predicted values. 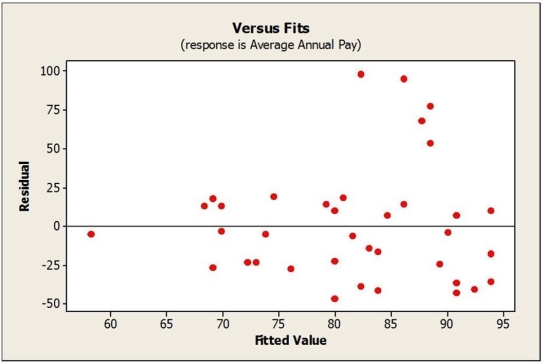 -Which of the following re-expressions of the data would be appropriate?
Free
(Multiple Choice)
4.8/5 (37)
Correct Answer:Verified
C
Consider the following to answer the question(s) below:
Consider the following scatter diagram for 24 of the top grossing movies of all time. The data include the highest grossing films for which world box office receipts and budgets were available. The top two were Avatar and Titanic. 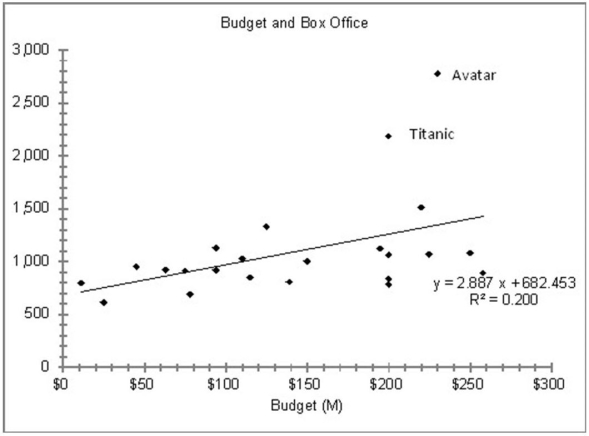
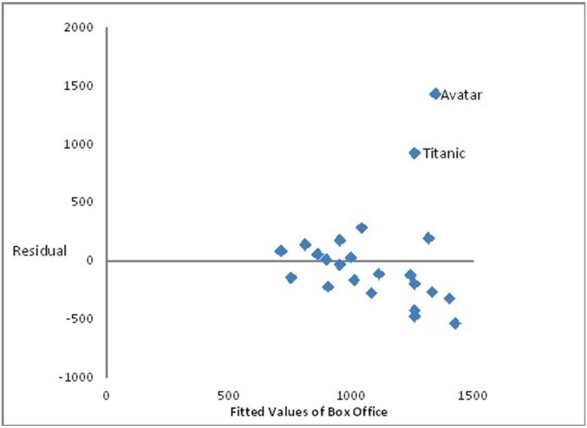 -The effect of including the data for Avatar and Titanic is
(Multiple Choice)
4.7/5 (29)
The following scatterplot shows the population of Canada plotted against 5 year intervals from 1970 through 2015.
a. Based on the scatterplot, is the linear model appropriate? Explain. 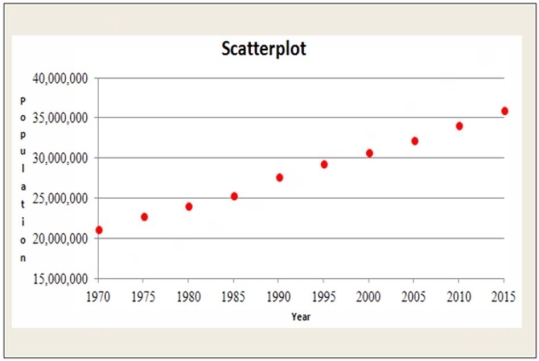 b. A linear regression model was estimated to describe the trend in the population of Canada over time. Examine the plot of Residuals against Year shown below. Is the association between Population and Year reasonably straight?
 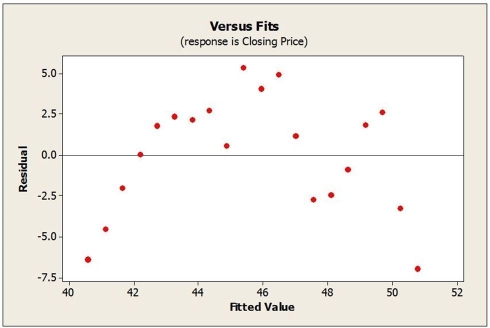 c. Would a re-expression of the data help? If so, what would you recommend?
(Essay)
4.8/5 (33)
Data were collected for a sample of companies regarding their investment in quality improvement efforts and cost savings realized as a result (both measured as a percentage of sales revenue). Below is the scatterplot.  The correlation coefficient for these data is r = 0.913. If data were collected for individual departments within companies rather than at the company level, would you expect the correlation to be weaker, stronger or about the same? Explain.
(Essay)
4.7/5 (38)
A food company launches an advertising campaign for a high fibre cereal and wants to claim that high fibre cereals are lower in calories. In order to research this claim, they obtain nutritional information for 34 breakfast cereals including the amount of fibre (in grams) and the number of calories per serving. The data resulted in the following scatterplot. 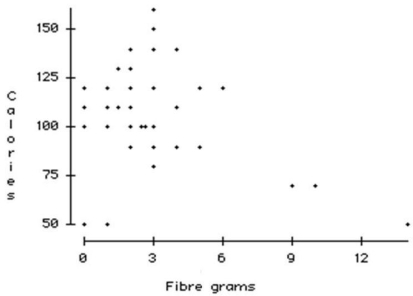 Which statement is true?
(Multiple Choice)
4.7/5 (30)
Consider the following to answer the question(s) below:
Monthly closing stock prices for a utility company were obtained from January 2014 through August 2015. A regression model was estimated to describe the trend in closing stock prices over time.  -Suppose that for the regression model estimated using the data described, the Durbin-Watson statistic was calculated as 0.5626. Using α = 0.01 we can conclude that
(Multiple Choice)
4.9/5 (38)
Data on Internet usage (per 100 inhabitants) and population were collected for a sample of 52 countries (United Nations database). The data resulted in the following scatterplot. 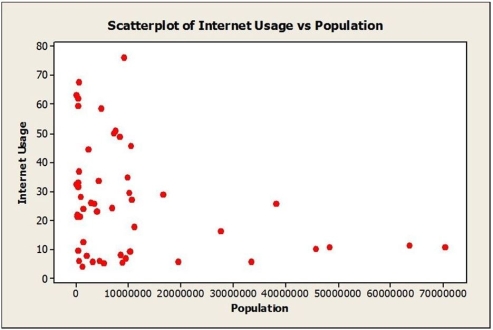 a. Do you think there is a clear pattern? Describe the association between Internet usage and population.
b. Comment on any unusual data point or points in the data set. Explain.
c. Do you think a model could accurately predict the Internet usage in India with a population of 1,339,346,874? Explain.
a. Do you think there is a clear pattern? Describe the association between Internet usage and population.
b. Comment on any unusual data point or points in the data set. Explain.
c. Do you think a model could accurately predict the Internet usage in India with a population of 1,339,346,874? Explain.
(Essay)
4.9/5 (36)
Consider the following to answer the question(s) below:
The average monthly residential mortgage lending rate in Canada is available monthly beginning in 1951. A scatterplot of the residuals against time for 747 months from January 1951 to March 2013 is shown below. The rate peaked in September of 1981 at 21.46%. 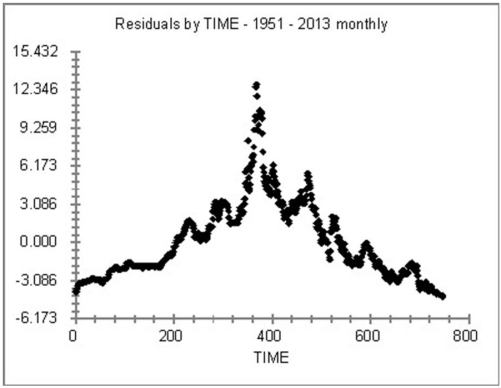 The Durbin-Watson statistic has a value of D = 0.01.
-What conclusion about autocorrelation in the model can we draw using the value of the Durbin-Watson statistic and the critical limits, dL=1.87736 and dU=1.88270?
The Durbin-Watson statistic has a value of D = 0.01.
-What conclusion about autocorrelation in the model can we draw using the value of the Durbin-Watson statistic and the critical limits, dL=1.87736 and dU=1.88270?
(Multiple Choice)
4.8/5 (36)
Consider the following to answer the question(s) below:
The average monthly residential mortgage lending rate in Canada is available monthly beginning in 1951. A scatterplot of the residuals against time for 747 months from January 1951 to March 2013 is shown below. The rate peaked in September of 1981 at 21.46%. The Durbin-Watson statistic has a value of D = 0.01.
-The critical values for the Durbin-Watson statistic for α = 0.05 and n = 750 are: dL= 1.87736 and dU = 1.88270. What does this tell us about the assumption of the independence of the errors?
(Multiple Choice)
4.8/5 (38)
Consider the following to answer the question(s) below:
A regression model was developed relating average annual pay to the percentage of women employed for a sample of companies. Below is the plot of residuals versus predicted values.
-What does the plot of residuals suggest?
(Multiple Choice)
4.9/5 (39)
Monthly closing stock prices for a utility company were obtained from January 2014 through August 2015. A regression model was estimated to describe the trend in closing stock prices over time.
a. Based on the plot of residuals versus predicted values, is the linear model appropriate? Explain. 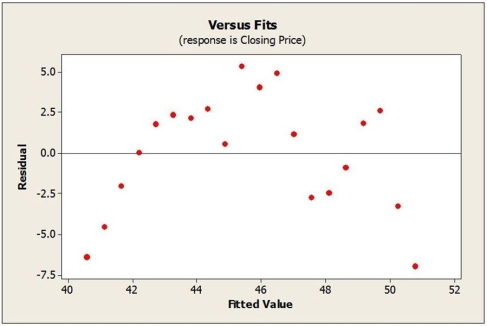 b. The Durbin-Watson statistic for the collected data was found to be 0.5626. What can you conclude from this statistic at the 0.01 level of significance?
(Essay)
4.8/5 (40)
Consider the following to answer the question(s) below:
Monthly closing stock prices for a utility company were obtained from January 2014 through August 2015. A regression model was estimated to describe the trend in closing stock prices over time.
-What does the plot of residuals above suggest?
(Multiple Choice)
4.9/5 (36)
Suppose that data on labour productivity and unit labour costs were obtained for the retail industry from 1995 through 2014. A regression was estimated to describe the linear relationship between the two variables.
a. Based on the plot of residuals versus predicted values, is the linear model appropriate? Explain.  b. Would a re-expression of the data help? If so, what would you recommend?
(Essay)
4.8/5 (36)
Quarterly figures for e-commerce retail sales were obtained from the first quarter of 2009 through the fourth quarter of 2015. A regression model was estimated to describe the trend in e-commerce retail sales over time. Suppose that for the regression model estimated using the data described, the Durbin-Watson statistic was calculated as 1.727. Using α = 0.01 we can conclude that
(Multiple Choice)
4.8/5 (43)
Consider the following to answer the question(s) below:
Consider the following scatter diagram for 24 of the top grossing movies of all time. The data include the highest grossing films for which world box office receipts and budgets were available. The top two were Avatar and Titanic.
-Which statement is not true?
(Multiple Choice)
4.8/5 (25)
Consider the following to answer the question(s) below:
Suppose that data on labour productivity and unit labour costs were obtained for the retail industry from 1995 through 2014. A regression was estimated to describe the linear relationship between the two variables.
-Which of the following re-expressions of the data would be appropriate?
(Multiple Choice)
4.8/5 (36)
Quarterly figures for e-commerce retail sales were obtained from the first quarter of 2009 through the fourth quarter of 2015. A regression model was estimated to describe the trend in e-commerce retail sales over time. What does the plot of residuals versus predicted values suggest? 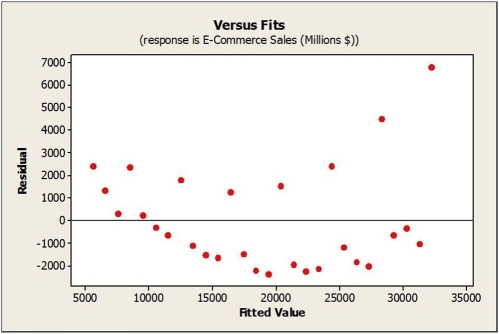
(Multiple Choice)
4.9/5 (33)
Data were collected for a sample of companies regarding their investment in quality improvement efforts and cost savings realized as a result (both measured as a percentage of sales revenue). The correlation coefficient for these data is r = 0.913. If the data were collected for individual departments within companies rather than at the company level, we would expect
(Multiple Choice)
5.0/5 (38)
Filters
- Essay(0)
- Multiple Choice(0)
- Short Answer(0)
- True False(0)
- Matching(0)