Deck 4: Displaying and Describing Categorical Data
Full screen (f)
Question
Consider the following to answer the question(s) below:
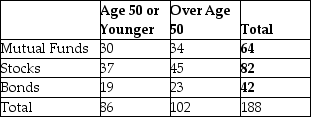
A full service brokerage firm gathered information on how their clients were investing for retirement. Based on age, clients were categorized according to where the largest percentage of their retirement portfolio was invested. The table below summarized the data.
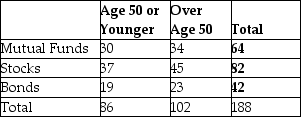
What is the marginal distribution of age?
A full service brokerage firm gathered information on how their clients were investing for retirement. Based on age, clients were categorized according to where the largest percentage of their retirement portfolio was invested. The table below summarized the data.
What is the marginal distribution of age?
Question
Consider the following to answer the question(s) below:
A full service brokerage firm gathered information on how their clients were investing for retirement. Based on age, clients were categorized according to where the largest percentage of their retirement portfolio was invested and shown in the table below.
The percentage of clients who are over age 50 and invest in mutual funds is
A) 53.1% (34/64).
B) 33.3% (34/102).
C) 18.1% (34/188).
D) 34.0% (64/188).
E) 54.3% (102/188).
Question
Consider the following to answer the question(s) below:
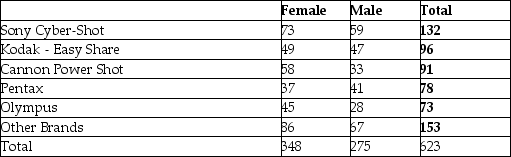
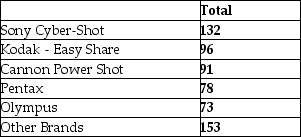
A large national retailer of electronics conducted a survey to determine consumer preferences for various brands of digital cameras. The table summarizes responses by brand and gender.
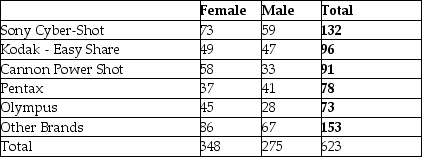
What is the marginal distribution of brands?
A large national retailer of electronics conducted a survey to determine consumer preferences for various brands of digital cameras. The table summarizes responses by brand and gender.
What is the marginal distribution of brands?
Question
Consider the following to answer the question(s) below:
A full service brokerage firm gathered information on how their clients were investing for retirement. Based on age, clients were categorized according to where the largest percentage of their retirement portfolio was invested. The table below summarized the data.
Prepare an appropriate chart to display the marginal distribution of age.
Question
Consider the following to answer the question(s) below:
A large national retailer of electronics conducted a survey to determine consumer preferences for various brands of digital cameras. The table summarizes responses by brand and gender.
Here is the side-by-side bar chart for these data.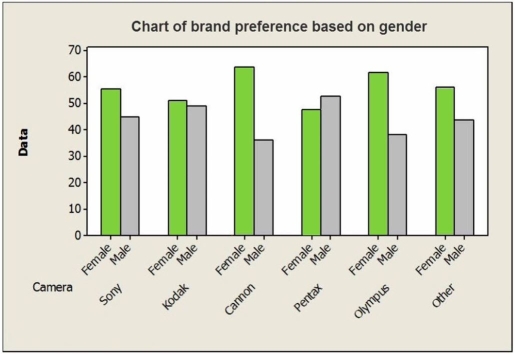 Which of the following statements is true?
A) It appears that camera preference and gender are not related.
B) It appears that camera preference and gender are not independent.
C) It appears that camera preference and gender are independent.
D) More males than females prefer Cannon.
E) More females than males prefer Pentax.
A large national retailer of electronics conducted a survey to determine consumer preferences for various brands of digital cameras. The table summarizes responses by brand and gender.
Here is the side-by-side bar chart for these data.
Which of the following statements is true?A) It appears that camera preference and gender are not related.
B) It appears that camera preference and gender are not independent.
C) It appears that camera preference and gender are independent.
D) More males than females prefer Cannon.
E) More females than males prefer Pentax.
Question
Consider the following to answer the question(s) below:
A large national retailer of electronics conducted a survey to determine consumer preferences for various brands of digital cameras. The table summarizes responses by brand and gender.
Of the consumers who prefer Canon, what percentage is female?
A) 63.74% (58/91)
B) 16.67% (58/348)
C) 9.31% (58/623)
D) 14.61% (91/623)
E) 55.86% (348/623)
Question
Consider the following to answer the question(s) below:
A large national retailer of electronics conducted a survey to determine consumer preferences for various brands of digital cameras. The table summarizes responses by brand and gender.
Of the consumers who are male, the percentage who prefer Pentax is
A) 44.1% (275/623).
B) 6.6% (41/623).
C) 52.6% (41/78).
D) 14.9% (41/275).
E) 12.5% (78/623).
Question
Consider the following to answer the question(s) below:
A full service brokerage firm gathered information on how their clients were investing for retirement. Based on age, clients were categorized according to where the largest percentage of their retirement portfolio was invested. The table below summarized the data.
Find each of the following percentages.
a. What percentage of the clients invest in mutual funds and are over age 50?
b. What percentage of clients over age 50 invest in mutual funds?
c. What percentage of the mutual fund investors are over age 50?
Question
Consider the following to answer the question(s) below:
A large national retailer of electronics conducted a survey to determine consumer preferences for various brands of digital cameras. The table summarizes responses by brand and gender.
Identify the variables and tell whether each is categorical or quantitative.
A large national retailer of electronics conducted a survey to determine consumer preferences for various brands of digital cameras. The table summarizes responses by brand and gender.
Identify the variables and tell whether each is categorical or quantitative.
Question
Consider the following to answer the question(s) below:
A full service brokerage firm gathered information on how their clients were investing for retirement. Based on age, clients were categorized according to where the largest percentage of their retirement portfolio was invested. The table below summarized the data.
Consider the following side-by-side bar chart for the data below: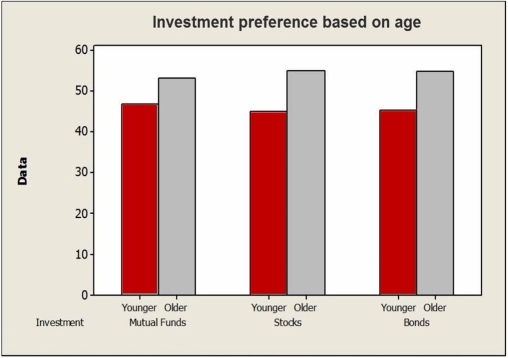 Does the chart indicate that mode of investment is independent of age? Explain.
A full service brokerage firm gathered information on how their clients were investing for retirement. Based on age, clients were categorized according to where the largest percentage of their retirement portfolio was invested. The table below summarized the data.
Consider the following side-by-side bar chart for the data below:
Does the chart indicate that mode of investment is independent of age? Explain. Question
Consider the following to answer the question(s) below:
A large national retailer of electronics conducted a survey to determine consumer preferences for various brands of digital cameras. The table summarizes responses by brand and gender.
Prepare an appropriate chart to display the marginal distribution of brands.
A large national retailer of electronics conducted a survey to determine consumer preferences for various brands of digital cameras. The table summarizes responses by brand and gender.
Prepare an appropriate chart to display the marginal distribution of brands.
Question
Consider the following to answer the question(s) below:
A large national retailer of electronics conducted a survey to determine consumer preferences for various brands of digital cameras. The table summarizes responses by brand and gender.
The following bar chart for these data shows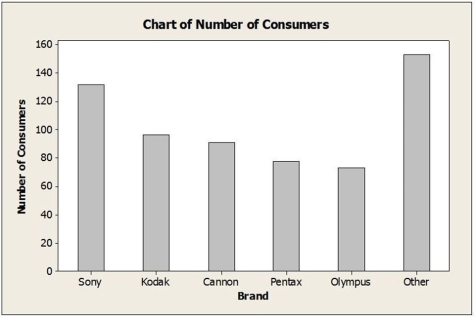
A) the marginal distribution of brands.
B) the conditional distribution of brands.
C) the marginal distribution of gender.
D) the conditional distribution of gender.
E) the joint distribution of brands and gender.
Question
Consider the following to answer the question(s) below:
A full service brokerage firm gathered information on how their clients were investing for retirement. Based on age, clients were categorized according to where the largest percentage of their retirement portfolio was invested. The table below summarized the data.
Write a sentence or two about the conditional relative frequency distribution of mode of investment for clients age 50 or younger.
Question
Consider the following to answer the question(s) below:
A large national retailer of electronics conducted a survey to determine consumer preferences for various brands of digital cameras. The table summarizes responses by brand and gender.
Write a sentence or two about the conditional relative frequency distribution of the brands among female respondents.
Question
Consider the following to answer the question(s) below:
A large national retailer of electronics conducted a survey to determine consumer preferences for various brands of digital cameras. The table summarizes responses by brand and gender.
Consider the following side-by-side bar chart for the data: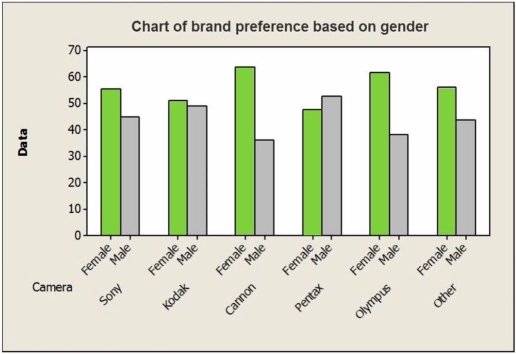 Does the chart indicate that brand preference is independent of gender? Explain.
A large national retailer of electronics conducted a survey to determine consumer preferences for various brands of digital cameras. The table summarizes responses by brand and gender.
Consider the following side-by-side bar chart for the data:
Does the chart indicate that brand preference is independent of gender? Explain. Question
Consider the following to answer the question(s) below:
A large national retailer of electronics conducted a survey to determine consumer preferences for various brands of digital cameras. The table summarizes responses by brand and gender.
Of the consumers who are female, the percentage who prefer Canon is
A) 63.74% (58/91).
B) 16.67% (58/348).
C) 9.31% (58/623).
D) 14.61% (91/623).
E) 55.86% (348/623).
Question
Consider the following to answer the question(s) below:
A large national retailer of electronics conducted a survey to determine consumer preferences for various brands of digital cameras. The table summarizes responses by brand and gender.
The percentage of consumers who are male and prefer Pentax is
A) 44.1% (275/623).
B) 6.6% (41/623).
C) 52.6% (41/78).
D) 14.9% (41/275).
E) 12.5% (78/623).
Question
Consider the following to answer the question(s) below:
A large national retailer of electronics conducted a survey to determine consumer preferences for various brands of digital cameras. The table summarizes responses by brand and gender.
Find each of the following percentages.
a. What percentage of the responses were males who prefer Pentax?
b. What percentage of the male responses prefer Pentax?
c. What percentage of the consumers who chose Pentax were males?
Question
Consider the following to answer the question(s) below:
A large national retailer of electronics conducted a survey to determine consumer preferences for various brands of digital cameras. The table summarizes responses by brand and gender.
Of the consumers who prefer Pentax, what percentage is male?
A) 44.1% (275/623)
B) 6.6% (41/623)
C) 52.6% (41/78)
D) 14.9% (41/275)
E) 12.5% (78/623)
Question
Consider the following to answer the question(s) below:
A full service brokerage firm gathered information on how their clients were investing for retirement. Based on age, clients were categorized according to where the largest percentage of their retirement portfolio was invested. The table below summarized the data.
Identify the variables and tell whether each is categorical or quantitative.
Question
Consider the following to answer the question(s) below:
The option to buy extended warranties is commonplace with most electronics purchases. Does the type of purchase affect a consumer's willingness to pay extra for an extended warranty? Data for 420 consumers who purchased digital cameras and laptop computers from a leading electronics retailer are summarized in the table.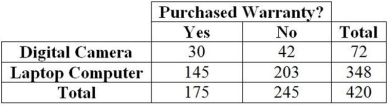
Of those who bought a digital camera, the percentage of those who purchased the warranty is
A) 41.67% (30/72).
B) 17.14% (72/420).
C) 7.14% (30/420).
D) 41.14% (72/175).
E) 12.24% (30/245).
Question
Consider the following to answer the question(s) below:
A full service brokerage firm gathered information on how their clients were investing for retirement. Based on age, clients were categorized according to where the largest percentage of their retirement portfolio was invested and shown in the table below.
Of the clients who invest in mutual funds, the percentage over age 50 is
A) 53.1% (34/64).
B) 33.3% (34/102).
C) 18.1% (34/188).
D) 34.0% (64/188).
E) 54.3% (102/188).
Question
Consider the following to answer the question(s) below:
A full service brokerage firm gathered information on how their clients were investing for retirement. Based on age, clients were categorized according to where the largest percentage of their retirement portfolio was invested and shown in the table below.
A contingency table is used to display
A) the count for each possible joint occurrence of two variables.
B) the cumulative frequency of two variables.
C) the cumulative distribution of a variable with two possible outcomes.
D) the relative frequency of one variable.
E) the relative frequency of nominal variable only.
Question
Consider the following to answer the question(s) below:
The option to buy extended warranties is commonplace with most electronics purchases. Does the type of purchase affect a consumer's willingness to pay extra for an extended warranty? Data for 420 consumers who purchased digital cameras and laptop computers from a leading electronics retailer are summarized in the table.
Of those who made a purchase, the percentage of those who chose the warranty is
A) 41.67% (175/420).
B) 7.14% (30/420).
C) 17.14% (30/175).
D) 82.86% (145/175).
E) 71.43% (175/245).
Question
Consider the following to answer the question(s) below:
A full service brokerage firm gathered information on how their clients were investing for retirement. Based on age, clients were categorized according to where the largest percentage of their retirement portfolio was invested and shown in the table below.
The city council has just voted to pass the budget for next year. If you were writing a report describing the budget so the citizens could understand how the total tax dollars will be spent, and you decided to show each category of expenses as a bar, which of the following graphs would be most appropriate?
A) segmented bar chart
B) scatter plot
C) bar chart
D) side-by-side bar chart
E) pie chart
Question
Consider the following to answer the question(s) below:
A full service brokerage firm gathered information on how their clients were investing for retirement. Based on age, clients were categorized according to where the largest percentage of their retirement portfolio was invested and shown in the table below.
The pie chart below for these data shows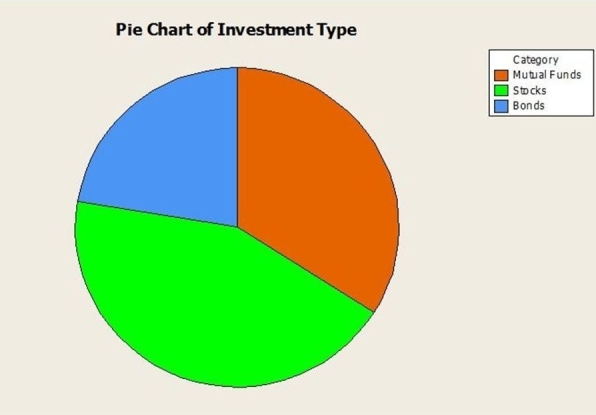
A) the marginal distribution of client age.
B) the conditional distribution of client age.
C) the conditional distribution of investment type.
D) the marginal distribution of investment type.
E) the joint distribution of client age and investment type.
Question
Consider the following to answer the question(s) below:
A full service brokerage firm gathered information on how their clients were investing for retirement. Based on age, clients were categorized according to where the largest percentage of their retirement portfolio was invested and shown in the table below.
The city council has just voted to pass the budget for next year. If you were writing a report describing the budget so the citizens could understand how the total tax dollars will be spent, and you decided to show each category of expenses as a wedge of a circle, which of the following graphs would be most appropriate?
A) segmented bar chart
B) scatter plot
C) bar chart
D) side-by-side bar chart
E) pie chart
Question
Consider the following to answer the question(s) below:
A full service brokerage firm gathered information on how their clients were investing for retirement. Based on age, clients were categorized according to where the largest percentage of their retirement portfolio was invested and shown in the table below.
Of the clients over age 50, the percentage who invest in mutual funds is
A) 53.1% (34/64).
B) 33.3% (34/102).
C) 18.1% (34/188).
D) 34.0% (64/188).
E) 54.3% (102/188).
Question
Consider the following to answer the question(s) below:
The option to buy extended warranties is commonplace with most electronics purchases. Does the type of purchase affect a consumer's willingness to pay extra for an extended warranty? Data for 420 consumers who purchased digital cameras and laptop computers from a leading electronics retailer are summarized in the table.
Of the consumers who bought the extended warranty, what percentage purchased a digital camera?
A) 41.67% (175/420)
B) 7.14% (30/420)
C) 17.14% (30/175)
D) 82.86% (145/175)
E) 71.43% (175/245)
Question
Consider the following to answer the question(s) below:
A full service brokerage firm gathered information on how their clients were investing for retirement. Based on age, clients were categorized according to where the largest percentage of their retirement portfolio was invested and shown in the table below.
The percentage of clients over age 50 is
A) 53.1% (34/64).
B) 33.3% (34/102).
C) 18.1% (34/188).
D) 34.0% (64/188).
E) 54.3% (102/188).
Question
Consider the following to answer the question(s) below:
A full service brokerage firm gathered information on how their clients were investing for retirement. Based on age, clients were categorized according to where the largest percentage of their retirement portfolio was invested and shown in the table below.
A study was recently done in which the brand preference for coffee was analyzed against the gender of the shopper. The study consisted of 200 male shoppers and 300 female shoppers. Three different coffee brands were considered: A, B, and C. A total of 250 female shoppers preferred brand A and 25 female shoppers preferred brand C. A total of 125 male shoppers preferred brand B and 50 male shoppers preferred brand C. What percentage of those who preferred brand B were female shoppers?
A) 5.0% (25/500)
B) 8.3% (25/300)
C) 16.7% (25/150)
D) 30.0% (150/500)
E) 50.0% (150/300)
Question
Consider the following to answer the question(s) below:
A full service brokerage firm gathered information on how their clients were investing for retirement. Based on age, clients were categorized according to where the largest percentage of their retirement portfolio was invested and shown in the table below.
One characteristic of a bar chart is
A) The bars can be displayed either vertically or horizontally.
B) There can be no gaps between the bars.
C) The bars should be of different widths.
D) It is used to display the distribution of a continuous variable.
E) It shows cumulative frequency.

Unlock Deck
Sign up to unlock the cards in this deck!
Unlock Deck
Unlock Deck
1/32
Play
Full screen (f)
Deck 4: Displaying and Describing Categorical Data
1
Consider the following to answer the question(s) below:
A full service brokerage firm gathered information on how their clients were investing for retirement. Based on age, clients were categorized according to where the largest percentage of their retirement portfolio was invested. The table below summarized the data.
What is the marginal distribution of age?
86 clients are age 50 or younger and 102 are over age 50.
2
Consider the following to answer the question(s) below:
A full service brokerage firm gathered information on how their clients were investing for retirement. Based on age, clients were categorized according to where the largest percentage of their retirement portfolio was invested and shown in the table below.
The percentage of clients who are over age 50 and invest in mutual funds is
A) 53.1% (34/64).
B) 33.3% (34/102).
C) 18.1% (34/188).
D) 34.0% (64/188).
E) 54.3% (102/188).
18.1% (34/188).
3
Consider the following to answer the question(s) below:
A large national retailer of electronics conducted a survey to determine consumer preferences for various brands of digital cameras. The table summarizes responses by brand and gender.
What is the marginal distribution of brands?
A large national retailer of electronics conducted a survey to determine consumer preferences for various brands of digital cameras. The table summarizes responses by brand and gender.
What is the marginal distribution of brands?
4
Consider the following to answer the question(s) below:
A full service brokerage firm gathered information on how their clients were investing for retirement. Based on age, clients were categorized according to where the largest percentage of their retirement portfolio was invested. The table below summarized the data.
Prepare an appropriate chart to display the marginal distribution of age.
Unlock Deck
Unlock for access to all 32 flashcards in this deck.
Unlock Deck
k this deck
5
Consider the following to answer the question(s) below:
A large national retailer of electronics conducted a survey to determine consumer preferences for various brands of digital cameras. The table summarizes responses by brand and gender.
Here is the side-by-side bar chart for these data. Which of the following statements is true?
A) It appears that camera preference and gender are not related.
B) It appears that camera preference and gender are not independent.
C) It appears that camera preference and gender are independent.
D) More males than females prefer Cannon.
E) More females than males prefer Pentax.
A large national retailer of electronics conducted a survey to determine consumer preferences for various brands of digital cameras. The table summarizes responses by brand and gender.
Here is the side-by-side bar chart for these data.
Which of the following statements is true?A) It appears that camera preference and gender are not related.
B) It appears that camera preference and gender are not independent.
C) It appears that camera preference and gender are independent.
D) More males than females prefer Cannon.
E) More females than males prefer Pentax.
Unlock Deck
Unlock for access to all 32 flashcards in this deck.
Unlock Deck
k this deck
6
Consider the following to answer the question(s) below:
A large national retailer of electronics conducted a survey to determine consumer preferences for various brands of digital cameras. The table summarizes responses by brand and gender.
Of the consumers who prefer Canon, what percentage is female?
A) 63.74% (58/91)
B) 16.67% (58/348)
C) 9.31% (58/623)
D) 14.61% (91/623)
E) 55.86% (348/623)
Unlock Deck
Unlock for access to all 32 flashcards in this deck.
Unlock Deck
k this deck
7
Consider the following to answer the question(s) below:
A large national retailer of electronics conducted a survey to determine consumer preferences for various brands of digital cameras. The table summarizes responses by brand and gender.
Of the consumers who are male, the percentage who prefer Pentax is
A) 44.1% (275/623).
B) 6.6% (41/623).
C) 52.6% (41/78).
D) 14.9% (41/275).
E) 12.5% (78/623).
Unlock Deck
Unlock for access to all 32 flashcards in this deck.
Unlock Deck
k this deck
8
Consider the following to answer the question(s) below:
A full service brokerage firm gathered information on how their clients were investing for retirement. Based on age, clients were categorized according to where the largest percentage of their retirement portfolio was invested. The table below summarized the data.
Find each of the following percentages.
a. What percentage of the clients invest in mutual funds and are over age 50?
b. What percentage of clients over age 50 invest in mutual funds?
c. What percentage of the mutual fund investors are over age 50?
Unlock Deck
Unlock for access to all 32 flashcards in this deck.
Unlock Deck
k this deck
9
Consider the following to answer the question(s) below:
A large national retailer of electronics conducted a survey to determine consumer preferences for various brands of digital cameras. The table summarizes responses by brand and gender.
Identify the variables and tell whether each is categorical or quantitative.
A large national retailer of electronics conducted a survey to determine consumer preferences for various brands of digital cameras. The table summarizes responses by brand and gender.
Identify the variables and tell whether each is categorical or quantitative.
Unlock Deck
Unlock for access to all 32 flashcards in this deck.
Unlock Deck
k this deck
10
Consider the following to answer the question(s) below:
A full service brokerage firm gathered information on how their clients were investing for retirement. Based on age, clients were categorized according to where the largest percentage of their retirement portfolio was invested. The table below summarized the data.
Consider the following side-by-side bar chart for the data below: Does the chart indicate that mode of investment is independent of age? Explain.
A full service brokerage firm gathered information on how their clients were investing for retirement. Based on age, clients were categorized according to where the largest percentage of their retirement portfolio was invested. The table below summarized the data.
Consider the following side-by-side bar chart for the data below:
Does the chart indicate that mode of investment is independent of age? Explain. Unlock Deck
Unlock for access to all 32 flashcards in this deck.
Unlock Deck
k this deck
11
Consider the following to answer the question(s) below:
A large national retailer of electronics conducted a survey to determine consumer preferences for various brands of digital cameras. The table summarizes responses by brand and gender.
Prepare an appropriate chart to display the marginal distribution of brands.
A large national retailer of electronics conducted a survey to determine consumer preferences for various brands of digital cameras. The table summarizes responses by brand and gender.
Prepare an appropriate chart to display the marginal distribution of brands.
Unlock Deck
Unlock for access to all 32 flashcards in this deck.
Unlock Deck
k this deck
12
Consider the following to answer the question(s) below:
A large national retailer of electronics conducted a survey to determine consumer preferences for various brands of digital cameras. The table summarizes responses by brand and gender.
The following bar chart for these data shows
A) the marginal distribution of brands.
B) the conditional distribution of brands.
C) the marginal distribution of gender.
D) the conditional distribution of gender.
E) the joint distribution of brands and gender.
Unlock Deck
Unlock for access to all 32 flashcards in this deck.
Unlock Deck
k this deck
13
Consider the following to answer the question(s) below:
A full service brokerage firm gathered information on how their clients were investing for retirement. Based on age, clients were categorized according to where the largest percentage of their retirement portfolio was invested. The table below summarized the data.
Write a sentence or two about the conditional relative frequency distribution of mode of investment for clients age 50 or younger.
Unlock Deck
Unlock for access to all 32 flashcards in this deck.
Unlock Deck
k this deck
14
Consider the following to answer the question(s) below:
A large national retailer of electronics conducted a survey to determine consumer preferences for various brands of digital cameras. The table summarizes responses by brand and gender.
Write a sentence or two about the conditional relative frequency distribution of the brands among female respondents.
Unlock Deck
Unlock for access to all 32 flashcards in this deck.
Unlock Deck
k this deck
15
Consider the following to answer the question(s) below:
A large national retailer of electronics conducted a survey to determine consumer preferences for various brands of digital cameras. The table summarizes responses by brand and gender.
Consider the following side-by-side bar chart for the data: Does the chart indicate that brand preference is independent of gender? Explain.
A large national retailer of electronics conducted a survey to determine consumer preferences for various brands of digital cameras. The table summarizes responses by brand and gender.
Consider the following side-by-side bar chart for the data:
Does the chart indicate that brand preference is independent of gender? Explain. Unlock Deck
Unlock for access to all 32 flashcards in this deck.
Unlock Deck
k this deck
16
Consider the following to answer the question(s) below:
A large national retailer of electronics conducted a survey to determine consumer preferences for various brands of digital cameras. The table summarizes responses by brand and gender.
Of the consumers who are female, the percentage who prefer Canon is
A) 63.74% (58/91).
B) 16.67% (58/348).
C) 9.31% (58/623).
D) 14.61% (91/623).
E) 55.86% (348/623).
Unlock Deck
Unlock for access to all 32 flashcards in this deck.
Unlock Deck
k this deck
17
Consider the following to answer the question(s) below:
A large national retailer of electronics conducted a survey to determine consumer preferences for various brands of digital cameras. The table summarizes responses by brand and gender.
The percentage of consumers who are male and prefer Pentax is
A) 44.1% (275/623).
B) 6.6% (41/623).
C) 52.6% (41/78).
D) 14.9% (41/275).
E) 12.5% (78/623).
Unlock Deck
Unlock for access to all 32 flashcards in this deck.
Unlock Deck
k this deck
18
Consider the following to answer the question(s) below:
A large national retailer of electronics conducted a survey to determine consumer preferences for various brands of digital cameras. The table summarizes responses by brand and gender.
Find each of the following percentages.
a. What percentage of the responses were males who prefer Pentax?
b. What percentage of the male responses prefer Pentax?
c. What percentage of the consumers who chose Pentax were males?
Unlock Deck
Unlock for access to all 32 flashcards in this deck.
Unlock Deck
k this deck
19
Consider the following to answer the question(s) below:
A large national retailer of electronics conducted a survey to determine consumer preferences for various brands of digital cameras. The table summarizes responses by brand and gender.
Of the consumers who prefer Pentax, what percentage is male?
A) 44.1% (275/623)
B) 6.6% (41/623)
C) 52.6% (41/78)
D) 14.9% (41/275)
E) 12.5% (78/623)
Unlock Deck
Unlock for access to all 32 flashcards in this deck.
Unlock Deck
k this deck
20
Consider the following to answer the question(s) below:
A full service brokerage firm gathered information on how their clients were investing for retirement. Based on age, clients were categorized according to where the largest percentage of their retirement portfolio was invested. The table below summarized the data.
Identify the variables and tell whether each is categorical or quantitative.
Unlock Deck
Unlock for access to all 32 flashcards in this deck.
Unlock Deck
k this deck
21
Consider the following to answer the question(s) below:
The option to buy extended warranties is commonplace with most electronics purchases. Does the type of purchase affect a consumer's willingness to pay extra for an extended warranty? Data for 420 consumers who purchased digital cameras and laptop computers from a leading electronics retailer are summarized in the table.
Of those who bought a digital camera, the percentage of those who purchased the warranty is
A) 41.67% (30/72).
B) 17.14% (72/420).
C) 7.14% (30/420).
D) 41.14% (72/175).
E) 12.24% (30/245).
Unlock Deck
Unlock for access to all 32 flashcards in this deck.
Unlock Deck
k this deck
22
Consider the following to answer the question(s) below:
A full service brokerage firm gathered information on how their clients were investing for retirement. Based on age, clients were categorized according to where the largest percentage of their retirement portfolio was invested and shown in the table below.
Of the clients who invest in mutual funds, the percentage over age 50 is
A) 53.1% (34/64).
B) 33.3% (34/102).
C) 18.1% (34/188).
D) 34.0% (64/188).
E) 54.3% (102/188).
Unlock Deck
Unlock for access to all 32 flashcards in this deck.
Unlock Deck
k this deck
23
Consider the following to answer the question(s) below:
A full service brokerage firm gathered information on how their clients were investing for retirement. Based on age, clients were categorized according to where the largest percentage of their retirement portfolio was invested and shown in the table below.
A contingency table is used to display
A) the count for each possible joint occurrence of two variables.
B) the cumulative frequency of two variables.
C) the cumulative distribution of a variable with two possible outcomes.
D) the relative frequency of one variable.
E) the relative frequency of nominal variable only.
Unlock Deck
Unlock for access to all 32 flashcards in this deck.
Unlock Deck
k this deck
24
Consider the following to answer the question(s) below:
The option to buy extended warranties is commonplace with most electronics purchases. Does the type of purchase affect a consumer's willingness to pay extra for an extended warranty? Data for 420 consumers who purchased digital cameras and laptop computers from a leading electronics retailer are summarized in the table.
Of those who made a purchase, the percentage of those who chose the warranty is
A) 41.67% (175/420).
B) 7.14% (30/420).
C) 17.14% (30/175).
D) 82.86% (145/175).
E) 71.43% (175/245).
Unlock Deck
Unlock for access to all 32 flashcards in this deck.
Unlock Deck
k this deck
25
Consider the following to answer the question(s) below:
A full service brokerage firm gathered information on how their clients were investing for retirement. Based on age, clients were categorized according to where the largest percentage of their retirement portfolio was invested and shown in the table below.
The city council has just voted to pass the budget for next year. If you were writing a report describing the budget so the citizens could understand how the total tax dollars will be spent, and you decided to show each category of expenses as a bar, which of the following graphs would be most appropriate?
A) segmented bar chart
B) scatter plot
C) bar chart
D) side-by-side bar chart
E) pie chart
Unlock Deck
Unlock for access to all 32 flashcards in this deck.
Unlock Deck
k this deck
26
Consider the following to answer the question(s) below:
A full service brokerage firm gathered information on how their clients were investing for retirement. Based on age, clients were categorized according to where the largest percentage of their retirement portfolio was invested and shown in the table below.
The pie chart below for these data shows
A) the marginal distribution of client age.
B) the conditional distribution of client age.
C) the conditional distribution of investment type.
D) the marginal distribution of investment type.
E) the joint distribution of client age and investment type.
Unlock Deck
Unlock for access to all 32 flashcards in this deck.
Unlock Deck
k this deck
27
Consider the following to answer the question(s) below:
A full service brokerage firm gathered information on how their clients were investing for retirement. Based on age, clients were categorized according to where the largest percentage of their retirement portfolio was invested and shown in the table below.
The city council has just voted to pass the budget for next year. If you were writing a report describing the budget so the citizens could understand how the total tax dollars will be spent, and you decided to show each category of expenses as a wedge of a circle, which of the following graphs would be most appropriate?
A) segmented bar chart
B) scatter plot
C) bar chart
D) side-by-side bar chart
E) pie chart
Unlock Deck
Unlock for access to all 32 flashcards in this deck.
Unlock Deck
k this deck
28
Consider the following to answer the question(s) below:
A full service brokerage firm gathered information on how their clients were investing for retirement. Based on age, clients were categorized according to where the largest percentage of their retirement portfolio was invested and shown in the table below.
Of the clients over age 50, the percentage who invest in mutual funds is
A) 53.1% (34/64).
B) 33.3% (34/102).
C) 18.1% (34/188).
D) 34.0% (64/188).
E) 54.3% (102/188).
Unlock Deck
Unlock for access to all 32 flashcards in this deck.
Unlock Deck
k this deck
29
Consider the following to answer the question(s) below:
The option to buy extended warranties is commonplace with most electronics purchases. Does the type of purchase affect a consumer's willingness to pay extra for an extended warranty? Data for 420 consumers who purchased digital cameras and laptop computers from a leading electronics retailer are summarized in the table.
Of the consumers who bought the extended warranty, what percentage purchased a digital camera?
A) 41.67% (175/420)
B) 7.14% (30/420)
C) 17.14% (30/175)
D) 82.86% (145/175)
E) 71.43% (175/245)
Unlock Deck
Unlock for access to all 32 flashcards in this deck.
Unlock Deck
k this deck
30
Consider the following to answer the question(s) below:
A full service brokerage firm gathered information on how their clients were investing for retirement. Based on age, clients were categorized according to where the largest percentage of their retirement portfolio was invested and shown in the table below.
The percentage of clients over age 50 is
A) 53.1% (34/64).
B) 33.3% (34/102).
C) 18.1% (34/188).
D) 34.0% (64/188).
E) 54.3% (102/188).
Unlock Deck
Unlock for access to all 32 flashcards in this deck.
Unlock Deck
k this deck
31
Consider the following to answer the question(s) below:
A full service brokerage firm gathered information on how their clients were investing for retirement. Based on age, clients were categorized according to where the largest percentage of their retirement portfolio was invested and shown in the table below.
A study was recently done in which the brand preference for coffee was analyzed against the gender of the shopper. The study consisted of 200 male shoppers and 300 female shoppers. Three different coffee brands were considered: A, B, and C. A total of 250 female shoppers preferred brand A and 25 female shoppers preferred brand C. A total of 125 male shoppers preferred brand B and 50 male shoppers preferred brand C. What percentage of those who preferred brand B were female shoppers?
A) 5.0% (25/500)
B) 8.3% (25/300)
C) 16.7% (25/150)
D) 30.0% (150/500)
E) 50.0% (150/300)
Unlock Deck
Unlock for access to all 32 flashcards in this deck.
Unlock Deck
k this deck
32
Consider the following to answer the question(s) below:
A full service brokerage firm gathered information on how their clients were investing for retirement. Based on age, clients were categorized according to where the largest percentage of their retirement portfolio was invested and shown in the table below.
One characteristic of a bar chart is
A) The bars can be displayed either vertically or horizontally.
B) There can be no gaps between the bars.
C) The bars should be of different widths.
D) It is used to display the distribution of a continuous variable.
E) It shows cumulative frequency.
Unlock Deck
Unlock for access to all 32 flashcards in this deck.
Unlock Deck
k this deck
Unlock Deck
Unlock for access to all 32 flashcards in this deck.


