Exam 4: Displaying and Describing Categorical Data
Exam 2: Data30 Questions
Exam 3: Surveys and Sampling28 Questions
Exam 4: Displaying and Describing Categorical Data32 Questions
Exam 5: Displaying and Describing Quantitative Data32 Questions
Exam 6: Scatterplots, Association, and Correlation32 Questions
Exam 7: Introduction to Linear Regression32 Questions
Exam 8: Randomness and Probability32 Questions
Exam 9: Random Variables and Probability Distributions28 Questions
Exam 10: Sampling Distributions28 Questions
Exam 11: Confidence Intervals for Proportions32 Questions
Exam 12: Testing Hypotheses About Proportions36 Questions
Exam 13: Confidence Intervals and Hypothesis Tests for Means36 Questions
Exam 14: Comparing Two Means32 Questions
Exam 15: Design of Experiments and Analysis of Variance Anova24 Questions
Exam 16: Inference for Counts: Chi-Square Tests26 Questions
Exam 17: Nonparametric Methods26 Questions
Exam 18: Inference for Regression32 Questions
Exam 19: Understanding Regression Residuals28 Questions
Exam 20: Multiple Regression22 Questions
Exam 21: Building Multiple Regression Models22 Questions
Exam 22: Time Series Analysis28 Questions
Exam 23: Decision Making and Risk32 Questions
Exam 24: Quality Control28 Questions
Exam 25: Exploring and Collecting Data32 Questions
Exam 26: Understanding Probability Distributions and Statistical Inference73 Questions
Exam 27: Exploring Relationships Among Variables40 Questions
Exam 28: Using Statistics for Decision Making26 Questions
Select questions type
Consider the following to answer the question(s) below:
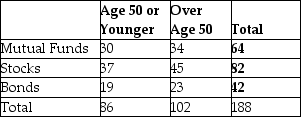
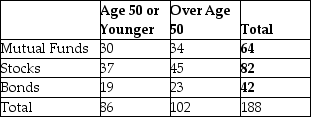
A full service brokerage firm gathered information on how their clients were investing for retirement. Based on age, clients were categorized according to where the largest percentage of their retirement portfolio was invested. The table below summarized the data.
 -Prepare an appropriate chart to display the marginal distribution of age.
Free
(Essay)
4.8/5  (41)
(41)
Correct Answer: Verified
Either a bar chart (shown below) or a pie chart is appropriate. 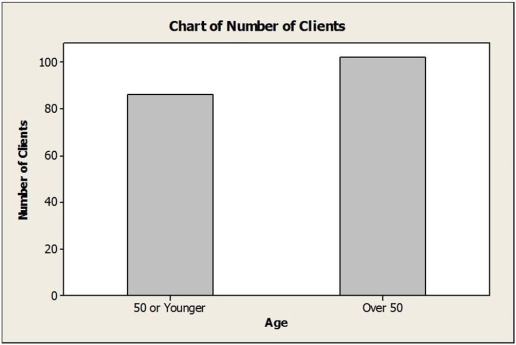
Consider the following to answer the question(s) below:
A full service brokerage firm gathered information on how their clients were investing for retirement. Based on age, clients were categorized according to where the largest percentage of their retirement portfolio was invested. The table below summarized the data.
-Identify the variables and tell whether each is categorical or quantitative.
Free
(Essay)
4.8/5 (34)
Correct Answer:Verified
Mode of investment and age; mode of investment is categorical; age is quantitative.
Consider the following to answer the question(s) below:
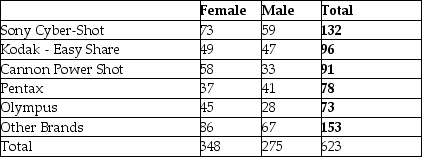
A large national retailer of electronics conducted a survey to determine consumer preferences for various brands of digital cameras. The table summarizes responses by brand and gender.
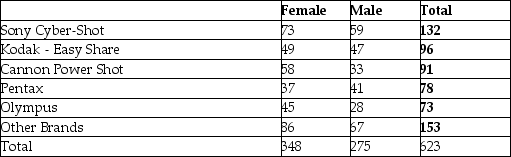 -The percentage of consumers who are male and prefer Pentax is
Free
(Multiple Choice)
4.9/5 (28)
Correct Answer:Verified
B
Consider the following to answer the question(s) below:
A full service brokerage firm gathered information on how their clients were investing for retirement. Based on age, clients were categorized according to where the largest percentage of their retirement portfolio was invested and shown in the table below.
 -The percentage of clients who are over age 50 and invest in mutual funds is
(Multiple Choice)
4.8/5 (27)
Consider the following to answer the question(s) below:
A large national retailer of electronics conducted a survey to determine consumer preferences for various brands of digital cameras. The table summarizes responses by brand and gender.
-The following bar chart for these data shows 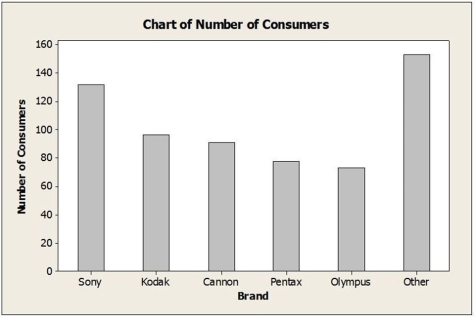
(Multiple Choice)
4.9/5 (37)
Consider the following to answer the question(s) below:
A full service brokerage firm gathered information on how their clients were investing for retirement. Based on age, clients were categorized according to where the largest percentage of their retirement portfolio was invested. The table below summarized the data.
-What is the marginal distribution of age?
(Essay)
4.8/5 (26)
Consider the following to answer the question(s) below:
A full service brokerage firm gathered information on how their clients were investing for retirement. Based on age, clients were categorized according to where the largest percentage of their retirement portfolio was invested. The table below summarized the data.
-Write a sentence or two about the conditional relative frequency distribution of mode of investment for clients age 50 or younger.
(Essay)
4.7/5 (30)
Consider the following to answer the question(s) below:
A full service brokerage firm gathered information on how their clients were investing for retirement. Based on age, clients were categorized according to where the largest percentage of their retirement portfolio was invested and shown in the table below.
-A contingency table is used to display
(Multiple Choice)
4.8/5 (37)
Consider the following to answer the question(s) below:
A large national retailer of electronics conducted a survey to determine consumer preferences for various brands of digital cameras. The table summarizes responses by brand and gender.
-Here is the side-by-side bar chart for these data. 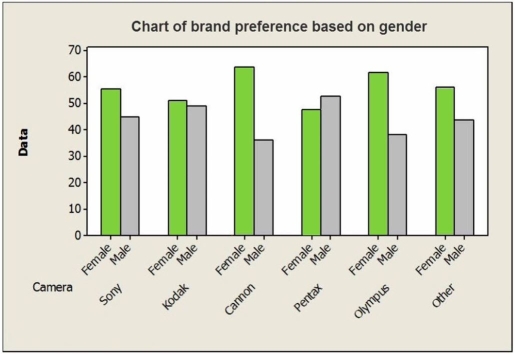 Which of the following statements is true?
(Multiple Choice)
4.8/5 (36)
Consider the following to answer the question(s) below:
A full service brokerage firm gathered information on how their clients were investing for retirement. Based on age, clients were categorized according to where the largest percentage of their retirement portfolio was invested and shown in the table below.
-Of the clients over age 50, the percentage who invest in mutual funds is
(Multiple Choice)
4.9/5 (31)
Consider the following to answer the question(s) below:
A full service brokerage firm gathered information on how their clients were investing for retirement. Based on age, clients were categorized according to where the largest percentage of their retirement portfolio was invested. The table below summarized the data.
-Consider the following side-by-side bar chart for the data below: 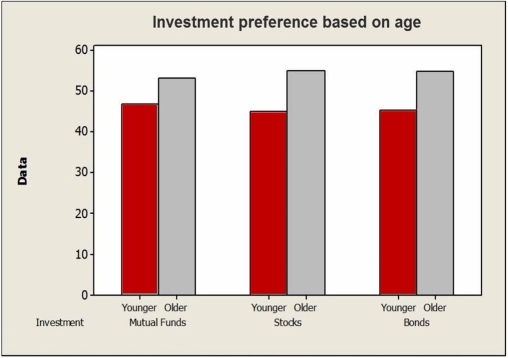 Does the chart indicate that mode of investment is independent of age? Explain.
(Essay)
4.8/5 (31)
Consider the following to answer the question(s) below:
A full service brokerage firm gathered information on how their clients were investing for retirement. Based on age, clients were categorized according to where the largest percentage of their retirement portfolio was invested and shown in the table below.
-One characteristic of a bar chart is
(Multiple Choice)
4.8/5 (39)
Consider the following to answer the question(s) below:
A full service brokerage firm gathered information on how their clients were investing for retirement. Based on age, clients were categorized according to where the largest percentage of their retirement portfolio was invested and shown in the table below.
-The percentage of clients over age 50 is
(Multiple Choice)
4.8/5 (35)
Consider the following to answer the question(s) below:
The option to buy extended warranties is commonplace with most electronics purchases. Does the type of purchase affect a consumer's willingness to pay extra for an extended warranty? Data for 420 consumers who purchased digital cameras and laptop computers from a leading electronics retailer are summarized in the table. 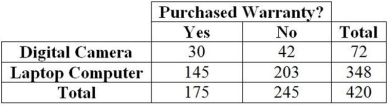 -Of those who bought a digital camera, the percentage of those who purchased the warranty is
(Multiple Choice)
4.8/5 (38)
Consider the following to answer the question(s) below:
A large national retailer of electronics conducted a survey to determine consumer preferences for various brands of digital cameras. The table summarizes responses by brand and gender.
 -Find each of the following percentages.
a. What percentage of the responses were males who prefer Pentax?
b. What percentage of the male responses prefer Pentax?
c. What percentage of the consumers who chose Pentax were males?
-Find each of the following percentages.
a. What percentage of the responses were males who prefer Pentax?
b. What percentage of the male responses prefer Pentax?
c. What percentage of the consumers who chose Pentax were males?
(Essay)
5.0/5 (39)
Consider the following to answer the question(s) below:
A large national retailer of electronics conducted a survey to determine consumer preferences for various brands of digital cameras. The table summarizes responses by brand and gender.
-Write a sentence or two about the conditional relative frequency distribution of the brands among female respondents.
(Essay)
4.8/5 (25)
Consider the following to answer the question(s) below:
A large national retailer of electronics conducted a survey to determine consumer preferences for various brands of digital cameras. The table summarizes responses by brand and gender.
-Of the consumers who prefer Pentax, what percentage is male?
(Multiple Choice)
4.9/5 (38)
Consider the following to answer the question(s) below:
A large national retailer of electronics conducted a survey to determine consumer preferences for various brands of digital cameras. The table summarizes responses by brand and gender.
-Identify the variables and tell whether each is categorical or quantitative.
(Short Answer)
4.9/5 (37)
Consider the following to answer the question(s) below:
A full service brokerage firm gathered information on how their clients were investing for retirement. Based on age, clients were categorized according to where the largest percentage of their retirement portfolio was invested and shown in the table below.
-The city council has just voted to pass the budget for next year. If you were writing a report describing the budget so the citizens could understand how the total tax dollars will be spent, and you decided to show each category of expenses as a wedge of a circle, which of the following graphs would be most appropriate?
(Multiple Choice)
4.9/5 (29)
Consider the following to answer the question(s) below:
A large national retailer of electronics conducted a survey to determine consumer preferences for various brands of digital cameras. The table summarizes responses by brand and gender.
-Prepare an appropriate chart to display the marginal distribution of brands.
(Essay)
4.7/5 (32)
Filters
- Essay(0)
- Multiple Choice(0)
- Short Answer(0)
- True False(0)
- Matching(0)