Deck 8: Analyzing Multivariable Change: Optimization
Full screen (f)
Question
Locate and classify any critical points. 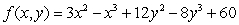
A) (0, 1, 62), relative minimum point
(2, 0, 66), relative maximum point
(0, 1, 61), is a saddle point,
(1, 0, 64), saddle point
B) (0, 0, 60), relative minimum point
(2, 1, 68), relative maximum point
(0, 1, 64), is a saddle point,
(2, 0, 64), saddle point
C) (1, 0, 60), relative minimum point
(0, 1, 68), relative maximum point
(0, 1, 64), is a saddle point,
(1, 0, 64), saddle point
D) (0, 1, 60), relative minimum point
(1, 1, 64), relative maximum point
(0, 1, 62), is a saddle point,
(2, 0, 64), saddle point
E) (1, 0, 60), relative minimum point
(2, 1, 68), relative maximum point
(0, 1, 61), is a saddle point,
(0, 0, 64), saddle point
Question
A process to extract pigment from sunflower seeds involves washing the sunflower heads in heated water. Suppose the percentage of pigment that can be removed from the sunflower head by washing for 20 minutes is  percent, where r is the amount of milliliters of water per gram of sunflower used for washing and
  is the water temperature. Find the critical point of the pigment removal function. Round your answers to four decimal places.
A) ml
ml
B) ml
ml
C) ml
ml
D)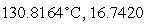 ml
ml
E)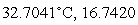 ml
ml
percent, where r is the amount of milliliters of water per gram of sunflower used for washing and is the water temperature. Find the critical point of the pigment removal function. Round your answers to four decimal places.A)
mlB)
mlC)
mlD)
mlE)
ml Question
Locate and classify any critical points. 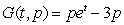
A) , saddle point
B) , saddle point
C) , saddle point
D) , saddle point
E) , saddle point
A)
, saddle pointB)
, saddle pointC)
, saddle pointD)
, saddle pointE)
, saddle point Question
A model for the elevation above sea level of a tract of farmland is  feet above sea level, where e is the distance in miles east of the western fence and n is the distance in miles north of the southern fence. Find the two critical points
  of E. Round your answers to three decimal places.
A)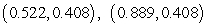
B)
C)
D)
E)
feet above sea level, where e is the distance in miles east of the western fence and n is the distance in miles north of the southern fence. Find the two critical points of E. Round your answers to three decimal places.A)
B)
C)
D)
E)
Question
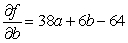
A restaurant mixes ground beef that costs $b per pound with pork sausage that costs $p per pound to make a meat mixture that is used on the restaurant's signature pizza. The quarterly revenue, in thousands of dollars, from the sale of this pizza is given by the equation 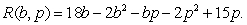 To the nearest thousand dollars, what is the maximum quarterly revenue from the sale of the restaurant's signature pizza?
A) 55 thousand dollars
B) 47 thousand dollars
C) 8 thousand dollars
D) 36 thousand dollars
E) 28 thousand dollars
To the nearest thousand dollars, what is the maximum quarterly revenue from the sale of the restaurant's signature pizza?A) 55 thousand dollars
B) 47 thousand dollars
C) 8 thousand dollars
D) 36 thousand dollars
E) 28 thousand dollars
Question
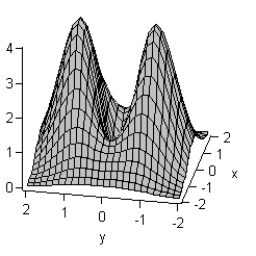
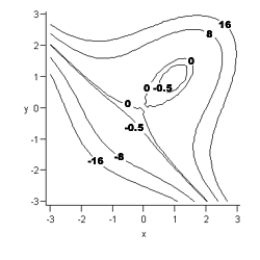
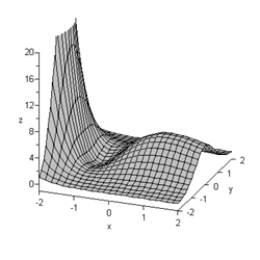
Consider the contour and associated three-dimensional graph of  Is the point at which
  and
and  a relative maximum point, a relative minimum point, or a saddle point?
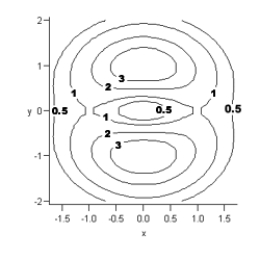
A) saddle point
B) relative maximum
C) relative minimum
Is the point at which and a relative maximum point, a relative minimum point, or a saddle point? A) saddle point
B) relative maximum
C) relative minimum
Question
Milk proteins are sometimes added to sausage to reduce shrinking due to cooking loss and improve the texture of the sausage. Suppose the cooking loss (expressed as a percentage of initial weight) can be modeled by  percent, where w is the proportion of whey protein and s is the proportion of skim milk powder. Determine whether the function L has a relative maximum, relative minimum, or a saddle point, and find the corresponding proportions of whey protein and skim milk powder at that point. Round your answer to the nearest hundredth of a percent.
A) relative maximum
Whey protein: 5.62%
Skim milk powder: 5.04%
B) relative minimum
Whey protein: 5.62%
Skim milk powder: 5.04%
C) relative maximum
Whey protein: 19.83%
Skim milk powder: 17.78%
D) relative maximum
Whey protein: 17.78%
Skim milk powder: 19.83%
E) saddle point
Whey protein: 17.78%
Skim milk powder: 19.83%
percent, where w is the proportion of whey protein and s is the proportion of skim milk powder. Determine whether the function L has a relative maximum, relative minimum, or a saddle point, and find the corresponding proportions of whey protein and skim milk powder at that point. Round your answer to the nearest hundredth of a percent.A) relative maximum
Whey protein: 5.62%
Skim milk powder: 5.04%
B) relative minimum
Whey protein: 5.62%
Skim milk powder: 5.04%
C) relative maximum
Whey protein: 19.83%
Skim milk powder: 17.78%
D) relative maximum
Whey protein: 17.78%
Skim milk powder: 19.83%
E) saddle point
Whey protein: 17.78%
Skim milk powder: 19.83%
Question
A process to extract pigment from sunflower seeds involves washing the sunflower heads in heated water. Suppose the percentage of pigment that can be removed from the sunflower head by washing for 20 minutes is  percent, where r is the amount of milliliters of water per gram of sunflower used for washing and
  is the water temperature. Is the critical point of P a maximum, minimum or saddle point?
A) maximum
B) minimum
C) saddle point
D) cannot be determined
percent, where r is the amount of milliliters of water per gram of sunflower used for washing and is the water temperature. Is the critical point of P a maximum, minimum or saddle point?A) maximum
B) minimum
C) saddle point
D) cannot be determined
Question
Consider the following contour graph and three-dimensional graph for a function F with inputs x and y. On the basis of the graphs approximate the inputs and output of each critical point in the form 
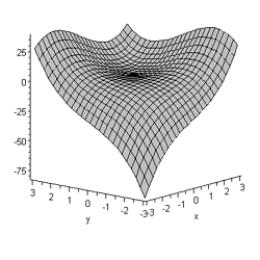
A) relative maximum: none
Relative minimum: (1,1,-5)
Saddle point: (0,0,0)
B) relative maximum: none
Relative minimum: (1,1,-1)
Saddle point: (0,0,0)
C) relative maximum: none
Relative minimum: (1,1,-1)
Saddle point: (0,0,-1)
D) relative maximum: (1,1,-1)
Relative minimum: (-3,-3,-75)
Saddle point: (0,0,-1)
E) relative maximum: (0,0,0)
Relative minimum: (1,1,-1)
Saddle point: none
Question
Fatty acids are liberated from a fat mixture through a chemical process called hydrolysis. Suppose the number of fatty acids per 100 grams of water can be modeled by  grams, where the pH of the fat mixture is
  and the temperature is
  Find the pH and temperature that maximize the amount of fatty acid. Round your answers to two decimal place.
A) pH: 4.12
Temperature:
B) pH: 6.22
Temperature:
C) pH: 0.71
Temperature:
D) pH: 6.34
Temperature:
E) pH: 6.06
Temperature:
grams, where the pH of the fat mixture is and the temperature is Find the pH and temperature that maximize the amount of fatty acid. Round your answers to two decimal place.A) pH: 4.12
Temperature:
B) pH: 6.22
Temperature:
C) pH: 0.71
Temperature:
D) pH: 6.34
Temperature:
E) pH: 6.06
Temperature:
Question
Is the point  and
and  on the contour graph below a relative maximum point, a relative minimum point, or a saddle point?
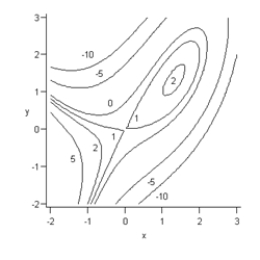
A) relative minimum
B) relative maximum
C) saddle point
and on the contour graph below a relative maximum point, a relative minimum point, or a saddle point? A) relative minimum
B) relative maximum
C) saddle point
Question
Locate and classify any critical points. 
A) , saddle point
  , relative minimum point
B) , saddle point
  , relative minimum point
C) , saddle point
  , relative minimum point
D) , saddle point
  , relative minimum point
E) , saddle point
  , relative maximum point
A)
, saddle point , relative minimum pointB)
, saddle point , relative minimum pointC)
, saddle point , relative minimum pointD)
, saddle point , relative minimum pointE)
, saddle point , relative maximum point Question
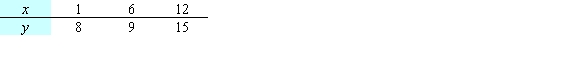
Suppose the table shows the average price of certain produce, in cents per pound, for selected months and years. Locate all critical points in the table and identify each point as a relative maximum point, relative minimum point, or a saddle point. 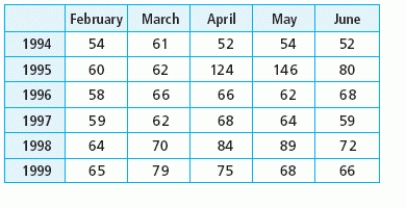
A) relative maximum point(s): (May 1995); (May 1998)
Relative minimum point(s): (May1996)
Saddle point(s): (March 1996)
B) relative maximum point(s) (May 1995)
Relative minimum point(s): (April 1994) and (June 1994)
Saddle point(s): (March 1996)
C) relative maximum point(s): (May 1995); (May 1998); (March 1999)
Relative minimum point(s): (February 1994); (April 1995); (June 1994); (May 1996); (February 1997); (June 1997)
Saddle point(s): (March 1994); (May 1994); (February 1995); (June 1995); (March 1996); (June 1998)
D) relative maximum point(s): (May 1995)
Relative minimum point(s): (April 1994) and (June 1994)
Saddle point(s): (March 1994); (May 1994); (February 1995); (June 1995); (March 1996); (June 1998)
E) none of these
Question
The consistometer table gives the consistency of applesauce as a function of the number of months the raw apples were stored and the temperature at which they were blanched. The consistometer value is a measure of how far (in centimeters) an amount of applesauce flows down a vertical surface in 30 seconds. Sketch the contour curves on the table for the consistometer values of 2.8 and 3.2. 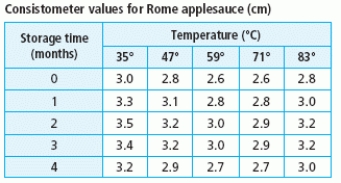
A)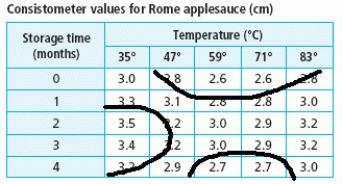
B)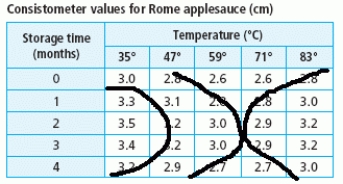
C)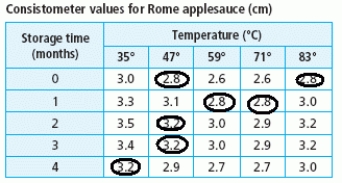
D)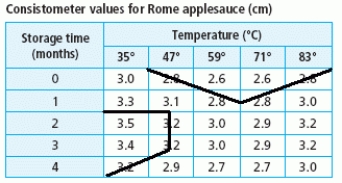
E)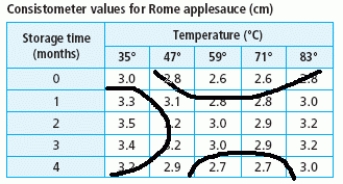
A)
B)
C)
D)
E)
Question
Suppose that 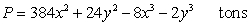 is the production function for a product with x units of one input and y units of a second input. Find the values of x and y that will maximize production.
A)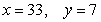
B)
C)
D)
E)
is the production function for a product with x units of one input and y units of a second input. Find the values of x and y that will maximize production.A)
B)
C)
D)
E)
Question
Consider the contour graph and the three-dimensional graph for the function R, given below. What critical point is represented by the point A on the contour map? 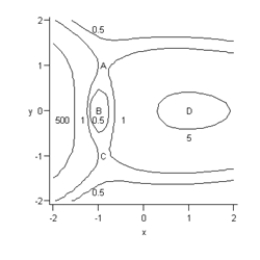
A) relative maximum
B) saddle point
C) global maximum
D) relative minimum
E) not a critical point
A) relative maximum
B) saddle point
C) global maximum
D) relative minimum
E) not a critical point
Question
Test for relative maxima and minima. 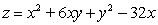
A) saddle point at
B) saddle point at
C) saddle point at
D) relative minimum at
E) relative minimum at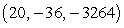
A) saddle point at
B) saddle point at
C) saddle point at
D) relative minimum at
E) relative minimum at
Question
Suppose table shows the average price of bananas, in cents per pound, for selected months and years. Locate all relative maximum points, minimum points, and saddle points. 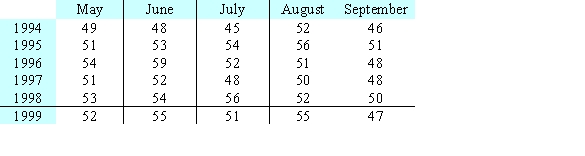
A) none of these
B) relative maximum point(s): (July 1998); (June 1999); (August 1999)
Relative minimum points(s): (July 1994); (September 1994); (May 1997)
Saddle point(s): (June 1997); (August 1997)
C) relative maximum point(s): (August, 1995); (June 1996)
Relative minimum points(s): (July 1997); (May 1999); (July 1999); (September 1999)
Saddle point(s): (May 1998); (September 1998)
D) relative maximum point(s): (June 1996)
Relative minimum points(s): (July 1997)
Saddle point(s): (June 1997); (August 1997)
E) relative maximum point(s): (August, 1995); (June 1996); (July 1998)
Relative minimum points(s): (July 1997)
Saddle point(s): (June 1997); (August 1997)
Question
A nursery sells mulch by the truckload. Bark mulch sells for $b per load and pine straw sells for $p per load. The nursery's average weekly profit form the sale of these two types of mulch can be modeled by the equation  dollars. To the nearest dollar, what is the maximum weekly profit from the sales of these two types of mulch?
A) $2,635
B) $3,559
C) $1,734
D) $6,372
E) $10,524
dollars. To the nearest dollar, what is the maximum weekly profit from the sales of these two types of mulch?A) $2,635
B) $3,559
C) $1,734
D) $6,372
E) $10,524
Question
Test for relative maxima and minima. 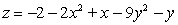
A) relative minimum at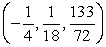
B) relative maximum at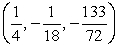
C) relative minimum at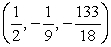
D) relative maximum at
E) relative minimum at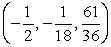
A) relative minimum at
B) relative maximum at
C) relative minimum at
D) relative maximum at
E) relative minimum at
Question
A travel agency offers spring-break cruise packages. The agency advertises a cruise to Cancun, Mexico, for $1200 per person. In order to promote the cruise among student organizations on campus, the agency offers a discount for student groups selling the cruise to over 50 of their members. The price per student will be discounted by $10 for each student in excess of 50. For example, if an organization had 55 members go on the cruise, each of those 55 students would pay 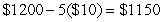 . Write a model for revenue as a multivariable function of the number of students in excess of 50 and the price per student.
A)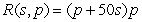 dollars
B) dollars
C) dollars
D) dollars
E) dollars
. Write a model for revenue as a multivariable function of the number of students in excess of 50 and the price per student.A)
dollarsB)
dollarsC)
dollarsD)
dollarsE)
dollars Question
A small percent of homes in an region lack certain amenities. The data is given in the table below. Give the linear model of the best fitting line  , where x is the number of years since 1984.
A)
B)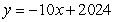
C)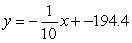
D)
E)
, where x is the number of years since 1984. A)
B)
C)
D)
E)
Question
Write the Lagrange system of partial derivative equations. 
A)
B)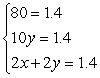
C)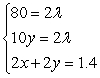
D)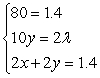
E)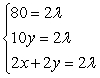
A)
B)
C)
D)
E)
Question
Locate the optimal point of the constrained system. 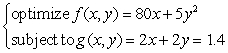
A)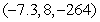
B)
C)
D)
E)
A)
B)
C)
D)
E)
Question
The daily output at a plant manufacturing transistor radios is approximated by the function 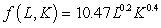 radios, where L is the size of the labor force measured in hundreds of worker hours and K is the capital investment in thousands of dollars. Suppose the plant manager has a daily budget of $18,000 to be invested in capital or spent on labor and that the average wage of an employee at the radio plant is $7.00 per hour. What combination of worker hours and capital expenditures will yield the maximum daily production? Round your answers to the nearest integer.
A) labor-hours
B) labor-hours
C) labor-hours
D) labor-hours
E) labor-hours
radios, where L is the size of the labor force measured in hundreds of worker hours and K is the capital investment in thousands of dollars. Suppose the plant manager has a daily budget of $18,000 to be invested in capital or spent on labor and that the average wage of an employee at the radio plant is $7.00 per hour. What combination of worker hours and capital expenditures will yield the maximum daily production? Round your answers to the nearest integer.A)
labor-hours B)
labor-hours C)
labor-hours D)
labor-hours E)
labor-hours Question
Let  be the SSE function for the best fitting line
  of the data below. A student calculated that the minimum of f occurs at
  . Based on this calculation, what is the linear function that best fits the data?
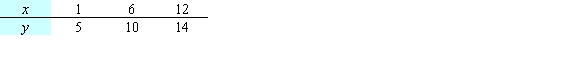
A)
B)
C)
D)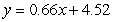
E)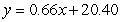
be the SSE function for the best fitting line of the data below. A student calculated that the minimum of f occurs at . Based on this calculation, what is the linear function that best fits the data? A)
B)
C)
D)
E)
Question
Let  be the SSE function for the best fitting line
  of the data below. Find the minimum value of
  Round your answer to four decimal places.
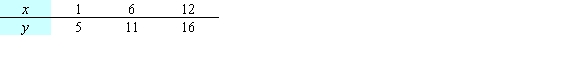
A) 0.000
B) 0.0006
C) 0.0188
D) 0.8466
E) 0.6648
be the SSE function for the best fitting line of the data below. Find the minimum value of Round your answer to four decimal places. A) 0.000
B) 0.0006
C) 0.0188
D) 0.8466
E) 0.6648
Question
A travel agency offers spring-break cruise packages. The agency advertises a cruise to Cancun, Mexico, for $1200 per person. In order to promote the cruise among student organizations on campus, the agency offers a discount for student groups selling the cruise to over 50 of their members. The price per student will be discounted by $10 for each student in excess of 50. For example, if an organization had 55 members go on the cruise, each of those 55 students would pay  . Write a constraint function in terms of the number of students in excess of 50 and the price.
A)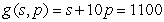
B)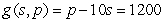
C)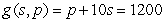
D)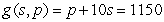
E)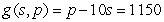
. Write a constraint function in terms of the number of students in excess of 50 and the price.A)
B)
C)
D)
E)
Question
Identify the optimal point as either a maximum point or a minimum point. 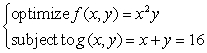
A) (0, 16, 16) constrained minimum
(5)333, 10.667, 606.815) constrained maximum
B) (0, 16, 0) constrained minimum
(606.815, 5.333, 10.667) constrained maximum
C) (16, 16, 0) constrained minimum
(10)667, 606.815, 5.333) constrained maximum
D) (0, 16, 0) constrained minimum
(10)667, 5.333, 606.815) constrained maximum
E) (0, 10, 0) constrained minimum
(10)667, 606.815, 5.333) constrained maximum
Question
The figures show a contour graph for a function f in blue with a constraint function  in black. Locate any optimal points of
  and classify each as a relative maximum point or a relative minimum point.
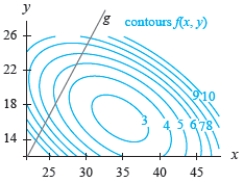
A) (31, 10, 4)
B) (32, 14, 2)
C) (35, 16, 2)
D) (32, 16, 2)
E) (35, 18, 2)
in black. Locate any optimal points of and classify each as a relative maximum point or a relative minimum point. A) (31, 10, 4)
B) (32, 14, 2)
C) (35, 16, 2)
D) (32, 16, 2)
E) (35, 18, 2)
Question
Express SSE as a multivariable function of a and b for the best fitting line  Use the data below.
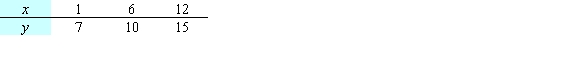
A)
B)
C)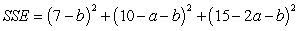
D)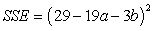
E)
Use the data below. A)
B)
C)
D)
E)
Question
A company has the Cobb-Douglas production function  , where x is the number of units of labor, y is the number of units of capital, and z is the units of production. Suppose labor costs $200 per unit, capital costs $200 per unit, and the total cost of labor and capital is limited to $400000. Find the number of units of labor and the number of units of capital that maximize production.
A) units of labor;
  units of capital
B) units of labor;
  units of capital
C) units of labor;
  units of capital
D) units of labor;
  units of capital
E) units of labor;
  units of capital
, where x is the number of units of labor, y is the number of units of capital, and z is the units of production. Suppose labor costs $200 per unit, capital costs $200 per unit, and the total cost of labor and capital is limited to $400000. Find the number of units of labor and the number of units of capital that maximize production.A)
units of labor; units of capitalB)
units of labor; units of capitalC)
units of labor; units of capitalD)
units of labor; units of capitalE)
units of labor; units of capital Question
For a region, the percentage of adults 20-24 years of age that have not been married is given in the table below. Use the method of least squares to find the multivariable function f with inputs a and b for the best fitting line  where x is the number of years since 1970.
A)
B)
C)
D)
E)
where x is the number of years since 1970. A)
B)
C)
D)
E)
Question
A model for the elevation above sea level of a tract of farmland is  feet above sea level, where e is the distance in miles east of the western fence and n is the distance in miles north of the southern fence. One critical point is
  Use the Determinant Test to classify it as a maximum, minimum, or saddle point.
A) relative maximum
B) relative minimum
C) saddle point
D) cannot be determined
feet above sea level, where e is the distance in miles east of the western fence and n is the distance in miles north of the southern fence. One critical point is Use the Determinant Test to classify it as a maximum, minimum, or saddle point.A) relative maximum
B) relative minimum
C) saddle point
D) cannot be determined
Question
Express SSE as a multivariable function of a and b for the best fitting line  Use the data below.
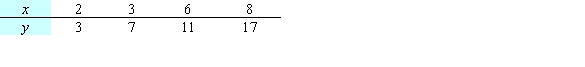
A)
B)
C)
D)
E)
Use the data below. A)
B)
C)
D)
E)
Question
A fitness center is trying to determine how to allocate funds for advertising. The manager decides to advertise on the radio and in the newspaper. Previous experience with such advertising leads the manager to expect 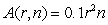 responses when r adds are run on the radio and n adds appear in the newspaper. Each ad on the radio costs $13 and each newspaper ad costs $3. Using Lagrange multipliers, a student found that when $504 are budgeted for advertising, the maximum number of responses occurred from 26 radio ad and 56 newspaper ads and had
  Suppose the manager budgeted an additional $22 for advertising. What is the approximate change in the optimal value as a result of this change in the constraint level?
A) 2,710 additional response
B) 484 additional responses
C) 22 additional responses
D) 367 additional responses
E) 1 additional response
responses when r adds are run on the radio and n adds appear in the newspaper. Each ad on the radio costs $13 and each newspaper ad costs $3. Using Lagrange multipliers, a student found that when $504 are budgeted for advertising, the maximum number of responses occurred from 26 radio ad and 56 newspaper ads and had Suppose the manager budgeted an additional $22 for advertising. What is the approximate change in the optimal value as a result of this change in the constraint level?A) 2,710 additional response
B) 484 additional responses
C) 22 additional responses
D) 367 additional responses
E) 1 additional response
Question
A rancher removed 200 feet of wire fencing from a field on his ranch. He wants to reuse the fencing to create a rectangular corral into which he will build a 6-foot-wide wooden gate. The dimensions of the corral with the greatest possible area are found using the multivariable functions for the amount of fencing and for the resulting area of the corral: feet is the amount of fencing needed for the specified rectangular corral of width w feet and length l feet. The area of the specified corral is  where w feet is the width and l feet is the length. Write the multivariable function to be maximized.
A)
B)
C)
D)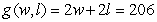
E)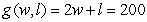
where w feet is the width and l feet is the length. Write the multivariable function to be maximized.A)
B)
C)
D)
E)
Question
A manufacture is designing a packaging carton for shipping. The carton will be a box with a fixed volume of v cubic feet. The cost to construct each box is 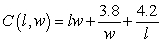 dollars, where the box is l feet long and w feet wide. Suppose M is the minimum cost and
 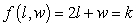 is the constraint equation, and
  for
for  Estimate the minimum cost if the constraint curve equation is
A)
B)
C)
D)
E)
dollars, where the box is l feet long and w feet wide. Suppose M is the minimum cost and is the constraint equation, and for Estimate the minimum cost if the constraint curve equation is A)
B)
C)
D)
E)
Question
The figures show a contour graph for a function f in blue with a constraint function  in black. Estimate any optimal points for the system
  Classify each constrained optimal point as a maximum or a minimum.
A) (28, 21, 4.5): constrained minimum
B) (24, 20, 4.5): constrained minimum
C) (25, 21, 4.5): constrained minimum
D) (28, 20, 5.5): constrained maximum
E) (25, 24,3.5): constrained maximum
in black. Estimate any optimal points for the system Classify each constrained optimal point as a maximum or a minimum. A) (28, 21, 4.5): constrained minimum
B) (24, 20, 4.5): constrained minimum
C) (25, 21, 4.5): constrained minimum
D) (28, 20, 5.5): constrained maximum
E) (25, 24,3.5): constrained maximum
Question
Let  be the SSE function for the best fitting line
  of the data below. Find
  and
and  .
. 
A)
B)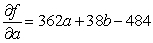
C)

D)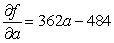

E)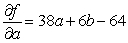

be the SSE function for the best fitting line of the data below. Find and . A)
B)
C)
D)
E)
Question
The table shows the number of days that some food will keep as a function of the temperature. Use the method of least squares to find the best-fitting linear model for the data. Give your coefficients to two decimal places. 
A)
B)
C)
D)
E)
A)
B)
C)
D)
E)
Question
The table below gives the number of inches of precipitation that fell in a city in the given months. Give the linear model  that best fits the data, where x is 1 in January, 2 in February, and 3 in March. Give the coefficients to two decimal places.
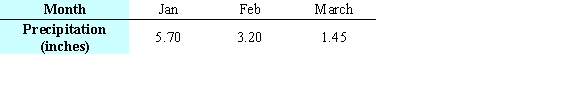
A)
B)
C)
D)
E)
that best fits the data, where x is 1 in January, 2 in February, and 3 in March. Give the coefficients to two decimal places. A)
B)
C)
D)
E)
Question
The table below gives the number of inches of precipitation that fell in a city in the given months. Use the method of least squares to find the multivariable function f with inputs a and b for the best fitting line  where x is 1 in January, 2 in February, and 3 in March. What is the minimum value of
  Give your answer to two decimal places.
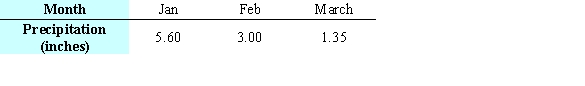
A) 0.00
B) 1.35
C) 42.18
D) 0.07
E) 0.15
where x is 1 in January, 2 in February, and 3 in March. What is the minimum value of Give your answer to two decimal places. A) 0.00
B) 1.35
C) 42.18
D) 0.07
E) 0.15
Question
Consider the table showing the numbers of infants born to each of five generations in a certain family. Change the data so that they represent the generation and natural log of the infants. Use the method of least squares to find the best fitting linear model for the changed data where x represents the generation. You should keep the data in the form  and should not round the values until the final calculation. Give your coefficients to four decimal places.
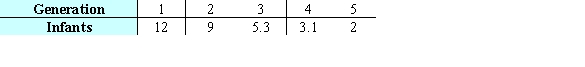
A)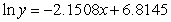
B)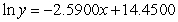
C)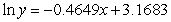
D)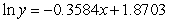
E)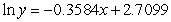
and should not round the values until the final calculation. Give your coefficients to four decimal places. A)
B)
C)
D)
E)
Question
For a region, the percentage of adults 20-24 years of age how have not been married is given in the table below. 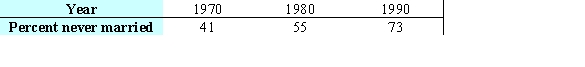 The percentage of adults 20-24 years old who had never been married in 1960 was 37. Add this data point and use technology to find a linear model. What is the percentage of adults 20-24 years old in 2000 who have never been married, according to this model? Round your answer to the nearest integer.
A) 84%
B) 85%
C) 88%
D) 82%
E) 86%
The percentage of adults 20-24 years old who had never been married in 1960 was 37. Add this data point and use technology to find a linear model. What is the percentage of adults 20-24 years old in 2000 who have never been married, according to this model? Round your answer to the nearest integer.A) 84%
B) 85%
C) 88%
D) 82%
E) 86%
Question
A factory makes 7-mm aluminum ball bearings. Company planners have determined how much it costs them to make certain numbers of cases of ball bearings in a single run. These costs are shown in the table below. The line of best fit for this data is 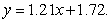 Find the sum of the squares of the deviations. Give your answer to four decimal places.
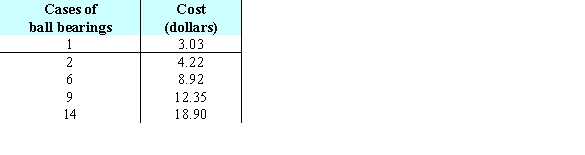
A) 17.0012
B) 0.1452
C) 0.0100
D) 65.6179
E) 0.1000
Find the sum of the squares of the deviations. Give your answer to four decimal places. A) 17.0012
B) 0.1452
C) 0.0100
D) 65.6179
E) 0.1000
Question
The table below gives the number of inches of precipitation that fell in a city in the given months. Use the method of least squares to find the multivariable function f with inputs a and b for the best fitting line  where x is 1 in January, 2 in February, and 3 in March.
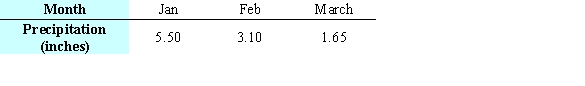
A)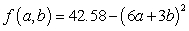
B)
C)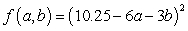
D)
E)
where x is 1 in January, 2 in February, and 3 in March. A)
B)
C)
D)
E)
Question
Before technology was available to fit many kinds of models to data, researchers and others were restricted to using linear models. Because exponential data are common in many fields of study, it has always been important to be able to fit an exponential model to data. Consider the table showing past and predicted populations for a region. Change the data so that they represent the year and natural log of the population. Use the method of least squares to find the best fitting linear model for the changed data where x represents the year. You should keep the data in the form  and should not round the values until the final calculation. Give your coefficients to four decimal places.
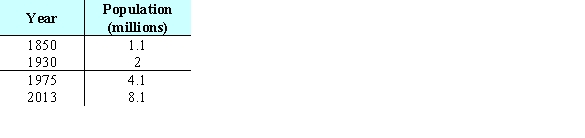
A)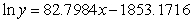
B)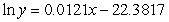
C)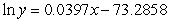
D)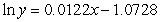
E)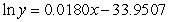
and should not round the values until the final calculation. Give your coefficients to four decimal places. A)
B)
C)
D)
E)
Question
For a region, the percentage of adults 20-24 years of age that have not been married is given in the table below. Give the linear model  that best fits this data, where x is the number of years since 1970.
A)
B)
C)
D)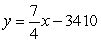
E)
that best fits this data, where x is the number of years since 1970. A)
B)
C)
D)
E)
Question
The number of animal experiments in a country declined between 1970 and 1980. The numbers for selected years are shown in the table. Use the method of least squares to find the best-fitting linear model for the data. Let  correspond to 1970. Round your coefficients to two decimal places.
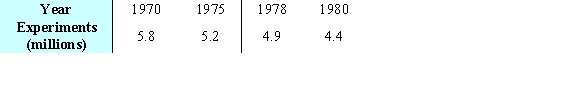
A)
B)
C)
D)
E)
correspond to 1970. Round your coefficients to two decimal places. A)
B)
C)
D)
E)

Unlock Deck
Sign up to unlock the cards in this deck!
Unlock Deck
Unlock Deck
1/50
Play
Full screen (f)
Deck 8: Analyzing Multivariable Change: Optimization
1
Locate and classify any critical points.
A) (0, 1, 62), relative minimum point
(2, 0, 66), relative maximum point
(0, 1, 61), is a saddle point,
(1, 0, 64), saddle point
B) (0, 0, 60), relative minimum point
(2, 1, 68), relative maximum point
(0, 1, 64), is a saddle point,
(2, 0, 64), saddle point
C) (1, 0, 60), relative minimum point
(0, 1, 68), relative maximum point
(0, 1, 64), is a saddle point,
(1, 0, 64), saddle point
D) (0, 1, 60), relative minimum point
(1, 1, 64), relative maximum point
(0, 1, 62), is a saddle point,
(2, 0, 64), saddle point
E) (1, 0, 60), relative minimum point
(2, 1, 68), relative maximum point
(0, 1, 61), is a saddle point,
(0, 0, 64), saddle point
(0, 0, 60), relative minimum point
(2, 1, 68), relative maximum point
(0, 1, 64), is a saddle point,
(2, 0, 64), saddle point
(2, 1, 68), relative maximum point
(0, 1, 64), is a saddle point,
(2, 0, 64), saddle point
2
A process to extract pigment from sunflower seeds involves washing the sunflower heads in heated water. Suppose the percentage of pigment that can be removed from the sunflower head by washing for 20 minutes is percent, where r is the amount of milliliters of water per gram of sunflower used for washing and is the water temperature. Find the critical point of the pigment removal function. Round your answers to four decimal places.
A) ml
B) ml
C) ml
D) ml
E) ml
percent, where r is the amount of milliliters of water per gram of sunflower used for washing and is the water temperature. Find the critical point of the pigment removal function. Round your answers to four decimal places.A)
mlB)
mlC)
mlD)
mlE)
ml ml 3
Locate and classify any critical points.
A) , saddle point
B) , saddle point
C) , saddle point
D) , saddle point
E) , saddle point
A)
, saddle pointB)
, saddle pointC)
, saddle pointD)
, saddle pointE)
, saddle point , saddle point 4
A model for the elevation above sea level of a tract of farmland is feet above sea level, where e is the distance in miles east of the western fence and n is the distance in miles north of the southern fence. Find the two critical points of E. Round your answers to three decimal places.
A)
B)
C)
D)
E)
feet above sea level, where e is the distance in miles east of the western fence and n is the distance in miles north of the southern fence. Find the two critical points of E. Round your answers to three decimal places.A)
B)
C)
D)
E)
Unlock Deck
Unlock for access to all 50 flashcards in this deck.
Unlock Deck
k this deck
5
A restaurant mixes ground beef that costs $b per pound with pork sausage that costs $p per pound to make a meat mixture that is used on the restaurant's signature pizza. The quarterly revenue, in thousands of dollars, from the sale of this pizza is given by the equation To the nearest thousand dollars, what is the maximum quarterly revenue from the sale of the restaurant's signature pizza?
A) 55 thousand dollars
B) 47 thousand dollars
C) 8 thousand dollars
D) 36 thousand dollars
E) 28 thousand dollars
To the nearest thousand dollars, what is the maximum quarterly revenue from the sale of the restaurant's signature pizza?A) 55 thousand dollars
B) 47 thousand dollars
C) 8 thousand dollars
D) 36 thousand dollars
E) 28 thousand dollars
Unlock Deck
Unlock for access to all 50 flashcards in this deck.
Unlock Deck
k this deck
6
Consider the contour and associated three-dimensional graph of Is the point at which and a relative maximum point, a relative minimum point, or a saddle point?
A) saddle point
B) relative maximum
C) relative minimum
Is the point at which and a relative maximum point, a relative minimum point, or a saddle point? A) saddle point
B) relative maximum
C) relative minimum
Unlock Deck
Unlock for access to all 50 flashcards in this deck.
Unlock Deck
k this deck
7
Milk proteins are sometimes added to sausage to reduce shrinking due to cooking loss and improve the texture of the sausage. Suppose the cooking loss (expressed as a percentage of initial weight) can be modeled by percent, where w is the proportion of whey protein and s is the proportion of skim milk powder. Determine whether the function L has a relative maximum, relative minimum, or a saddle point, and find the corresponding proportions of whey protein and skim milk powder at that point. Round your answer to the nearest hundredth of a percent.
A) relative maximum
Whey protein: 5.62%
Skim milk powder: 5.04%
B) relative minimum
Whey protein: 5.62%
Skim milk powder: 5.04%
C) relative maximum
Whey protein: 19.83%
Skim milk powder: 17.78%
D) relative maximum
Whey protein: 17.78%
Skim milk powder: 19.83%
E) saddle point
Whey protein: 17.78%
Skim milk powder: 19.83%
percent, where w is the proportion of whey protein and s is the proportion of skim milk powder. Determine whether the function L has a relative maximum, relative minimum, or a saddle point, and find the corresponding proportions of whey protein and skim milk powder at that point. Round your answer to the nearest hundredth of a percent.A) relative maximum
Whey protein: 5.62%
Skim milk powder: 5.04%
B) relative minimum
Whey protein: 5.62%
Skim milk powder: 5.04%
C) relative maximum
Whey protein: 19.83%
Skim milk powder: 17.78%
D) relative maximum
Whey protein: 17.78%
Skim milk powder: 19.83%
E) saddle point
Whey protein: 17.78%
Skim milk powder: 19.83%
Unlock Deck
Unlock for access to all 50 flashcards in this deck.
Unlock Deck
k this deck
8
A process to extract pigment from sunflower seeds involves washing the sunflower heads in heated water. Suppose the percentage of pigment that can be removed from the sunflower head by washing for 20 minutes is percent, where r is the amount of milliliters of water per gram of sunflower used for washing and is the water temperature. Is the critical point of P a maximum, minimum or saddle point?
A) maximum
B) minimum
C) saddle point
D) cannot be determined
percent, where r is the amount of milliliters of water per gram of sunflower used for washing and is the water temperature. Is the critical point of P a maximum, minimum or saddle point?A) maximum
B) minimum
C) saddle point
D) cannot be determined
Unlock Deck
Unlock for access to all 50 flashcards in this deck.
Unlock Deck
k this deck
9
Consider the following contour graph and three-dimensional graph for a function F with inputs x and y. On the basis of the graphs approximate the inputs and output of each critical point in the form
A) relative maximum: none
Relative minimum: (1,1,-5)
Saddle point: (0,0,0)
B) relative maximum: none
Relative minimum: (1,1,-1)
Saddle point: (0,0,0)
C) relative maximum: none
Relative minimum: (1,1,-1)
Saddle point: (0,0,-1)
D) relative maximum: (1,1,-1)
Relative minimum: (-3,-3,-75)
Saddle point: (0,0,-1)
E) relative maximum: (0,0,0)
Relative minimum: (1,1,-1)
Saddle point: none
Unlock Deck
Unlock for access to all 50 flashcards in this deck.
Unlock Deck
k this deck
10
Fatty acids are liberated from a fat mixture through a chemical process called hydrolysis. Suppose the number of fatty acids per 100 grams of water can be modeled by grams, where the pH of the fat mixture is and the temperature is Find the pH and temperature that maximize the amount of fatty acid. Round your answers to two decimal place.
A) pH: 4.12
Temperature:
B) pH: 6.22
Temperature:
C) pH: 0.71
Temperature:
D) pH: 6.34
Temperature:
E) pH: 6.06
Temperature:
grams, where the pH of the fat mixture is and the temperature is Find the pH and temperature that maximize the amount of fatty acid. Round your answers to two decimal place.A) pH: 4.12
Temperature:
B) pH: 6.22
Temperature:
C) pH: 0.71
Temperature:
D) pH: 6.34
Temperature:
E) pH: 6.06
Temperature:
Unlock Deck
Unlock for access to all 50 flashcards in this deck.
Unlock Deck
k this deck
11
Is the point and on the contour graph below a relative maximum point, a relative minimum point, or a saddle point?
A) relative minimum
B) relative maximum
C) saddle point
and on the contour graph below a relative maximum point, a relative minimum point, or a saddle point? A) relative minimum
B) relative maximum
C) saddle point
Unlock Deck
Unlock for access to all 50 flashcards in this deck.
Unlock Deck
k this deck
12
Locate and classify any critical points.
A) , saddle point , relative minimum point
B) , saddle point , relative minimum point
C) , saddle point , relative minimum point
D) , saddle point , relative minimum point
E) , saddle point , relative maximum point
A)
, saddle point , relative minimum pointB)
, saddle point , relative minimum pointC)
, saddle point , relative minimum pointD)
, saddle point , relative minimum pointE)
, saddle point , relative maximum point Unlock Deck
Unlock for access to all 50 flashcards in this deck.
Unlock Deck
k this deck
13
Suppose the table shows the average price of certain produce, in cents per pound, for selected months and years. Locate all critical points in the table and identify each point as a relative maximum point, relative minimum point, or a saddle point.
A) relative maximum point(s): (May 1995); (May 1998)
Relative minimum point(s): (May1996)
Saddle point(s): (March 1996)
B) relative maximum point(s) (May 1995)
Relative minimum point(s): (April 1994) and (June 1994)
Saddle point(s): (March 1996)
C) relative maximum point(s): (May 1995); (May 1998); (March 1999)
Relative minimum point(s): (February 1994); (April 1995); (June 1994); (May 1996); (February 1997); (June 1997)
Saddle point(s): (March 1994); (May 1994); (February 1995); (June 1995); (March 1996); (June 1998)
D) relative maximum point(s): (May 1995)
Relative minimum point(s): (April 1994) and (June 1994)
Saddle point(s): (March 1994); (May 1994); (February 1995); (June 1995); (March 1996); (June 1998)
E) none of these
Unlock Deck
Unlock for access to all 50 flashcards in this deck.
Unlock Deck
k this deck
14
The consistometer table gives the consistency of applesauce as a function of the number of months the raw apples were stored and the temperature at which they were blanched. The consistometer value is a measure of how far (in centimeters) an amount of applesauce flows down a vertical surface in 30 seconds. Sketch the contour curves on the table for the consistometer values of 2.8 and 3.2.
A)
B)
C)
D)
E)
A)
B)
C)
D)
E)
Unlock Deck
Unlock for access to all 50 flashcards in this deck.
Unlock Deck
k this deck
15
Suppose that is the production function for a product with x units of one input and y units of a second input. Find the values of x and y that will maximize production.
A)
B)
C)
D)
E)
is the production function for a product with x units of one input and y units of a second input. Find the values of x and y that will maximize production.A)
B)
C)
D)
E)
Unlock Deck
Unlock for access to all 50 flashcards in this deck.
Unlock Deck
k this deck
16
Consider the contour graph and the three-dimensional graph for the function R, given below. What critical point is represented by the point A on the contour map?
A) relative maximum
B) saddle point
C) global maximum
D) relative minimum
E) not a critical point
A) relative maximum
B) saddle point
C) global maximum
D) relative minimum
E) not a critical point
Unlock Deck
Unlock for access to all 50 flashcards in this deck.
Unlock Deck
k this deck
17
Test for relative maxima and minima.
A) saddle point at
B) saddle point at
C) saddle point at
D) relative minimum at
E) relative minimum at
A) saddle point at
B) saddle point at
C) saddle point at
D) relative minimum at
E) relative minimum at
Unlock Deck
Unlock for access to all 50 flashcards in this deck.
Unlock Deck
k this deck
18
Suppose table shows the average price of bananas, in cents per pound, for selected months and years. Locate all relative maximum points, minimum points, and saddle points.
A) none of these
B) relative maximum point(s): (July 1998); (June 1999); (August 1999)
Relative minimum points(s): (July 1994); (September 1994); (May 1997)
Saddle point(s): (June 1997); (August 1997)
C) relative maximum point(s): (August, 1995); (June 1996)
Relative minimum points(s): (July 1997); (May 1999); (July 1999); (September 1999)
Saddle point(s): (May 1998); (September 1998)
D) relative maximum point(s): (June 1996)
Relative minimum points(s): (July 1997)
Saddle point(s): (June 1997); (August 1997)
E) relative maximum point(s): (August, 1995); (June 1996); (July 1998)
Relative minimum points(s): (July 1997)
Saddle point(s): (June 1997); (August 1997)
Unlock Deck
Unlock for access to all 50 flashcards in this deck.
Unlock Deck
k this deck
19
A nursery sells mulch by the truckload. Bark mulch sells for $b per load and pine straw sells for $p per load. The nursery's average weekly profit form the sale of these two types of mulch can be modeled by the equation dollars. To the nearest dollar, what is the maximum weekly profit from the sales of these two types of mulch?
A) $2,635
B) $3,559
C) $1,734
D) $6,372
E) $10,524
dollars. To the nearest dollar, what is the maximum weekly profit from the sales of these two types of mulch?A) $2,635
B) $3,559
C) $1,734
D) $6,372
E) $10,524
Unlock Deck
Unlock for access to all 50 flashcards in this deck.
Unlock Deck
k this deck
20
Test for relative maxima and minima.
A) relative minimum at
B) relative maximum at
C) relative minimum at
D) relative maximum at
E) relative minimum at
A) relative minimum at
B) relative maximum at
C) relative minimum at
D) relative maximum at
E) relative minimum at
Unlock Deck
Unlock for access to all 50 flashcards in this deck.
Unlock Deck
k this deck
21
A travel agency offers spring-break cruise packages. The agency advertises a cruise to Cancun, Mexico, for $1200 per person. In order to promote the cruise among student organizations on campus, the agency offers a discount for student groups selling the cruise to over 50 of their members. The price per student will be discounted by $10 for each student in excess of 50. For example, if an organization had 55 members go on the cruise, each of those 55 students would pay . Write a model for revenue as a multivariable function of the number of students in excess of 50 and the price per student.
A) dollars
B) dollars
C) dollars
D) dollars
E) dollars
. Write a model for revenue as a multivariable function of the number of students in excess of 50 and the price per student.A)
dollarsB)
dollarsC)
dollarsD)
dollarsE)
dollars Unlock Deck
Unlock for access to all 50 flashcards in this deck.
Unlock Deck
k this deck
22
A small percent of homes in an region lack certain amenities. The data is given in the table below. Give the linear model of the best fitting line , where x is the number of years since 1984.
A)
B)
C)
D)
E)
, where x is the number of years since 1984. A)
B)
C)
D)
E)
Unlock Deck
Unlock for access to all 50 flashcards in this deck.
Unlock Deck
k this deck
23
Write the Lagrange system of partial derivative equations.
A)
B)
C)
D)
E)
A)
B)
C)
D)
E)
Unlock Deck
Unlock for access to all 50 flashcards in this deck.
Unlock Deck
k this deck
24
Locate the optimal point of the constrained system.
A)
B)
C)
D)
E)
A)
B)
C)
D)
E)
Unlock Deck
Unlock for access to all 50 flashcards in this deck.
Unlock Deck
k this deck
25
The daily output at a plant manufacturing transistor radios is approximated by the function radios, where L is the size of the labor force measured in hundreds of worker hours and K is the capital investment in thousands of dollars. Suppose the plant manager has a daily budget of $18,000 to be invested in capital or spent on labor and that the average wage of an employee at the radio plant is $7.00 per hour. What combination of worker hours and capital expenditures will yield the maximum daily production? Round your answers to the nearest integer.
A) labor-hours
B) labor-hours
C) labor-hours
D) labor-hours
E) labor-hours
radios, where L is the size of the labor force measured in hundreds of worker hours and K is the capital investment in thousands of dollars. Suppose the plant manager has a daily budget of $18,000 to be invested in capital or spent on labor and that the average wage of an employee at the radio plant is $7.00 per hour. What combination of worker hours and capital expenditures will yield the maximum daily production? Round your answers to the nearest integer.A)
labor-hours B)
labor-hours C)
labor-hours D)
labor-hours E)
labor-hours Unlock Deck
Unlock for access to all 50 flashcards in this deck.
Unlock Deck
k this deck
26
Let be the SSE function for the best fitting line of the data below. A student calculated that the minimum of f occurs at . Based on this calculation, what is the linear function that best fits the data?
A)
B)
C)
D)
E)
be the SSE function for the best fitting line of the data below. A student calculated that the minimum of f occurs at . Based on this calculation, what is the linear function that best fits the data? A)
B)
C)
D)
E)
Unlock Deck
Unlock for access to all 50 flashcards in this deck.
Unlock Deck
k this deck
27
Let be the SSE function for the best fitting line of the data below. Find the minimum value of Round your answer to four decimal places.
A) 0.000
B) 0.0006
C) 0.0188
D) 0.8466
E) 0.6648
be the SSE function for the best fitting line of the data below. Find the minimum value of Round your answer to four decimal places. A) 0.000
B) 0.0006
C) 0.0188
D) 0.8466
E) 0.6648
Unlock Deck
Unlock for access to all 50 flashcards in this deck.
Unlock Deck
k this deck
28
A travel agency offers spring-break cruise packages. The agency advertises a cruise to Cancun, Mexico, for $1200 per person. In order to promote the cruise among student organizations on campus, the agency offers a discount for student groups selling the cruise to over 50 of their members. The price per student will be discounted by $10 for each student in excess of 50. For example, if an organization had 55 members go on the cruise, each of those 55 students would pay . Write a constraint function in terms of the number of students in excess of 50 and the price.
A)
B)
C)
D)
E)
. Write a constraint function in terms of the number of students in excess of 50 and the price.A)
B)
C)
D)
E)
Unlock Deck
Unlock for access to all 50 flashcards in this deck.
Unlock Deck
k this deck
29
Identify the optimal point as either a maximum point or a minimum point.
A) (0, 16, 16) constrained minimum
(5)333, 10.667, 606.815) constrained maximum
B) (0, 16, 0) constrained minimum
(606.815, 5.333, 10.667) constrained maximum
C) (16, 16, 0) constrained minimum
(10)667, 606.815, 5.333) constrained maximum
D) (0, 16, 0) constrained minimum
(10)667, 5.333, 606.815) constrained maximum
E) (0, 10, 0) constrained minimum
(10)667, 606.815, 5.333) constrained maximum
Unlock Deck
Unlock for access to all 50 flashcards in this deck.
Unlock Deck
k this deck
30
The figures show a contour graph for a function f in blue with a constraint function in black. Locate any optimal points of and classify each as a relative maximum point or a relative minimum point.
A) (31, 10, 4)
B) (32, 14, 2)
C) (35, 16, 2)
D) (32, 16, 2)
E) (35, 18, 2)
in black. Locate any optimal points of and classify each as a relative maximum point or a relative minimum point. A) (31, 10, 4)
B) (32, 14, 2)
C) (35, 16, 2)
D) (32, 16, 2)
E) (35, 18, 2)
Unlock Deck
Unlock for access to all 50 flashcards in this deck.
Unlock Deck
k this deck
31
Express SSE as a multivariable function of a and b for the best fitting line Use the data below.
A)
B)
C)
D)
E)
Use the data below. A)
B)
C)
D)
E)
Unlock Deck
Unlock for access to all 50 flashcards in this deck.
Unlock Deck
k this deck
32
A company has the Cobb-Douglas production function , where x is the number of units of labor, y is the number of units of capital, and z is the units of production. Suppose labor costs $200 per unit, capital costs $200 per unit, and the total cost of labor and capital is limited to $400000. Find the number of units of labor and the number of units of capital that maximize production.
A) units of labor; units of capital
B) units of labor; units of capital
C) units of labor; units of capital
D) units of labor; units of capital
E) units of labor; units of capital
, where x is the number of units of labor, y is the number of units of capital, and z is the units of production. Suppose labor costs $200 per unit, capital costs $200 per unit, and the total cost of labor and capital is limited to $400000. Find the number of units of labor and the number of units of capital that maximize production.A)
units of labor; units of capitalB)
units of labor; units of capitalC)
units of labor; units of capitalD)
units of labor; units of capitalE)
units of labor; units of capital Unlock Deck
Unlock for access to all 50 flashcards in this deck.
Unlock Deck
k this deck
33
For a region, the percentage of adults 20-24 years of age that have not been married is given in the table below. Use the method of least squares to find the multivariable function f with inputs a and b for the best fitting line where x is the number of years since 1970.
A)
B)
C)
D)
E)
where x is the number of years since 1970. A)
B)
C)
D)
E)
Unlock Deck
Unlock for access to all 50 flashcards in this deck.
Unlock Deck
k this deck
34
A model for the elevation above sea level of a tract of farmland is feet above sea level, where e is the distance in miles east of the western fence and n is the distance in miles north of the southern fence. One critical point is Use the Determinant Test to classify it as a maximum, minimum, or saddle point.
A) relative maximum
B) relative minimum
C) saddle point
D) cannot be determined
feet above sea level, where e is the distance in miles east of the western fence and n is the distance in miles north of the southern fence. One critical point is Use the Determinant Test to classify it as a maximum, minimum, or saddle point.A) relative maximum
B) relative minimum
C) saddle point
D) cannot be determined
Unlock Deck
Unlock for access to all 50 flashcards in this deck.
Unlock Deck
k this deck
35
Express SSE as a multivariable function of a and b for the best fitting line Use the data below.
A)
B)
C)
D)
E)
Use the data below. A)
B)
C)
D)
E)
Unlock Deck
Unlock for access to all 50 flashcards in this deck.
Unlock Deck
k this deck
36
A fitness center is trying to determine how to allocate funds for advertising. The manager decides to advertise on the radio and in the newspaper. Previous experience with such advertising leads the manager to expect responses when r adds are run on the radio and n adds appear in the newspaper. Each ad on the radio costs $13 and each newspaper ad costs $3. Using Lagrange multipliers, a student found that when $504 are budgeted for advertising, the maximum number of responses occurred from 26 radio ad and 56 newspaper ads and had Suppose the manager budgeted an additional $22 for advertising. What is the approximate change in the optimal value as a result of this change in the constraint level?
A) 2,710 additional response
B) 484 additional responses
C) 22 additional responses
D) 367 additional responses
E) 1 additional response
responses when r adds are run on the radio and n adds appear in the newspaper. Each ad on the radio costs $13 and each newspaper ad costs $3. Using Lagrange multipliers, a student found that when $504 are budgeted for advertising, the maximum number of responses occurred from 26 radio ad and 56 newspaper ads and had Suppose the manager budgeted an additional $22 for advertising. What is the approximate change in the optimal value as a result of this change in the constraint level?A) 2,710 additional response
B) 484 additional responses
C) 22 additional responses
D) 367 additional responses
E) 1 additional response
Unlock Deck
Unlock for access to all 50 flashcards in this deck.
Unlock Deck
k this deck
37
A rancher removed 200 feet of wire fencing from a field on his ranch. He wants to reuse the fencing to create a rectangular corral into which he will build a 6-foot-wide wooden gate. The dimensions of the corral with the greatest possible area are found using the multivariable functions for the amount of fencing and for the resulting area of the corral: feet is the amount of fencing needed for the specified rectangular corral of width w feet and length l feet. The area of the specified corral is where w feet is the width and l feet is the length. Write the multivariable function to be maximized.
A)
B)
C)
D)
E)
where w feet is the width and l feet is the length. Write the multivariable function to be maximized.A)
B)
C)
D)
E)
Unlock Deck
Unlock for access to all 50 flashcards in this deck.
Unlock Deck
k this deck
38
A manufacture is designing a packaging carton for shipping. The carton will be a box with a fixed volume of v cubic feet. The cost to construct each box is dollars, where the box is l feet long and w feet wide. Suppose M is the minimum cost and is the constraint equation, and for Estimate the minimum cost if the constraint curve equation is
A)
B)
C)
D)
E)
dollars, where the box is l feet long and w feet wide. Suppose M is the minimum cost and is the constraint equation, and for Estimate the minimum cost if the constraint curve equation is A)
B)
C)
D)
E)
Unlock Deck
Unlock for access to all 50 flashcards in this deck.
Unlock Deck
k this deck
39
The figures show a contour graph for a function f in blue with a constraint function in black. Estimate any optimal points for the system Classify each constrained optimal point as a maximum or a minimum.
A) (28, 21, 4.5): constrained minimum
B) (24, 20, 4.5): constrained minimum
C) (25, 21, 4.5): constrained minimum
D) (28, 20, 5.5): constrained maximum
E) (25, 24,3.5): constrained maximum
in black. Estimate any optimal points for the system Classify each constrained optimal point as a maximum or a minimum. A) (28, 21, 4.5): constrained minimum
B) (24, 20, 4.5): constrained minimum
C) (25, 21, 4.5): constrained minimum
D) (28, 20, 5.5): constrained maximum
E) (25, 24,3.5): constrained maximum
Unlock Deck
Unlock for access to all 50 flashcards in this deck.
Unlock Deck
k this deck
40
Let be the SSE function for the best fitting line of the data below. Find and .
A)
B)
C)
D)
E)
be the SSE function for the best fitting line of the data below. Find and . A)
B)
C)
D)
E)
Unlock Deck
Unlock for access to all 50 flashcards in this deck.
Unlock Deck
k this deck
41
The table shows the number of days that some food will keep as a function of the temperature. Use the method of least squares to find the best-fitting linear model for the data. Give your coefficients to two decimal places.
A)
B)
C)
D)
E)
A)
B)
C)
D)
E)
Unlock Deck
Unlock for access to all 50 flashcards in this deck.
Unlock Deck
k this deck
42
The table below gives the number of inches of precipitation that fell in a city in the given months. Give the linear model that best fits the data, where x is 1 in January, 2 in February, and 3 in March. Give the coefficients to two decimal places.
A)
B)
C)
D)
E)
that best fits the data, where x is 1 in January, 2 in February, and 3 in March. Give the coefficients to two decimal places. A)
B)
C)
D)
E)
Unlock Deck
Unlock for access to all 50 flashcards in this deck.
Unlock Deck
k this deck
43
The table below gives the number of inches of precipitation that fell in a city in the given months. Use the method of least squares to find the multivariable function f with inputs a and b for the best fitting line where x is 1 in January, 2 in February, and 3 in March. What is the minimum value of Give your answer to two decimal places.
A) 0.00
B) 1.35
C) 42.18
D) 0.07
E) 0.15
where x is 1 in January, 2 in February, and 3 in March. What is the minimum value of Give your answer to two decimal places. A) 0.00
B) 1.35
C) 42.18
D) 0.07
E) 0.15
Unlock Deck
Unlock for access to all 50 flashcards in this deck.
Unlock Deck
k this deck
44
Consider the table showing the numbers of infants born to each of five generations in a certain family. Change the data so that they represent the generation and natural log of the infants. Use the method of least squares to find the best fitting linear model for the changed data where x represents the generation. You should keep the data in the form and should not round the values until the final calculation. Give your coefficients to four decimal places.
A)
B)
C)
D)
E)
and should not round the values until the final calculation. Give your coefficients to four decimal places. A)
B)
C)
D)
E)
Unlock Deck
Unlock for access to all 50 flashcards in this deck.
Unlock Deck
k this deck
45
For a region, the percentage of adults 20-24 years of age how have not been married is given in the table below. The percentage of adults 20-24 years old who had never been married in 1960 was 37. Add this data point and use technology to find a linear model. What is the percentage of adults 20-24 years old in 2000 who have never been married, according to this model? Round your answer to the nearest integer.
A) 84%
B) 85%
C) 88%
D) 82%
E) 86%
The percentage of adults 20-24 years old who had never been married in 1960 was 37. Add this data point and use technology to find a linear model. What is the percentage of adults 20-24 years old in 2000 who have never been married, according to this model? Round your answer to the nearest integer.A) 84%
B) 85%
C) 88%
D) 82%
E) 86%
Unlock Deck
Unlock for access to all 50 flashcards in this deck.
Unlock Deck
k this deck
46
A factory makes 7-mm aluminum ball bearings. Company planners have determined how much it costs them to make certain numbers of cases of ball bearings in a single run. These costs are shown in the table below. The line of best fit for this data is Find the sum of the squares of the deviations. Give your answer to four decimal places.
A) 17.0012
B) 0.1452
C) 0.0100
D) 65.6179
E) 0.1000
Find the sum of the squares of the deviations. Give your answer to four decimal places. A) 17.0012
B) 0.1452
C) 0.0100
D) 65.6179
E) 0.1000
Unlock Deck
Unlock for access to all 50 flashcards in this deck.
Unlock Deck
k this deck
47
The table below gives the number of inches of precipitation that fell in a city in the given months. Use the method of least squares to find the multivariable function f with inputs a and b for the best fitting line where x is 1 in January, 2 in February, and 3 in March.
A)
B)
C)
D)
E)
where x is 1 in January, 2 in February, and 3 in March. A)
B)
C)
D)
E)
Unlock Deck
Unlock for access to all 50 flashcards in this deck.
Unlock Deck
k this deck
48
Before technology was available to fit many kinds of models to data, researchers and others were restricted to using linear models. Because exponential data are common in many fields of study, it has always been important to be able to fit an exponential model to data. Consider the table showing past and predicted populations for a region. Change the data so that they represent the year and natural log of the population. Use the method of least squares to find the best fitting linear model for the changed data where x represents the year. You should keep the data in the form and should not round the values until the final calculation. Give your coefficients to four decimal places.
A)
B)
C)
D)
E)
and should not round the values until the final calculation. Give your coefficients to four decimal places. A)
B)
C)
D)
E)
Unlock Deck
Unlock for access to all 50 flashcards in this deck.
Unlock Deck
k this deck
49
For a region, the percentage of adults 20-24 years of age that have not been married is given in the table below. Give the linear model that best fits this data, where x is the number of years since 1970.
A)
B)
C)
D)
E)
that best fits this data, where x is the number of years since 1970. A)
B)
C)
D)
E)
Unlock Deck
Unlock for access to all 50 flashcards in this deck.
Unlock Deck
k this deck
50
The number of animal experiments in a country declined between 1970 and 1980. The numbers for selected years are shown in the table. Use the method of least squares to find the best-fitting linear model for the data. Let correspond to 1970. Round your coefficients to two decimal places.
A)
B)
C)
D)
E)
correspond to 1970. Round your coefficients to two decimal places. A)
B)
C)
D)
E)
Unlock Deck
Unlock for access to all 50 flashcards in this deck.
Unlock Deck
k this deck
Unlock Deck
Unlock for access to all 50 flashcards in this deck.


