Exam 8: Analyzing Multivariable Change: Optimization
Exam 1: Ingredients of Change: Functions an Limits50 Questions
Exam 2: Describing Change: Rates47 Questions
Exam 3: Determining Change: Derivatives48 Questions
Exam 4: Analyzing Change: Applications of Derivatives50 Questions
Exam 5: Accumulating Change: Limits of Sums and the Definite Integral50 Questions
Exam 6: Analyzing Accumulated Change: Integrals in Action51 Questions
Exam 7: Ingredients of Multivariable Change: Models, Graphs, Rates46 Questions
Exam 8: Analyzing Multivariable Change: Optimization50 Questions
Select questions type
Suppose table shows the average price of bananas, in cents per pound, for selected months and years. Locate all relative maximum points, minimum points, and saddle points. 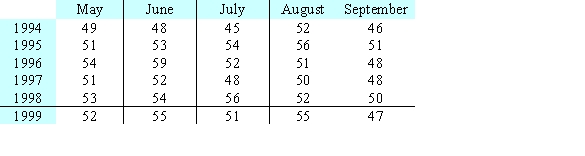
Free
(Multiple Choice)
4.9/5  (25)
(25)
Correct Answer: Verified
E
The consistometer table gives the consistency of applesauce as a function of the number of months the raw apples were stored and the temperature at which they were blanched. The consistometer value is a measure of how far (in centimeters) an amount of applesauce flows down a vertical surface in 30 seconds. Sketch the contour curves on the table for the consistometer values of 2.8 and 3.2. 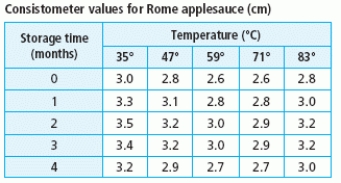
Free
(Multiple Choice)
4.9/5 (45)
Correct Answer:Verified
E
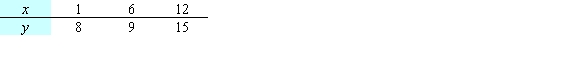
The number of animal experiments in a country declined between 1970 and 1980. The numbers for selected years are shown in the table. Use the method of least squares to find the best-fitting linear model for the data. Let  correspond to 1970. Round your coefficients to two decimal places.
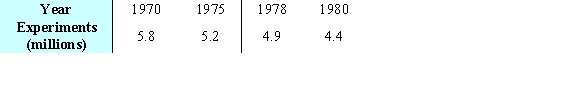
Free
(Multiple Choice)
4.9/5 (33)
Correct Answer:Verified
D
The table below gives the number of inches of precipitation that fell in a city in the given months. Use the method of least squares to find the multivariable function f with inputs a and b for the best fitting line  where x is 1 in January, 2 in February, and 3 in March. What is the minimum value of
  Give your answer to two decimal places.
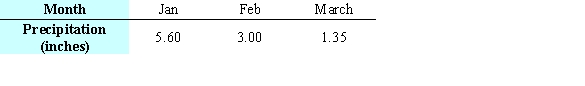
(Multiple Choice)
4.9/5 (36)
Identify the optimal point as either a maximum point or a minimum point. 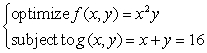
(Multiple Choice)
4.9/5 (38)
The table below gives the number of inches of precipitation that fell in a city in the given months. Give the linear model  that best fits the data, where x is 1 in January, 2 in February, and 3 in March. Give the coefficients to two decimal places.
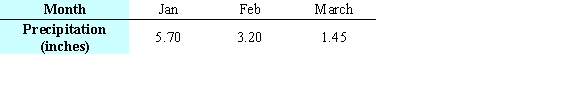
(Multiple Choice)
4.9/5 (37)
Suppose the table shows the average price of certain produce, in cents per pound, for selected months and years. Locate all critical points in the table and identify each point as a relative maximum point, relative minimum point, or a saddle point. 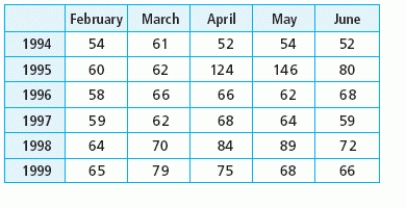
(Multiple Choice)
4.8/5 (38)
Before technology was available to fit many kinds of models to data, researchers and others were restricted to using linear models. Because exponential data are common in many fields of study, it has always been important to be able to fit an exponential model to data. Consider the table showing past and predicted populations for a region. Change the data so that they represent the year and natural log of the population. Use the method of least squares to find the best fitting linear model for the changed data where x represents the year. You should keep the data in the form  and should not round the values until the final calculation. Give your coefficients to four decimal places.
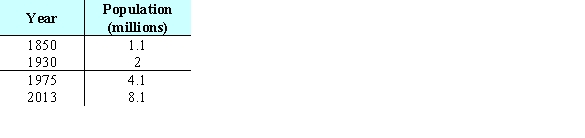
(Multiple Choice)
4.8/5 (34)
The figures show a contour graph for a function f in blue with a constraint function  in black. Estimate any optimal points for the system
  Classify each constrained optimal point as a maximum or a minimum.
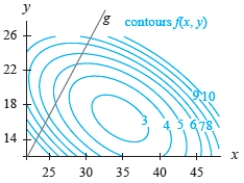
(Multiple Choice)
4.8/5 (29)
A travel agency offers spring-break cruise packages. The agency advertises a cruise to Cancun, Mexico, for $1200 per person. In order to promote the cruise among student organizations on campus, the agency offers a discount for student groups selling the cruise to over 50 of their members. The price per student will be discounted by $10 for each student in excess of 50. For example, if an organization had 55 members go on the cruise, each of those 55 students would pay  . Write a model for revenue as a multivariable function of the number of students in excess of 50 and the price per student.
(Multiple Choice)
4.7/5 (31)
A small percent of homes in an region lack certain amenities. The data is given in the table below. Give the linear model of the best fitting line  , where x is the number of years since 1984.
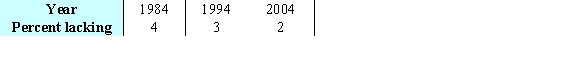
(Multiple Choice)
4.9/5 (37)
Suppose that 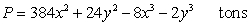 is the production function for a product with x units of one input and y units of a second input. Find the values of x and y that will maximize production.
(Multiple Choice)
4.8/5 (31)
A factory makes 7-mm aluminum ball bearings. Company planners have determined how much it costs them to make certain numbers of cases of ball bearings in a single run. These costs are shown in the table below. The line of best fit for this data is 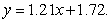 Find the sum of the squares of the deviations. Give your answer to four decimal places.
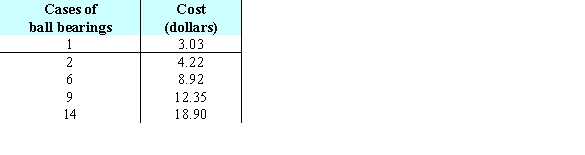
(Multiple Choice)
4.8/5 (34)
A manufacture is designing a packaging carton for shipping. The carton will be a box with a fixed volume of v cubic feet. The cost to construct each box is 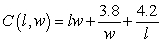 dollars, where the box is l feet long and w feet wide. Suppose M is the minimum cost and
 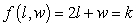 is the constraint equation, and
  for
for  Estimate the minimum cost if the constraint curve equation is
(Multiple Choice)
4.9/5 (40)
Consider the contour graph and the three-dimensional graph for the function R, given below. What critical point is represented by the point A on the contour map? 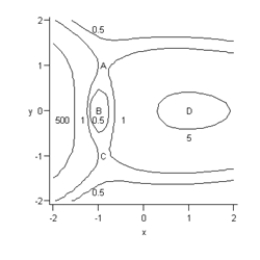
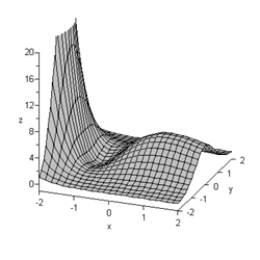
(Multiple Choice)
4.8/5 (27)
Consider the table showing the numbers of infants born to each of five generations in a certain family. Change the data so that they represent the generation and natural log of the infants. Use the method of least squares to find the best fitting linear model for the changed data where x represents the generation. You should keep the data in the form  and should not round the values until the final calculation. Give your coefficients to four decimal places.
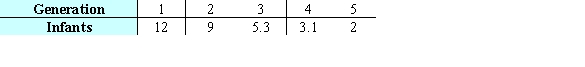
(Multiple Choice)
4.9/5 (43)
Let  be the SSE function for the best fitting line
  of the data below. Find
  and
and  .
. 
(Multiple Choice)
4.8/5 (36)
A process to extract pigment from sunflower seeds involves washing the sunflower heads in heated water. Suppose the percentage of pigment that can be removed from the sunflower head by washing for 20 minutes is  percent, where r is the amount of milliliters of water per gram of sunflower used for washing and
  is the water temperature. Is the critical point of P a maximum, minimum or saddle point?
(Multiple Choice)
4.8/5 (28)
A company has the Cobb-Douglas production function  , where x is the number of units of labor, y is the number of units of capital, and z is the units of production. Suppose labor costs $200 per unit, capital costs $200 per unit, and the total cost of labor and capital is limited to $400000. Find the number of units of labor and the number of units of capital that maximize production.
(Multiple Choice)
4.8/5 (33)
Filters
- Essay(0)
- Multiple Choice(0)
- Short Answer(0)
- True False(0)
- Matching(0)