Deck 5: Accumulating Change: Limits of Sums and the Definite Integral
Full screen (f)
Question
Given the graph of f(t) 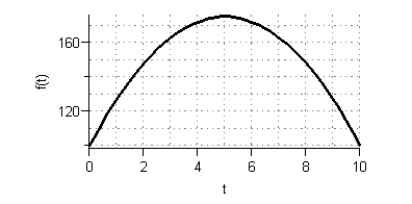 Sketch a graph of the accumulation function using four seconds as the starting point.
A)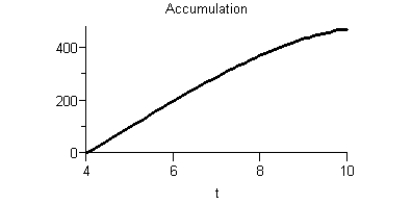
B)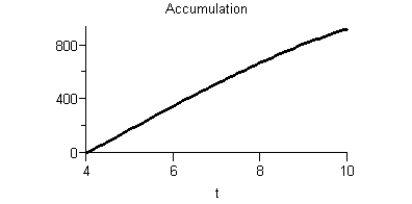
C)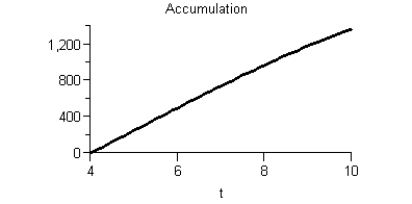
D)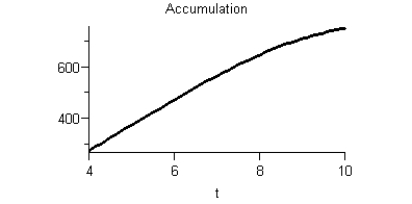
E)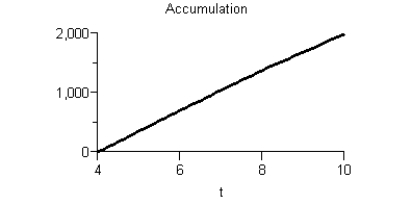
Sketch a graph of the accumulation function using four seconds as the starting point.A)
B)
C)
D)
E)
Question
Consider the graph of f(t). 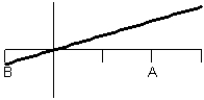 What does the graph of the accumulation function
  look like?
A)
B)
C)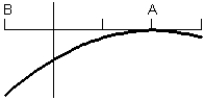
D)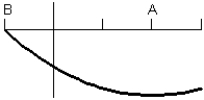
E)
What does the graph of the accumulation function look like?A)
B)
C)
D)
E)
Question
Consider the graph of f(t).  What does the graph of the accumulation function
  look like?
A)
B)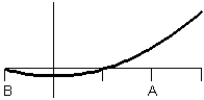
C)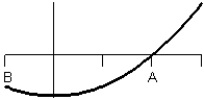
D)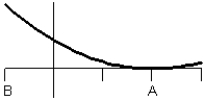
E)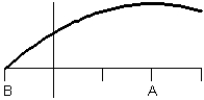
What does the graph of the accumulation function look like?A)
B)
C)
D)
E)
Question
Scientists can model the change in snow depth per day. The graph below shows a model using equivalent centimeters of water per day form April 1 to June 9. Estimate, to the nearest centimeter, the area of the region beneath the curve from May 12 (day 42) to June 9 (day 70). Interpret your answer. 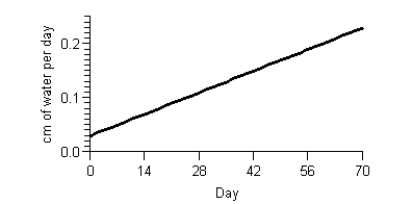
A) Between May 12 (day 42) and June 9 (day 70), there was snowfall equivalent to approximately 3 centimeters of water.
B) Between May 12 (day 42) and June 9 (day 70), there was snowfall equivalent to approximately 5 centimeters of water.
C) Between May 12 (day 42) and June 9 (day 70), each day there was snowfall equivalent to approximately 5 centimeters of water.
D) Between May 12 (day 42) and June 9 (day 70), each day there was snowfall equivalent to approximately 3 centimeters of water.
E) Between May 12 (day 42) and June 9 (day 70), there was snowfall equivalent to approximately 2 centimeters of water.
Question
Suppose the graph shows the energy usage in megawatts for one day for a large university campus. The daily energy consumption for the campus is measured in megawatt-hours and is found by calculating the area of the region between the graph and the horizontal axis. Estimate, to the nearest 10 megawatt-hours, the daily energy consumption using four left rectangles. 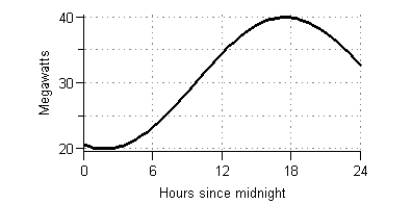
A) 710 megawatt-hours
B) 790 megawatt-hours
C) 910 megawatt-hours
D) 480 megawatt-hours
E) 150 megawatt-hours
A) 710 megawatt-hours
B) 790 megawatt-hours
C) 910 megawatt-hours
D) 480 megawatt-hours
E) 150 megawatt-hours
Question
Using data from the U.S. Bureau of the Census, the model 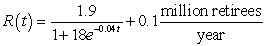 gives the projected rate of change in the number of people within one year of retirement, where t is the number of years since 1940, for the years between 1940 and 2050. Use the equation and ten midpoint rectangles to estimate, to four decimal places, the change in the population within one year of retirement or older from the end of 2037 through the end of 2042.
A) 10.0000 million retirees
B) 7.6075 million retirees
C) 7.5896 million retirees
D) 7.6608 million retirees
E) 7.6783 million retirees
gives the projected rate of change in the number of people within one year of retirement, where t is the number of years since 1940, for the years between 1940 and 2050. Use the equation and ten midpoint rectangles to estimate, to four decimal places, the change in the population within one year of retirement or older from the end of 2037 through the end of 2042.A) 10.0000 million retirees
B) 7.6075 million retirees
C) 7.5896 million retirees
D) 7.6608 million retirees
E) 7.6783 million retirees
Question
Consider the graph of r(t), the rate of change in the price of a technology stock, during the first 55 days of trading of 2003. Using the information present below, label each region as representing positive or negative change in price. 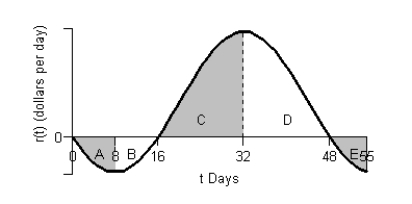

A)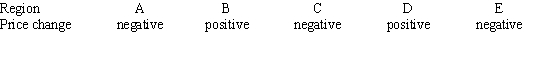
B)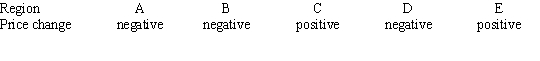
C)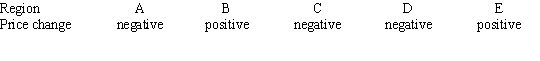
D)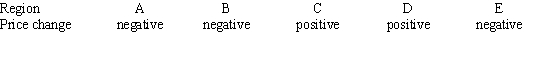
E)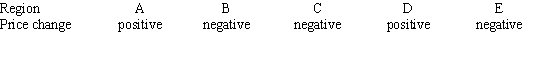
A)
B)
C)
D)
E)
Question
Suppose the rate of change of the percentage of low-birthweight babies (less than 5 pounds 8 ounces) in 2000 can be modeled by 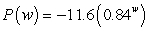 percentage points per pound when the mother gains w pounds during pregnancy. The model is valid for the weights between 18 and 43 pounds. Estimate, to two decimal places, the area of the region between the graph of P and the w-axis from
  to
to  using 5 midpoint rectangles. Interpret your answer.
A) In 2000, there was a 12.41% decrease in the number of low-birthweight babies whose mothers gained between 18 and 43 pounds.
B) In 2000, there was a 6.60% increase in the number of low-birthweight babies whose mothers gained between 18 and 43 pounds.
C) In 2000, there was a 4.27% decrease in the number of low-birthweight babies whose mothers gained between 18 and 43 pounds.
D) In 2000, there was a 3.58% increase in the number of low-birthweight babies whose mothers gained between 18 and 43 pounds.
E) In 2000, there was a 2.76% decrease in the number of low-birthweight babies whose mothers gained between 18 and 43 pounds.
percentage points per pound when the mother gains w pounds during pregnancy. The model is valid for the weights between 18 and 43 pounds. Estimate, to two decimal places, the area of the region between the graph of P and the w-axis from to using 5 midpoint rectangles. Interpret your answer.A) In 2000, there was a 12.41% decrease in the number of low-birthweight babies whose mothers gained between 18 and 43 pounds.
B) In 2000, there was a 6.60% increase in the number of low-birthweight babies whose mothers gained between 18 and 43 pounds.
C) In 2000, there was a 4.27% decrease in the number of low-birthweight babies whose mothers gained between 18 and 43 pounds.
D) In 2000, there was a 3.58% increase in the number of low-birthweight babies whose mothers gained between 18 and 43 pounds.
E) In 2000, there was a 2.76% decrease in the number of low-birthweight babies whose mothers gained between 18 and 43 pounds.
Question
Suppose the graph shows the energy usage in megawatts for one day for a large university campus. The daily energy consumption for the campus is measured in megawatt-hours and is found by calculating the area of the region between the graph and the horizontal axis. Estimate, to the nearest 10 megawatt-hours, the daily energy consumption using eight right rectangles. 
A) 760 megawatt-hours
B) 730 megawatt-hours
C) 830 megawatt-hours
D) 790 megawatt-hours
E) 1050 megawatt-hours
A) 760 megawatt-hours
B) 730 megawatt-hours
C) 830 megawatt-hours
D) 790 megawatt-hours
E) 1050 megawatt-hours
Question
The function  gives the rate of change of profit for a new business during its first year. The input is the number of months since the business opened, and the output units are millions of dollars per month. What is the interpretation, in context, of the accumulation function
 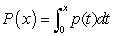 ?
?
A) is how fast the profit, in millions of dollars, is changing at x months.
B) is the number of months it will take to make x millions of dollars.
C) is the amount of profit, in millions of dollars, the business made in month x.
D) is the amount of profit, in millions of dollars, the business made after month x in its first year.
E) is the amount of profit, in millions of dollars, the business has made in its first x months.
gives the rate of change of profit for a new business during its first year. The input is the number of months since the business opened, and the output units are millions of dollars per month. What is the interpretation, in context, of the accumulation function ?A)
is how fast the profit, in millions of dollars, is changing at x months.B)
is the number of months it will take to make x millions of dollars.C)
is the amount of profit, in millions of dollars, the business made in month x.D)
is the amount of profit, in millions of dollars, the business made after month x in its first year.E)
is the amount of profit, in millions of dollars, the business has made in its first x months. Question
A program to protect a species of endangered bird is to be phased out by the year 2020. An environmental group has projected the rate of change in the bird population between 2000 and 2020 as shown in the figure below. 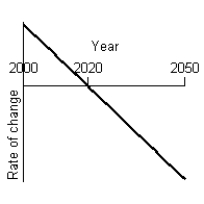 Given that projection, what will a graph of the bird population between 2000 and 2050 look like, using the the following information:
  At the beginning of 2000 there were 1.1 million birds in existence.
  The species will be extinct by 2050.
A)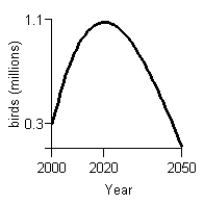
B)
C)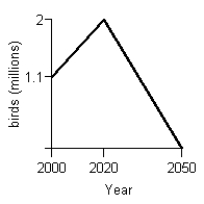
D)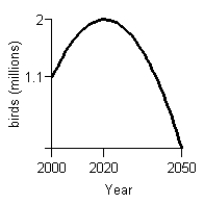
E)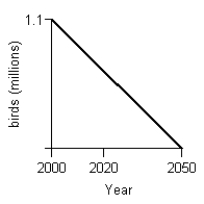
Given that projection, what will a graph of the bird population between 2000 and 2050 look like, using the the following information: At the beginning of 2000 there were 1.1 million birds in existence. The species will be extinct by 2050.A)
B)
C)
D)
E)
Question
Consider the graph of f(t). 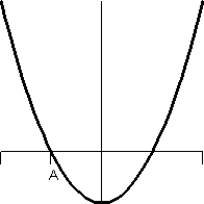 What does the graph of the accumulation function
  look like?
A)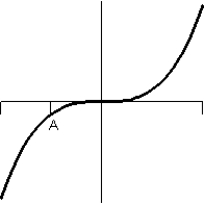
B)
C)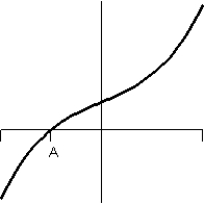
D)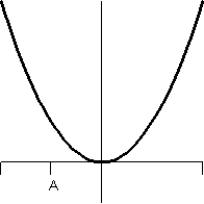
E)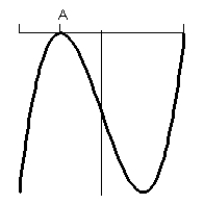
What does the graph of the accumulation function look like?A)
B)
C)
D)
E)
Question
The graph of  represents the rate of change of rainfall during a severe thunderstorm t hours after rainfall began. Draw a graph of the total amount of rain that fell during this storm, using the following facts:
  The rainfall started at 2 P.M. and did not stop until 8 P.M.
  2 inches of rain fell between 2 P.M. and 5 P.M.
  The total amount of rain that fell during the storm was 5.2 inches.
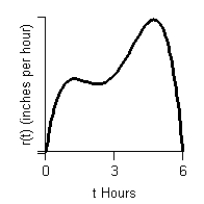
A)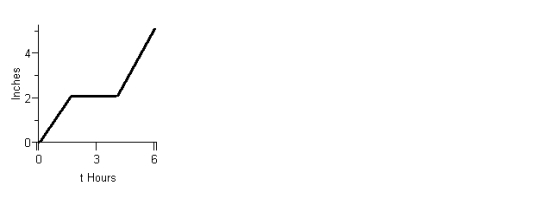
B)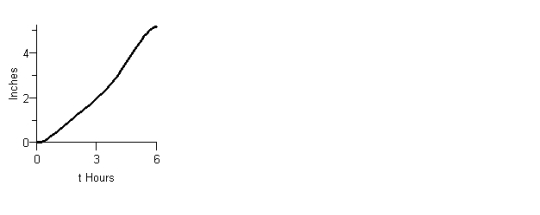
C)
D)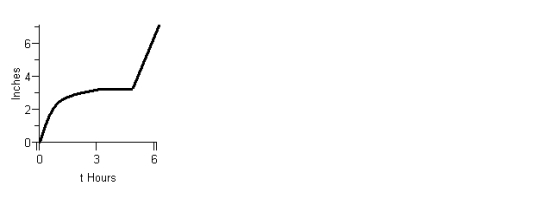
E)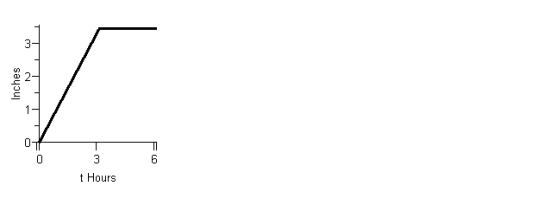
represents the rate of change of rainfall during a severe thunderstorm t hours after rainfall began. Draw a graph of the total amount of rain that fell during this storm, using the following facts: The rainfall started at 2 P.M. and did not stop until 8 P.M. 2 inches of rain fell between 2 P.M. and 5 P.M. The total amount of rain that fell during the storm was 5.2 inches. A)
B)
C)
D)
E)
Question
Suppose the rate of change of the per capita consumption of cottage cheese in the United States between 1980 and 1999 can be modeled by the function 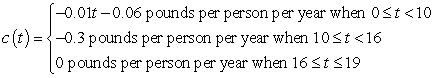 where t is the number of years since 1980. Find the area of the region between the graph and the horizontal axis between
  and
and  . Round your answer to three decimal places.
A) 0.700 pound
B) 2.600 pounds
C) 3.400 pounds
D) 2.900 pounds
E) 9.661 pounds
where t is the number of years since 1980. Find the area of the region between the graph and the horizontal axis between and . Round your answer to three decimal places.A) 0.700 pound
B) 2.600 pounds
C) 3.400 pounds
D) 2.900 pounds
E) 9.661 pounds
Question
Consider the graph of the function: 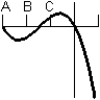 Identify, from the graphs a through f, the derivative graph and the accumulation graph (with point A as the starting point).
a: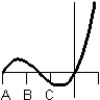 b:
b: 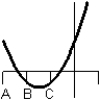 c:
c: 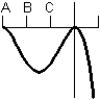 d:
d: 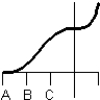 e:
e: 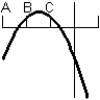 f:
f: 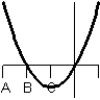
A) The derivative is graph a and the accumulation graph is graph b.
B) The derivative is graph e and the accumulation graph is graph c.
C) The derivative is graph c and the accumulation graph is graph e.
D) The derivative is graph d and the accumulation graph is graph a.
E) The derivative is graph c and the accumulation graph is graph d.
Identify, from the graphs a through f, the derivative graph and the accumulation graph (with point A as the starting point). a:
b: c: d: e: f: A) The derivative is graph a and the accumulation graph is graph b.
B) The derivative is graph e and the accumulation graph is graph c.
C) The derivative is graph c and the accumulation graph is graph e.
D) The derivative is graph d and the accumulation graph is graph a.
E) The derivative is graph c and the accumulation graph is graph d.
Question
The rate of change of the weight of a laboratory mouse can be modeled by the equation  grams per week where t is the age of the mouse in weeks and
  .
.
Use limit of sums to estimate .
.
A) 17.9 grams
B) 7.8 grams
C) 0.8 grams
D) 13.8 grams
E) 37.3 grams
grams per week where t is the age of the mouse in weeks and .Use limit of sums to estimate
.A) 17.9 grams
B) 7.8 grams
C) 0.8 grams
D) 13.8 grams
E) 37.3 grams
Question
A table of selected values for a function is given. Also shown are tables of values for the derivative and the accumulation function with 0 as the starting point. Determine which table contains the values of the derivative,  , and which contains the values of the accumulation function,
  . Justify your choice.
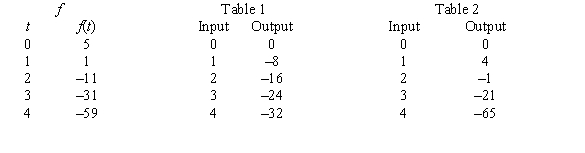
A) Table 1 contains the values of because f is decreasing and the output values are negative.
Table 2 contains the values of because its output is close to the cumulative sum of
  .
.
B) Table 1 contains the values of because f is decreasing and the output values are negative.
Table 2 contains the values of because
  cannot be negative.
C) Table 1 contains the values of because its output is close to the cumulative sum of
  .
.
Table 2 contains the values of because f is decreasing and the output values are negative.
D) Table 1 contains the values of because the sign of the output does not change.
Table 2 contains the values of because the output changes sign.
E) Table 1 contains the values of because the magnitude of the output keeps increasing.
Table 2 contains the values of because the output changes sign.
, and which contains the values of the accumulation function, . Justify your choice. A) Table 1 contains the values of
because f is decreasing and the output values are negative.Table 2 contains the values of
because its output is close to the cumulative sum of .B) Table 1 contains the values of
because f is decreasing and the output values are negative.Table 2 contains the values of
because cannot be negative.C) Table 1 contains the values of
because its output is close to the cumulative sum of .Table 2 contains the values of
because f is decreasing and the output values are negative.D) Table 1 contains the values of
because the sign of the output does not change.Table 2 contains the values of
because the output changes sign.E) Table 1 contains the values of
because the magnitude of the output keeps increasing.Table 2 contains the values of
because the output changes sign. Question
Consider the graph of r(t), the rate of change in the price of a technology stock, during the first 55 days of trading of 2003. Using the information present below, find the graph of the accumulation function starting at day 16. 

A)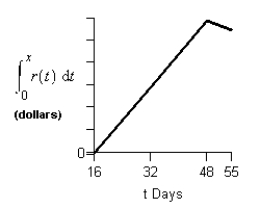
B)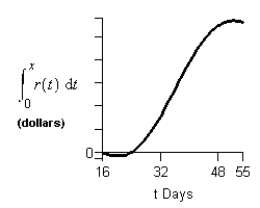
C)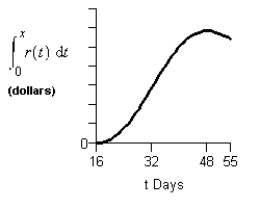
D)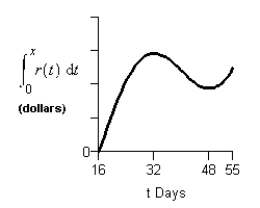
E)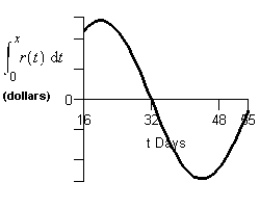
A)
B)
C)
D)
E)
Question
Consider the graph of the function: 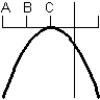 Identify, from the graphs a through f, the derivative graph and the accumulation graph (with point A as the starting point). a:
 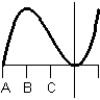 b:
b: 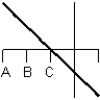 c:
c: 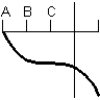 d:
d: 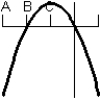 e:
e: 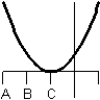 f:
f: 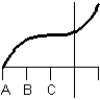
A) The derivative is graph d and the accumulation graph is graph a.
B) The derivative is graph b and the accumulation graph is graph f.
C) The derivative is graph b and the accumulation graph is graph c.
D) The derivative is graph c and the accumulation graph is graph d.
E) The derivative is graph d and the accumulation graph is graph b.
Identify, from the graphs a through f, the derivative graph and the accumulation graph (with point A as the starting point). a: b: c: d: e: f: A) The derivative is graph d and the accumulation graph is graph a.
B) The derivative is graph b and the accumulation graph is graph f.
C) The derivative is graph b and the accumulation graph is graph c.
D) The derivative is graph c and the accumulation graph is graph d.
E) The derivative is graph d and the accumulation graph is graph b.
Question
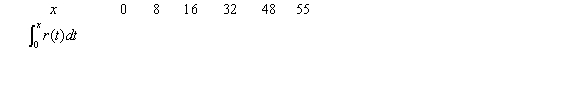
Consider the graph of r(t), the rate of change in the price of a technology stock, during the first 55 days of trading of 2003. Using the information present below, fill in the accumulation function values in the accompanying table. 

A)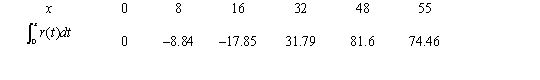
B)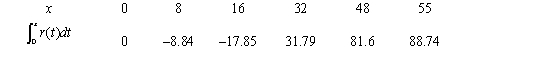
C)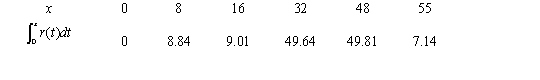
D)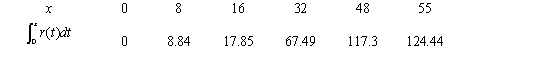
E)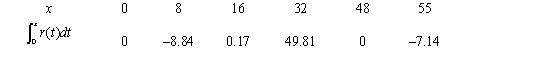
A)
B)
C)
D)
E)
Question
Find the indefinite integral. 
A)
B)
C)
D)
E)
A)
B)
C)
D)
E)
Question
Suppose U.S. factory sales of electronic goods to dealers from 1990 through 2001 can be modeled by the equation Sales  billion dollars
Where x is the number of years since 1990. Use a definite integral to approximate, to four decimal places, the average value of U.S. factory sales of electronic goods to dealers from 1990 through 2001.
A) 65.3150 billion dollars
B) 67.8439 billion dollars
C) 69.9610 billion dollars
D) 66.4599 billion dollars
E) 70.6117 billion dollars
billion dollarsWhere x is the number of years since 1990. Use a definite integral to approximate, to four decimal places, the average value of U.S. factory sales of electronic goods to dealers from 1990 through 2001.
A) 65.3150 billion dollars
B) 67.8439 billion dollars
C) 69.9610 billion dollars
D) 66.4599 billion dollars
E) 70.6117 billion dollars
Question
The cost of producing x units of a certain item is 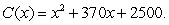 Find the average value of the cost function C(x) over the interval from 0 to 1000. Round answer to nearest penny.
A)
B)
C)
D)
E)
Find the average value of the cost function C(x) over the interval from 0 to 1000. Round answer to nearest penny.A)
B)
C)
D)
E)
Question
Find the area of the shaded region. 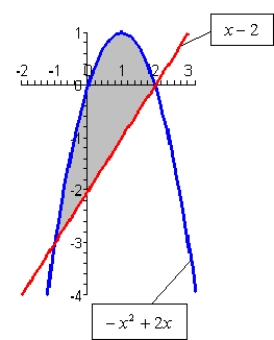
A)
B)
C)
D)
E)
A)
B)
C)
D)
E)
Question
Market revenue for Hammer Inc. (in millions of dollars per year) can be modeled by 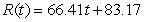 , where
  represents 1990. Evaluate
A) $1,826.59
B) $21,170.55
C) $127,023.30
D) $14,113.70
E) $70,568.50
, where represents 1990. Evaluate A) $1,826.59
B) $21,170.55
C) $127,023.30
D) $14,113.70
E) $70,568.50
Question
Suppose the population of a country between 1921 and 2000 is given by the model Population 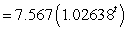 million people
Where t is the number of years since the end of 1900. What was the average population of the country from the beginning of 1990 through the end of 1999? Round your answer to the nearest tenth.
A) 90.5 million people
B) 89.8 million people
C) 39.3 million people
D) 90.0 million people
E) 88.8 million people
million peopleWhere t is the number of years since the end of 1900. What was the average population of the country from the beginning of 1990 through the end of 1999? Round your answer to the nearest tenth.
A) 90.5 million people
B) 89.8 million people
C) 39.3 million people
D) 90.0 million people
E) 88.8 million people
Question
Suppose the number of general aviation aircraft accidents from 1975 through 1997 can be modeled by 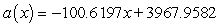 accidents where x is the number of years since 1975. Use a definite integral to estimate, to the nearest accident, the number of accidents that occurred each year from 1978 through 1994.
A) 37,560 accidents
B) 3,509 accidents
C) 2,861 accidents
D) 3,577 accidents
E) 1,754 accidents
accidents where x is the number of years since 1975. Use a definite integral to estimate, to the nearest accident, the number of accidents that occurred each year from 1978 through 1994.A) 37,560 accidents
B) 3,509 accidents
C) 2,861 accidents
D) 3,577 accidents
E) 1,754 accidents
Question
Evaluate the integral 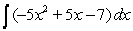 .
.
A)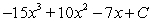
B)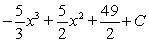
C)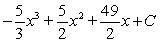
D)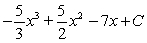
E)
.A)
B)
C)
D)
E)
Question
If possible, find the general antiderivative of 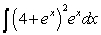 .
.
A) There is no general antiderivative.
B)
C)
D)
E)
.A) There is no general antiderivative.
B)
C)
D)
E)
Question
Find the area of the shaded region. 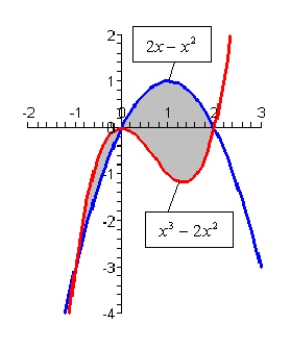
A)
B)
C)
D)
E)
A)
B)
C)
D)
E)
Question
Find  .
. 
A)
B)
C)
D)
E)
. A)
B)
C)
D)
E)
Question
Suppose the population of a country between 1921 and 2000 is given by the model Population  million people
Where t is the number of years since the end of 1900. In what year was the population of the country equal to its 1990s average?
A) 1997
B) 1995
C) 1996
D) 1993
E) 1994
million peopleWhere t is the number of years since the end of 1900. In what year was the population of the country equal to its 1990s average?
A) 1997
B) 1995
C) 1996
D) 1993
E) 1994
Question
A table of selected values for a function is given. Also shown are tables of values for the derivative and the accumulation function with 0 as the starting point. Determine which table contains the values of the derivative,  , and which contains the values of the accumulation function,
  . Justify your choice.
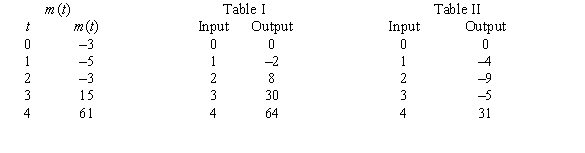
A) Table I contains the values of because m decreases then increases and
  goes from negative to positive.
Table II contains the values of because its output changes sign twice.
B) Table I contains the values of because m decreases then increases and
  goes from negative to positive.
Table II contains the values of because its output is close to the cumulative sum of
  .
.
C) Table I contains the values of because magnitude of the output keeps increasing.
Table II contains the values of because its output is close to the cumulative sum of
  .
.
D) Table I contains the values of because the magnitude of the output keeps increasing.
Table II contains the values of because m decreases then increases and
  goes from negative to positive.
E) Table I contains the values of because the magnitude of the output keeps increasing.
Table II contains the values of because the output changes sign twice.
, and which contains the values of the accumulation function, . Justify your choice. A) Table I contains the values of
because m decreases then increases and goes from negative to positive.Table II contains the values of
because its output changes sign twice.B) Table I contains the values of
because m decreases then increases and goes from negative to positive.Table II contains the values of
because its output is close to the cumulative sum of .C) Table I contains the values of
because magnitude of the output keeps increasing.Table II contains the values of
because its output is close to the cumulative sum of .D) Table I contains the values of
because the magnitude of the output keeps increasing.Table II contains the values of
because m decreases then increases and goes from negative to positive.E) Table I contains the values of
because the magnitude of the output keeps increasing.Table II contains the values of
because the output changes sign twice. Question
Find the specific antiderivative of  .
. 
A)
B)
C)
D)
E)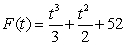
. A)
B)
C)
D)
E)
Question
Suppose the population of a country between 1921 and 2000 is given by the model Population 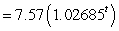 million people
Where t is the number of years since the end of 1900. What was the average rate of change of the population of the country during the 1990s? Round your answer to three decimal places.
A) 6.605 million people per year
B) 1.080 million people per year
C) 9.867 million people per year
D) 18.927 million people per year
E) 2.493 million people per year
million peopleWhere t is the number of years since the end of 1900. What was the average rate of change of the population of the country during the 1990s? Round your answer to three decimal places.
A) 6.605 million people per year
B) 1.080 million people per year
C) 9.867 million people per year
D) 18.927 million people per year
E) 2.493 million people per year
Question
The acceleration of a race car during the first 25 seconds of a road test is modeled by 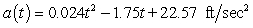 where t is the number of seconds since the test began. Assume the velocity and distance were both zero at the beginning of the road test. Calculate, to three decimal places, the average acceleration during the first 25 seconds of the road test.
A) 1.150 ft/sec2
B) 5.695 ft/sec2
C) 19.930 ft/sec2
D) 4.445 ft/sec2
E) 13.680 ft/sec2
where t is the number of seconds since the test began. Assume the velocity and distance were both zero at the beginning of the road test. Calculate, to three decimal places, the average acceleration during the first 25 seconds of the road test.A) 1.150 ft/sec2
B) 5.695 ft/sec2
C) 19.930 ft/sec2
D) 4.445 ft/sec2
E) 13.680 ft/sec2
Question
Evaluate the integral 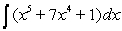 .
.
A)

B)
C)
D)
E)
.A)
B)
C)
D)
E)
Question
Evaluate the integral  .
.
A)
B)
C)
D)
E)
.A)
B)
C)
D)
E)
Question
The acceleration of a race car during the first 35 seconds of a road test is modeled by 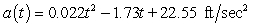 where t is the number of seconds since the test began. Assume the velocity and distance were both zero at the beginning of the road test. Calculate, to three decimal places, the average velocity during the first 35 seconds of the road test.
A) 120.021 ft/sec
B) 169.021 ft/sec
C) 0.005 ft/sec
D) 1.258 ft/sec
E) 386.750 ft/sec
where t is the number of seconds since the test began. Assume the velocity and distance were both zero at the beginning of the road test. Calculate, to three decimal places, the average velocity during the first 35 seconds of the road test.A) 120.021 ft/sec
B) 169.021 ft/sec
C) 0.005 ft/sec
D) 1.258 ft/sec
E) 386.750 ft/sec
Question
Suppose the number of general aviation aircraft accidents from 1975 through 1997 can be modeled by 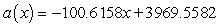 accidents where x is the number of years since 1975. Calculate, to the nearest integer, the average rate of change in the yearly number of accidents from 1977 through 1994.
A) -6 accidents per year
B) -101 accidents per year
C) 2,913 accidents per year
D) 121 accidents per year
E) -121 accidents per year
accidents where x is the number of years since 1975. Calculate, to the nearest integer, the average rate of change in the yearly number of accidents from 1977 through 1994.A) -6 accidents per year
B) -101 accidents per year
C) 2,913 accidents per year
D) 121 accidents per year
E) -121 accidents per year
Question
Evaluate the integral below. Use a graphing calculator to check your answer. 
A)
B)
C)
D)
E)
A)
B)
C)
D)
E)
Question
The federal government standard says that carbon monoxide (CO) levels should not exceed 35-ppm (parts per million) at any time. The concentration of carbon monoxide in the air in a certain metropolitan area can be modeled as  ppm h hours after 7 A.M. Did the city exceed the 35-ppm maximum in the 8 hours between 7 A.M. and 3 P.M? If the answer is yes, give the time when the city first exceeded the 35-ppm maximum.
A) No.
B) Yes, around 8:30 A.M.
C) Yes, around 11 A.M.
D) Yes, around noon.
E) Yes, around 1:30 P.M.
ppm h hours after 7 A.M. Did the city exceed the 35-ppm maximum in the 8 hours between 7 A.M. and 3 P.M? If the answer is yes, give the time when the city first exceeded the 35-ppm maximum.A) No.
B) Yes, around 8:30 A.M.
C) Yes, around 11 A.M.
D) Yes, around noon.
E) Yes, around 1:30 P.M.
Question
Blood pressure varies for individuals throughout the course of a day, typically being the lowest at night and the highest from late morning to early afternoon. The estimated rate of change in diastolic blood pressure for a patient with untreated hypertension is shown in the table. Using a model for the data, estimate to one decimal place, the average rate of change in diastolic blood pressure from noon. to 8 P.M. 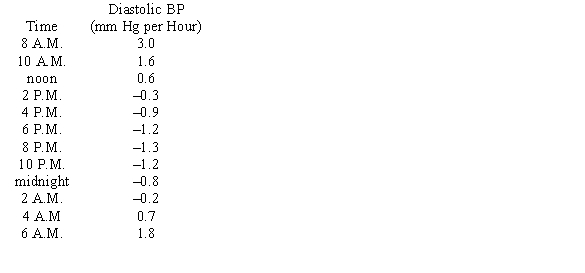
A) -0.9 mm Hg per hour
B) -0.7 mm Hg per hour
C) -0.2 mm Hg per hour
D) -0.4 mm Hg per hour
E) 0.3 mm Hg per hour
A) -0.9 mm Hg per hour
B) -0.7 mm Hg per hour
C) -0.2 mm Hg per hour
D) -0.4 mm Hg per hour
E) 0.3 mm Hg per hour
Question
Blood pressure varies for individuals throughout the course of a day, typically being the lowest at night and the highest from late morning to early afternoon. The estimated rate of change in diastolic blood pressure for a patient with untreated hypertension is shown in the table. Find a model, B(t) for the data, where t is the number of hours since 8 A.M. 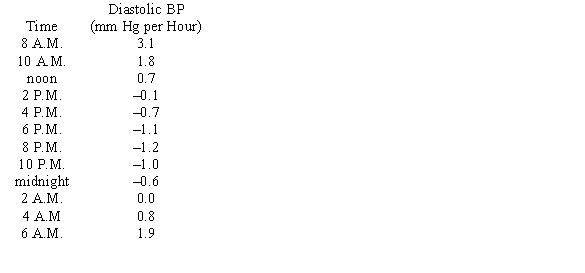
A)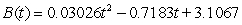
B)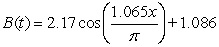
C)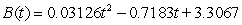
D)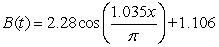
E)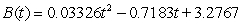
A)
B)
C)
D)
E)
Question
If possible, find the general antiderivative of  .
.
A) There is no general antiderivative.
B)
C)
D)
E)
.A) There is no general antiderivative.
B)
C)
D)
E)
Question
If possible, find the general antiderivative of  .
.
A) There is no general antiderivative.
B)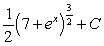
C)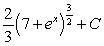
D)
E)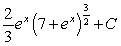
.A) There is no general antiderivative.
B)
C)
D)
E)
Question
In the 1860s and 1870s Nevada experienced a mining boom. Suppose population of a boom town can be modeled by the function 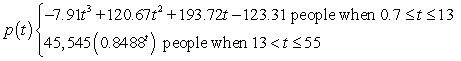 where t is the number of years since 1860. What was the average population of the boom town between 1871 and 1881?
A) 3,692 people
B) 7,386 people
C) 7,076 people
D) 3,769 people
E) 8,869 people
where t is the number of years since 1860. What was the average population of the boom town between 1871 and 1881?A) 3,692 people
B) 7,386 people
C) 7,076 people
D) 3,769 people
E) 8,869 people
Question
The acceleration of a race car during the first 35 seconds of a road test is modeled by 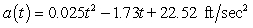 where t is the number of seconds since the test began. Assume the velocity and distance were both zero at the beginning of the road test. Calculate, to the nearest foot, the distance traveled during the first 35 seconds of the road test.
A) 708 ft
B) 259 ft
C) 1,552 ft
D) 4,558 ft
E) 9,071 ft
where t is the number of seconds since the test began. Assume the velocity and distance were both zero at the beginning of the road test. Calculate, to the nearest foot, the distance traveled during the first 35 seconds of the road test.A) 708 ft
B) 259 ft
C) 1,552 ft
D) 4,558 ft
E) 9,071 ft
Question
Between 1956 and 2000, the rate of change of the winning times for the 100-meter butterfly at a world-class swimming competition can be described by 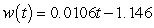 seconds per year, where t is the number of years since 1900. Find, to four decimal places, the average rate of change of the winning times for the competition from 1956 through 2000.
A) 0.5076 seconds per year
B) -0.0154 seconds per year
C) 0.0002 seconds per year
D) 0.0083 seconds per year
E) -0.3192 seconds per year
seconds per year, where t is the number of years since 1900. Find, to four decimal places, the average rate of change of the winning times for the competition from 1956 through 2000.A) 0.5076 seconds per year
B) -0.0154 seconds per year
C) 0.0002 seconds per year
D) 0.0083 seconds per year
E) -0.3192 seconds per year
Question
Find the indefinite integral. 
A)
B)
C)
D)
E)
A)
B)
C)
D)
E)

Unlock Deck
Sign up to unlock the cards in this deck!
Unlock Deck
Unlock Deck
1/50
Play
Full screen (f)
Deck 5: Accumulating Change: Limits of Sums and the Definite Integral
1
Given the graph of f(t) Sketch a graph of the accumulation function using four seconds as the starting point.
A)
B)
C)
D)
E)
Sketch a graph of the accumulation function using four seconds as the starting point.A)
B)
C)
D)
E)
2
Consider the graph of f(t). What does the graph of the accumulation function look like?
A)
B)
C)
D)
E)
What does the graph of the accumulation function look like?A)
B)
C)
D)
E)
3
Consider the graph of f(t). What does the graph of the accumulation function look like?
A)
B)
C)
D)
E)
What does the graph of the accumulation function look like?A)
B)
C)
D)
E)
4
Scientists can model the change in snow depth per day. The graph below shows a model using equivalent centimeters of water per day form April 1 to June 9. Estimate, to the nearest centimeter, the area of the region beneath the curve from May 12 (day 42) to June 9 (day 70). Interpret your answer.
A) Between May 12 (day 42) and June 9 (day 70), there was snowfall equivalent to approximately 3 centimeters of water.
B) Between May 12 (day 42) and June 9 (day 70), there was snowfall equivalent to approximately 5 centimeters of water.
C) Between May 12 (day 42) and June 9 (day 70), each day there was snowfall equivalent to approximately 5 centimeters of water.
D) Between May 12 (day 42) and June 9 (day 70), each day there was snowfall equivalent to approximately 3 centimeters of water.
E) Between May 12 (day 42) and June 9 (day 70), there was snowfall equivalent to approximately 2 centimeters of water.
Unlock Deck
Unlock for access to all 50 flashcards in this deck.
Unlock Deck
k this deck
5
Suppose the graph shows the energy usage in megawatts for one day for a large university campus. The daily energy consumption for the campus is measured in megawatt-hours and is found by calculating the area of the region between the graph and the horizontal axis. Estimate, to the nearest 10 megawatt-hours, the daily energy consumption using four left rectangles.
A) 710 megawatt-hours
B) 790 megawatt-hours
C) 910 megawatt-hours
D) 480 megawatt-hours
E) 150 megawatt-hours
A) 710 megawatt-hours
B) 790 megawatt-hours
C) 910 megawatt-hours
D) 480 megawatt-hours
E) 150 megawatt-hours
Unlock Deck
Unlock for access to all 50 flashcards in this deck.
Unlock Deck
k this deck
6
Using data from the U.S. Bureau of the Census, the model gives the projected rate of change in the number of people within one year of retirement, where t is the number of years since 1940, for the years between 1940 and 2050. Use the equation and ten midpoint rectangles to estimate, to four decimal places, the change in the population within one year of retirement or older from the end of 2037 through the end of 2042.
A) 10.0000 million retirees
B) 7.6075 million retirees
C) 7.5896 million retirees
D) 7.6608 million retirees
E) 7.6783 million retirees
gives the projected rate of change in the number of people within one year of retirement, where t is the number of years since 1940, for the years between 1940 and 2050. Use the equation and ten midpoint rectangles to estimate, to four decimal places, the change in the population within one year of retirement or older from the end of 2037 through the end of 2042.A) 10.0000 million retirees
B) 7.6075 million retirees
C) 7.5896 million retirees
D) 7.6608 million retirees
E) 7.6783 million retirees
Unlock Deck
Unlock for access to all 50 flashcards in this deck.
Unlock Deck
k this deck
7
Consider the graph of r(t), the rate of change in the price of a technology stock, during the first 55 days of trading of 2003. Using the information present below, label each region as representing positive or negative change in price.
A)
B)
C)
D)
E)
A)
B)
C)
D)
E)
Unlock Deck
Unlock for access to all 50 flashcards in this deck.
Unlock Deck
k this deck
8
Suppose the rate of change of the percentage of low-birthweight babies (less than 5 pounds 8 ounces) in 2000 can be modeled by percentage points per pound when the mother gains w pounds during pregnancy. The model is valid for the weights between 18 and 43 pounds. Estimate, to two decimal places, the area of the region between the graph of P and the w-axis from to using 5 midpoint rectangles. Interpret your answer.
A) In 2000, there was a 12.41% decrease in the number of low-birthweight babies whose mothers gained between 18 and 43 pounds.
B) In 2000, there was a 6.60% increase in the number of low-birthweight babies whose mothers gained between 18 and 43 pounds.
C) In 2000, there was a 4.27% decrease in the number of low-birthweight babies whose mothers gained between 18 and 43 pounds.
D) In 2000, there was a 3.58% increase in the number of low-birthweight babies whose mothers gained between 18 and 43 pounds.
E) In 2000, there was a 2.76% decrease in the number of low-birthweight babies whose mothers gained between 18 and 43 pounds.
percentage points per pound when the mother gains w pounds during pregnancy. The model is valid for the weights between 18 and 43 pounds. Estimate, to two decimal places, the area of the region between the graph of P and the w-axis from to using 5 midpoint rectangles. Interpret your answer.A) In 2000, there was a 12.41% decrease in the number of low-birthweight babies whose mothers gained between 18 and 43 pounds.
B) In 2000, there was a 6.60% increase in the number of low-birthweight babies whose mothers gained between 18 and 43 pounds.
C) In 2000, there was a 4.27% decrease in the number of low-birthweight babies whose mothers gained between 18 and 43 pounds.
D) In 2000, there was a 3.58% increase in the number of low-birthweight babies whose mothers gained between 18 and 43 pounds.
E) In 2000, there was a 2.76% decrease in the number of low-birthweight babies whose mothers gained between 18 and 43 pounds.
Unlock Deck
Unlock for access to all 50 flashcards in this deck.
Unlock Deck
k this deck
9
Suppose the graph shows the energy usage in megawatts for one day for a large university campus. The daily energy consumption for the campus is measured in megawatt-hours and is found by calculating the area of the region between the graph and the horizontal axis. Estimate, to the nearest 10 megawatt-hours, the daily energy consumption using eight right rectangles.
A) 760 megawatt-hours
B) 730 megawatt-hours
C) 830 megawatt-hours
D) 790 megawatt-hours
E) 1050 megawatt-hours
A) 760 megawatt-hours
B) 730 megawatt-hours
C) 830 megawatt-hours
D) 790 megawatt-hours
E) 1050 megawatt-hours
Unlock Deck
Unlock for access to all 50 flashcards in this deck.
Unlock Deck
k this deck
10
The function gives the rate of change of profit for a new business during its first year. The input is the number of months since the business opened, and the output units are millions of dollars per month. What is the interpretation, in context, of the accumulation function ?
A) is how fast the profit, in millions of dollars, is changing at x months.
B) is the number of months it will take to make x millions of dollars.
C) is the amount of profit, in millions of dollars, the business made in month x.
D) is the amount of profit, in millions of dollars, the business made after month x in its first year.
E) is the amount of profit, in millions of dollars, the business has made in its first x months.
gives the rate of change of profit for a new business during its first year. The input is the number of months since the business opened, and the output units are millions of dollars per month. What is the interpretation, in context, of the accumulation function ?A)
is how fast the profit, in millions of dollars, is changing at x months.B)
is the number of months it will take to make x millions of dollars.C)
is the amount of profit, in millions of dollars, the business made in month x.D)
is the amount of profit, in millions of dollars, the business made after month x in its first year.E)
is the amount of profit, in millions of dollars, the business has made in its first x months. Unlock Deck
Unlock for access to all 50 flashcards in this deck.
Unlock Deck
k this deck
11
A program to protect a species of endangered bird is to be phased out by the year 2020. An environmental group has projected the rate of change in the bird population between 2000 and 2020 as shown in the figure below. Given that projection, what will a graph of the bird population between 2000 and 2050 look like, using the the following information: At the beginning of 2000 there were 1.1 million birds in existence. The species will be extinct by 2050.
A)
B)
C)
D)
E)
Given that projection, what will a graph of the bird population between 2000 and 2050 look like, using the the following information: At the beginning of 2000 there were 1.1 million birds in existence. The species will be extinct by 2050.A)
B)
C)
D)
E)
Unlock Deck
Unlock for access to all 50 flashcards in this deck.
Unlock Deck
k this deck
12
Consider the graph of f(t). What does the graph of the accumulation function look like?
A)
B)
C)
D)
E)
What does the graph of the accumulation function look like?A)
B)
C)
D)
E)
Unlock Deck
Unlock for access to all 50 flashcards in this deck.
Unlock Deck
k this deck
13
The graph of represents the rate of change of rainfall during a severe thunderstorm t hours after rainfall began. Draw a graph of the total amount of rain that fell during this storm, using the following facts: The rainfall started at 2 P.M. and did not stop until 8 P.M. 2 inches of rain fell between 2 P.M. and 5 P.M. The total amount of rain that fell during the storm was 5.2 inches.
A)
B)
C)
D)
E)
represents the rate of change of rainfall during a severe thunderstorm t hours after rainfall began. Draw a graph of the total amount of rain that fell during this storm, using the following facts: The rainfall started at 2 P.M. and did not stop until 8 P.M. 2 inches of rain fell between 2 P.M. and 5 P.M. The total amount of rain that fell during the storm was 5.2 inches. A)
B)
C)
D)
E)
Unlock Deck
Unlock for access to all 50 flashcards in this deck.
Unlock Deck
k this deck
14
Suppose the rate of change of the per capita consumption of cottage cheese in the United States between 1980 and 1999 can be modeled by the function where t is the number of years since 1980. Find the area of the region between the graph and the horizontal axis between and . Round your answer to three decimal places.
A) 0.700 pound
B) 2.600 pounds
C) 3.400 pounds
D) 2.900 pounds
E) 9.661 pounds
where t is the number of years since 1980. Find the area of the region between the graph and the horizontal axis between and . Round your answer to three decimal places.A) 0.700 pound
B) 2.600 pounds
C) 3.400 pounds
D) 2.900 pounds
E) 9.661 pounds
Unlock Deck
Unlock for access to all 50 flashcards in this deck.
Unlock Deck
k this deck
15
Consider the graph of the function: Identify, from the graphs a through f, the derivative graph and the accumulation graph (with point A as the starting point).
a: b: c: d: e: f:
A) The derivative is graph a and the accumulation graph is graph b.
B) The derivative is graph e and the accumulation graph is graph c.
C) The derivative is graph c and the accumulation graph is graph e.
D) The derivative is graph d and the accumulation graph is graph a.
E) The derivative is graph c and the accumulation graph is graph d.
Identify, from the graphs a through f, the derivative graph and the accumulation graph (with point A as the starting point). a:
b: c: d: e: f: A) The derivative is graph a and the accumulation graph is graph b.
B) The derivative is graph e and the accumulation graph is graph c.
C) The derivative is graph c and the accumulation graph is graph e.
D) The derivative is graph d and the accumulation graph is graph a.
E) The derivative is graph c and the accumulation graph is graph d.
Unlock Deck
Unlock for access to all 50 flashcards in this deck.
Unlock Deck
k this deck
16
The rate of change of the weight of a laboratory mouse can be modeled by the equation grams per week where t is the age of the mouse in weeks and .
Use limit of sums to estimate .
A) 17.9 grams
B) 7.8 grams
C) 0.8 grams
D) 13.8 grams
E) 37.3 grams
grams per week where t is the age of the mouse in weeks and .Use limit of sums to estimate
.A) 17.9 grams
B) 7.8 grams
C) 0.8 grams
D) 13.8 grams
E) 37.3 grams
Unlock Deck
Unlock for access to all 50 flashcards in this deck.
Unlock Deck
k this deck
17
A table of selected values for a function is given. Also shown are tables of values for the derivative and the accumulation function with 0 as the starting point. Determine which table contains the values of the derivative, , and which contains the values of the accumulation function, . Justify your choice.
A) Table 1 contains the values of because f is decreasing and the output values are negative.
Table 2 contains the values of because its output is close to the cumulative sum of .
B) Table 1 contains the values of because f is decreasing and the output values are negative.
Table 2 contains the values of because cannot be negative.
C) Table 1 contains the values of because its output is close to the cumulative sum of .
Table 2 contains the values of because f is decreasing and the output values are negative.
D) Table 1 contains the values of because the sign of the output does not change.
Table 2 contains the values of because the output changes sign.
E) Table 1 contains the values of because the magnitude of the output keeps increasing.
Table 2 contains the values of because the output changes sign.
, and which contains the values of the accumulation function, . Justify your choice. A) Table 1 contains the values of
because f is decreasing and the output values are negative.Table 2 contains the values of
because its output is close to the cumulative sum of .B) Table 1 contains the values of
because f is decreasing and the output values are negative.Table 2 contains the values of
because cannot be negative.C) Table 1 contains the values of
because its output is close to the cumulative sum of .Table 2 contains the values of
because f is decreasing and the output values are negative.D) Table 1 contains the values of
because the sign of the output does not change.Table 2 contains the values of
because the output changes sign.E) Table 1 contains the values of
because the magnitude of the output keeps increasing.Table 2 contains the values of
because the output changes sign. Unlock Deck
Unlock for access to all 50 flashcards in this deck.
Unlock Deck
k this deck
18
Consider the graph of r(t), the rate of change in the price of a technology stock, during the first 55 days of trading of 2003. Using the information present below, find the graph of the accumulation function starting at day 16.
A)
B)
C)
D)
E)
A)
B)
C)
D)
E)
Unlock Deck
Unlock for access to all 50 flashcards in this deck.
Unlock Deck
k this deck
19
Consider the graph of the function: Identify, from the graphs a through f, the derivative graph and the accumulation graph (with point A as the starting point). a: b: c: d: e: f:
A) The derivative is graph d and the accumulation graph is graph a.
B) The derivative is graph b and the accumulation graph is graph f.
C) The derivative is graph b and the accumulation graph is graph c.
D) The derivative is graph c and the accumulation graph is graph d.
E) The derivative is graph d and the accumulation graph is graph b.
Identify, from the graphs a through f, the derivative graph and the accumulation graph (with point A as the starting point). a: b: c: d: e: f: A) The derivative is graph d and the accumulation graph is graph a.
B) The derivative is graph b and the accumulation graph is graph f.
C) The derivative is graph b and the accumulation graph is graph c.
D) The derivative is graph c and the accumulation graph is graph d.
E) The derivative is graph d and the accumulation graph is graph b.
Unlock Deck
Unlock for access to all 50 flashcards in this deck.
Unlock Deck
k this deck
20
Consider the graph of r(t), the rate of change in the price of a technology stock, during the first 55 days of trading of 2003. Using the information present below, fill in the accumulation function values in the accompanying table.
A)
B)
C)
D)
E)
A)
B)
C)
D)
E)
Unlock Deck
Unlock for access to all 50 flashcards in this deck.
Unlock Deck
k this deck
21
Find the indefinite integral.
A)
B)
C)
D)
E)
A)
B)
C)
D)
E)
Unlock Deck
Unlock for access to all 50 flashcards in this deck.
Unlock Deck
k this deck
22
Suppose U.S. factory sales of electronic goods to dealers from 1990 through 2001 can be modeled by the equation Sales billion dollars
Where x is the number of years since 1990. Use a definite integral to approximate, to four decimal places, the average value of U.S. factory sales of electronic goods to dealers from 1990 through 2001.
A) 65.3150 billion dollars
B) 67.8439 billion dollars
C) 69.9610 billion dollars
D) 66.4599 billion dollars
E) 70.6117 billion dollars
billion dollarsWhere x is the number of years since 1990. Use a definite integral to approximate, to four decimal places, the average value of U.S. factory sales of electronic goods to dealers from 1990 through 2001.
A) 65.3150 billion dollars
B) 67.8439 billion dollars
C) 69.9610 billion dollars
D) 66.4599 billion dollars
E) 70.6117 billion dollars
Unlock Deck
Unlock for access to all 50 flashcards in this deck.
Unlock Deck
k this deck
23
The cost of producing x units of a certain item is Find the average value of the cost function C(x) over the interval from 0 to 1000. Round answer to nearest penny.
A)
B)
C)
D)
E)
Find the average value of the cost function C(x) over the interval from 0 to 1000. Round answer to nearest penny.A)
B)
C)
D)
E)
Unlock Deck
Unlock for access to all 50 flashcards in this deck.
Unlock Deck
k this deck
24
Find the area of the shaded region.
A)
B)
C)
D)
E)
A)
B)
C)
D)
E)
Unlock Deck
Unlock for access to all 50 flashcards in this deck.
Unlock Deck
k this deck
25
Market revenue for Hammer Inc. (in millions of dollars per year) can be modeled by , where represents 1990. Evaluate
A) $1,826.59
B) $21,170.55
C) $127,023.30
D) $14,113.70
E) $70,568.50
, where represents 1990. Evaluate A) $1,826.59
B) $21,170.55
C) $127,023.30
D) $14,113.70
E) $70,568.50
Unlock Deck
Unlock for access to all 50 flashcards in this deck.
Unlock Deck
k this deck
26
Suppose the population of a country between 1921 and 2000 is given by the model Population million people
Where t is the number of years since the end of 1900. What was the average population of the country from the beginning of 1990 through the end of 1999? Round your answer to the nearest tenth.
A) 90.5 million people
B) 89.8 million people
C) 39.3 million people
D) 90.0 million people
E) 88.8 million people
million peopleWhere t is the number of years since the end of 1900. What was the average population of the country from the beginning of 1990 through the end of 1999? Round your answer to the nearest tenth.
A) 90.5 million people
B) 89.8 million people
C) 39.3 million people
D) 90.0 million people
E) 88.8 million people
Unlock Deck
Unlock for access to all 50 flashcards in this deck.
Unlock Deck
k this deck
27
Suppose the number of general aviation aircraft accidents from 1975 through 1997 can be modeled by accidents where x is the number of years since 1975. Use a definite integral to estimate, to the nearest accident, the number of accidents that occurred each year from 1978 through 1994.
A) 37,560 accidents
B) 3,509 accidents
C) 2,861 accidents
D) 3,577 accidents
E) 1,754 accidents
accidents where x is the number of years since 1975. Use a definite integral to estimate, to the nearest accident, the number of accidents that occurred each year from 1978 through 1994.A) 37,560 accidents
B) 3,509 accidents
C) 2,861 accidents
D) 3,577 accidents
E) 1,754 accidents
Unlock Deck
Unlock for access to all 50 flashcards in this deck.
Unlock Deck
k this deck
28
Evaluate the integral .
A)
B)
C)
D)
E)
.A)
B)
C)
D)
E)
Unlock Deck
Unlock for access to all 50 flashcards in this deck.
Unlock Deck
k this deck
29
If possible, find the general antiderivative of .
A) There is no general antiderivative.
B)
C)
D)
E)
.A) There is no general antiderivative.
B)
C)
D)
E)
Unlock Deck
Unlock for access to all 50 flashcards in this deck.
Unlock Deck
k this deck
30
Find the area of the shaded region.
A)
B)
C)
D)
E)
A)
B)
C)
D)
E)
Unlock Deck
Unlock for access to all 50 flashcards in this deck.
Unlock Deck
k this deck
31
Find .
A)
B)
C)
D)
E)
. A)
B)
C)
D)
E)
Unlock Deck
Unlock for access to all 50 flashcards in this deck.
Unlock Deck
k this deck
32
Suppose the population of a country between 1921 and 2000 is given by the model Population million people
Where t is the number of years since the end of 1900. In what year was the population of the country equal to its 1990s average?
A) 1997
B) 1995
C) 1996
D) 1993
E) 1994
million peopleWhere t is the number of years since the end of 1900. In what year was the population of the country equal to its 1990s average?
A) 1997
B) 1995
C) 1996
D) 1993
E) 1994
Unlock Deck
Unlock for access to all 50 flashcards in this deck.
Unlock Deck
k this deck
33
A table of selected values for a function is given. Also shown are tables of values for the derivative and the accumulation function with 0 as the starting point. Determine which table contains the values of the derivative, , and which contains the values of the accumulation function, . Justify your choice.
A) Table I contains the values of because m decreases then increases and goes from negative to positive.
Table II contains the values of because its output changes sign twice.
B) Table I contains the values of because m decreases then increases and goes from negative to positive.
Table II contains the values of because its output is close to the cumulative sum of .
C) Table I contains the values of because magnitude of the output keeps increasing.
Table II contains the values of because its output is close to the cumulative sum of .
D) Table I contains the values of because the magnitude of the output keeps increasing.
Table II contains the values of because m decreases then increases and goes from negative to positive.
E) Table I contains the values of because the magnitude of the output keeps increasing.
Table II contains the values of because the output changes sign twice.
, and which contains the values of the accumulation function, . Justify your choice. A) Table I contains the values of
because m decreases then increases and goes from negative to positive.Table II contains the values of
because its output changes sign twice.B) Table I contains the values of
because m decreases then increases and goes from negative to positive.Table II contains the values of
because its output is close to the cumulative sum of .C) Table I contains the values of
because magnitude of the output keeps increasing.Table II contains the values of
because its output is close to the cumulative sum of .D) Table I contains the values of
because the magnitude of the output keeps increasing.Table II contains the values of
because m decreases then increases and goes from negative to positive.E) Table I contains the values of
because the magnitude of the output keeps increasing.Table II contains the values of
because the output changes sign twice. Unlock Deck
Unlock for access to all 50 flashcards in this deck.
Unlock Deck
k this deck
34
Find the specific antiderivative of .
A)
B)
C)
D)
E)
. A)
B)
C)
D)
E)
Unlock Deck
Unlock for access to all 50 flashcards in this deck.
Unlock Deck
k this deck
35
Suppose the population of a country between 1921 and 2000 is given by the model Population million people
Where t is the number of years since the end of 1900. What was the average rate of change of the population of the country during the 1990s? Round your answer to three decimal places.
A) 6.605 million people per year
B) 1.080 million people per year
C) 9.867 million people per year
D) 18.927 million people per year
E) 2.493 million people per year
million peopleWhere t is the number of years since the end of 1900. What was the average rate of change of the population of the country during the 1990s? Round your answer to three decimal places.
A) 6.605 million people per year
B) 1.080 million people per year
C) 9.867 million people per year
D) 18.927 million people per year
E) 2.493 million people per year
Unlock Deck
Unlock for access to all 50 flashcards in this deck.
Unlock Deck
k this deck
36
The acceleration of a race car during the first 25 seconds of a road test is modeled by where t is the number of seconds since the test began. Assume the velocity and distance were both zero at the beginning of the road test. Calculate, to three decimal places, the average acceleration during the first 25 seconds of the road test.
A) 1.150 ft/sec2
B) 5.695 ft/sec2
C) 19.930 ft/sec2
D) 4.445 ft/sec2
E) 13.680 ft/sec2
where t is the number of seconds since the test began. Assume the velocity and distance were both zero at the beginning of the road test. Calculate, to three decimal places, the average acceleration during the first 25 seconds of the road test.A) 1.150 ft/sec2
B) 5.695 ft/sec2
C) 19.930 ft/sec2
D) 4.445 ft/sec2
E) 13.680 ft/sec2
Unlock Deck
Unlock for access to all 50 flashcards in this deck.
Unlock Deck
k this deck
37
Evaluate the integral .
A)
B)
C)
D)
E)
.A)
B)
C)
D)
E)
Unlock Deck
Unlock for access to all 50 flashcards in this deck.
Unlock Deck
k this deck
38
Evaluate the integral .
A)
B)
C)
D)
E)
.A)
B)
C)
D)
E)
Unlock Deck
Unlock for access to all 50 flashcards in this deck.
Unlock Deck
k this deck
39
The acceleration of a race car during the first 35 seconds of a road test is modeled by where t is the number of seconds since the test began. Assume the velocity and distance were both zero at the beginning of the road test. Calculate, to three decimal places, the average velocity during the first 35 seconds of the road test.
A) 120.021 ft/sec
B) 169.021 ft/sec
C) 0.005 ft/sec
D) 1.258 ft/sec
E) 386.750 ft/sec
where t is the number of seconds since the test began. Assume the velocity and distance were both zero at the beginning of the road test. Calculate, to three decimal places, the average velocity during the first 35 seconds of the road test.A) 120.021 ft/sec
B) 169.021 ft/sec
C) 0.005 ft/sec
D) 1.258 ft/sec
E) 386.750 ft/sec
Unlock Deck
Unlock for access to all 50 flashcards in this deck.
Unlock Deck
k this deck
40
Suppose the number of general aviation aircraft accidents from 1975 through 1997 can be modeled by accidents where x is the number of years since 1975. Calculate, to the nearest integer, the average rate of change in the yearly number of accidents from 1977 through 1994.
A) -6 accidents per year
B) -101 accidents per year
C) 2,913 accidents per year
D) 121 accidents per year
E) -121 accidents per year
accidents where x is the number of years since 1975. Calculate, to the nearest integer, the average rate of change in the yearly number of accidents from 1977 through 1994.A) -6 accidents per year
B) -101 accidents per year
C) 2,913 accidents per year
D) 121 accidents per year
E) -121 accidents per year
Unlock Deck
Unlock for access to all 50 flashcards in this deck.
Unlock Deck
k this deck
41
Evaluate the integral below. Use a graphing calculator to check your answer.
A)
B)
C)
D)
E)
A)
B)
C)
D)
E)
Unlock Deck
Unlock for access to all 50 flashcards in this deck.
Unlock Deck
k this deck
42
The federal government standard says that carbon monoxide (CO) levels should not exceed 35-ppm (parts per million) at any time. The concentration of carbon monoxide in the air in a certain metropolitan area can be modeled as ppm h hours after 7 A.M. Did the city exceed the 35-ppm maximum in the 8 hours between 7 A.M. and 3 P.M? If the answer is yes, give the time when the city first exceeded the 35-ppm maximum.
A) No.
B) Yes, around 8:30 A.M.
C) Yes, around 11 A.M.
D) Yes, around noon.
E) Yes, around 1:30 P.M.
ppm h hours after 7 A.M. Did the city exceed the 35-ppm maximum in the 8 hours between 7 A.M. and 3 P.M? If the answer is yes, give the time when the city first exceeded the 35-ppm maximum.A) No.
B) Yes, around 8:30 A.M.
C) Yes, around 11 A.M.
D) Yes, around noon.
E) Yes, around 1:30 P.M.
Unlock Deck
Unlock for access to all 50 flashcards in this deck.
Unlock Deck
k this deck
43
Blood pressure varies for individuals throughout the course of a day, typically being the lowest at night and the highest from late morning to early afternoon. The estimated rate of change in diastolic blood pressure for a patient with untreated hypertension is shown in the table. Using a model for the data, estimate to one decimal place, the average rate of change in diastolic blood pressure from noon. to 8 P.M.
A) -0.9 mm Hg per hour
B) -0.7 mm Hg per hour
C) -0.2 mm Hg per hour
D) -0.4 mm Hg per hour
E) 0.3 mm Hg per hour
A) -0.9 mm Hg per hour
B) -0.7 mm Hg per hour
C) -0.2 mm Hg per hour
D) -0.4 mm Hg per hour
E) 0.3 mm Hg per hour
Unlock Deck
Unlock for access to all 50 flashcards in this deck.
Unlock Deck
k this deck
44
Blood pressure varies for individuals throughout the course of a day, typically being the lowest at night and the highest from late morning to early afternoon. The estimated rate of change in diastolic blood pressure for a patient with untreated hypertension is shown in the table. Find a model, B(t) for the data, where t is the number of hours since 8 A.M.
A)
B)
C)
D)
E)
A)
B)
C)
D)
E)
Unlock Deck
Unlock for access to all 50 flashcards in this deck.
Unlock Deck
k this deck
45
If possible, find the general antiderivative of .
A) There is no general antiderivative.
B)
C)
D)
E)
.A) There is no general antiderivative.
B)
C)
D)
E)
Unlock Deck
Unlock for access to all 50 flashcards in this deck.
Unlock Deck
k this deck
46
If possible, find the general antiderivative of .
A) There is no general antiderivative.
B)
C)
D)
E)
.A) There is no general antiderivative.
B)
C)
D)
E)
Unlock Deck
Unlock for access to all 50 flashcards in this deck.
Unlock Deck
k this deck
47
In the 1860s and 1870s Nevada experienced a mining boom. Suppose population of a boom town can be modeled by the function where t is the number of years since 1860. What was the average population of the boom town between 1871 and 1881?
A) 3,692 people
B) 7,386 people
C) 7,076 people
D) 3,769 people
E) 8,869 people
where t is the number of years since 1860. What was the average population of the boom town between 1871 and 1881?A) 3,692 people
B) 7,386 people
C) 7,076 people
D) 3,769 people
E) 8,869 people
Unlock Deck
Unlock for access to all 50 flashcards in this deck.
Unlock Deck
k this deck
48
The acceleration of a race car during the first 35 seconds of a road test is modeled by where t is the number of seconds since the test began. Assume the velocity and distance were both zero at the beginning of the road test. Calculate, to the nearest foot, the distance traveled during the first 35 seconds of the road test.
A) 708 ft
B) 259 ft
C) 1,552 ft
D) 4,558 ft
E) 9,071 ft
where t is the number of seconds since the test began. Assume the velocity and distance were both zero at the beginning of the road test. Calculate, to the nearest foot, the distance traveled during the first 35 seconds of the road test.A) 708 ft
B) 259 ft
C) 1,552 ft
D) 4,558 ft
E) 9,071 ft
Unlock Deck
Unlock for access to all 50 flashcards in this deck.
Unlock Deck
k this deck
49
Between 1956 and 2000, the rate of change of the winning times for the 100-meter butterfly at a world-class swimming competition can be described by seconds per year, where t is the number of years since 1900. Find, to four decimal places, the average rate of change of the winning times for the competition from 1956 through 2000.
A) 0.5076 seconds per year
B) -0.0154 seconds per year
C) 0.0002 seconds per year
D) 0.0083 seconds per year
E) -0.3192 seconds per year
seconds per year, where t is the number of years since 1900. Find, to four decimal places, the average rate of change of the winning times for the competition from 1956 through 2000.A) 0.5076 seconds per year
B) -0.0154 seconds per year
C) 0.0002 seconds per year
D) 0.0083 seconds per year
E) -0.3192 seconds per year
Unlock Deck
Unlock for access to all 50 flashcards in this deck.
Unlock Deck
k this deck
50
Find the indefinite integral.
A)
B)
C)
D)
E)
A)
B)
C)
D)
E)
Unlock Deck
Unlock for access to all 50 flashcards in this deck.
Unlock Deck
k this deck
Unlock Deck
Unlock for access to all 50 flashcards in this deck.


