Exam 5: Accumulating Change: Limits of Sums and the Definite Integral
Exam 1: Ingredients of Change: Functions an Limits50 Questions
Exam 2: Describing Change: Rates47 Questions
Exam 3: Determining Change: Derivatives48 Questions
Exam 4: Analyzing Change: Applications of Derivatives50 Questions
Exam 5: Accumulating Change: Limits of Sums and the Definite Integral50 Questions
Exam 6: Analyzing Accumulated Change: Integrals in Action51 Questions
Exam 7: Ingredients of Multivariable Change: Models, Graphs, Rates46 Questions
Exam 8: Analyzing Multivariable Change: Optimization50 Questions
Select questions type
Evaluate the integral below. Use a graphing calculator to check your answer. 
Free
(Multiple Choice)
4.7/5  (27)
(27)
Correct Answer: Verified
B
Blood pressure varies for individuals throughout the course of a day, typically being the lowest at night and the highest from late morning to early afternoon. The estimated rate of change in diastolic blood pressure for a patient with untreated hypertension is shown in the table. Find a model, B(t) for the data, where t is the number of hours since 8 A.M. 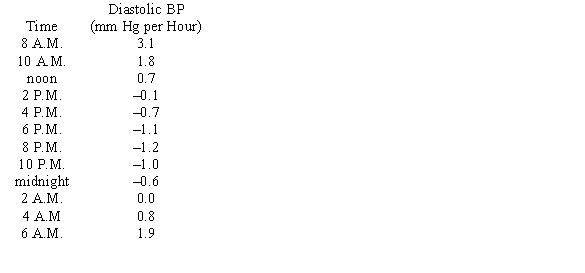
Free
(Multiple Choice)
4.9/5 (40)
Correct Answer:Verified
A
The acceleration of a race car during the first 25 seconds of a road test is modeled by 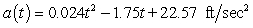 where t is the number of seconds since the test began. Assume the velocity and distance were both zero at the beginning of the road test. Calculate, to three decimal places, the average acceleration during the first 25 seconds of the road test.
Free
(Multiple Choice)
4.8/5 (33)
Correct Answer:Verified
B
Consider the graph of r(t), the rate of change in the price of a technology stock, during the first 55 days of trading of 2003. Using the information present below, find the graph of the accumulation function starting at day 16. 
(Multiple Choice)
4.9/5 (35)
The federal government standard says that carbon monoxide (CO) levels should not exceed 35-ppm (parts per million) at any time. The concentration of carbon monoxide in the air in a certain metropolitan area can be modeled as  ppm h hours after 7 A.M. Did the city exceed the 35-ppm maximum in the 8 hours between 7 A.M. and 3 P.M? If the answer is yes, give the time when the city first exceeded the 35-ppm maximum.
(Multiple Choice)
4.7/5 (34)
A program to protect a species of endangered bird is to be phased out by the year 2020. An environmental group has projected the rate of change in the bird population between 2000 and 2020 as shown in the figure below. 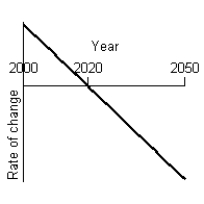 Given that projection, what will a graph of the bird population between 2000 and 2050 look like, using the the following information:
  At the beginning of 2000 there were 1.1 million birds in existence.
  The species will be extinct by 2050.
(Multiple Choice)
4.9/5 (34)
The graph of  represents the rate of change of rainfall during a severe thunderstorm t hours after rainfall began. Draw a graph of the total amount of rain that fell during this storm, using the following facts:
  The rainfall started at 2 P.M. and did not stop until 8 P.M.
  2 inches of rain fell between 2 P.M. and 5 P.M.
  The total amount of rain that fell during the storm was 5.2 inches.
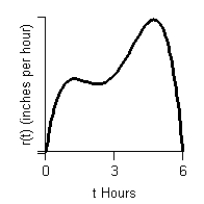
(Multiple Choice)
4.8/5 (39)
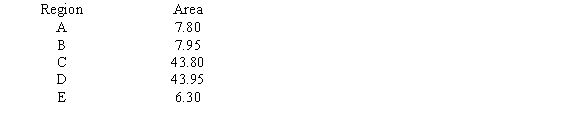
Scientists can model the change in snow depth per day. The graph below shows a model using equivalent centimeters of water per day form April 1 to June 9. Estimate, to the nearest centimeter, the area of the region beneath the curve from May 12 (day 42) to June 9 (day 70). Interpret your answer. 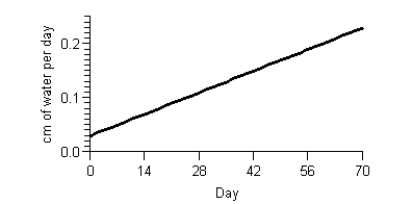
(Multiple Choice)
4.9/5 (44)
The rate of change of the weight of a laboratory mouse can be modeled by the equation  grams per week where t is the age of the mouse in weeks and
  .
Use limit of sums to estimate
.
Use limit of sums to estimate  .
.
(Multiple Choice)
4.9/5 (37)
Consider the graph of f(t).  What does the graph of the accumulation function
  look like?
(Multiple Choice)
4.8/5 (35)
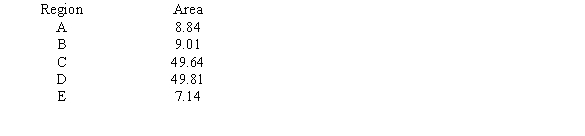
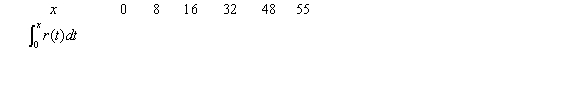
Consider the graph of r(t), the rate of change in the price of a technology stock, during the first 55 days of trading of 2003. Using the information present below, fill in the accumulation function values in the accompanying table. 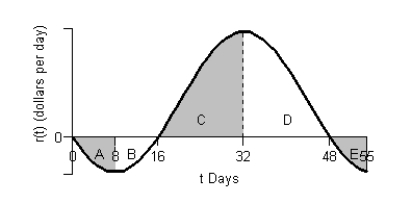
(Multiple Choice)
4.8/5 (29)
The acceleration of a race car during the first 35 seconds of a road test is modeled by 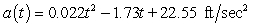 where t is the number of seconds since the test began. Assume the velocity and distance were both zero at the beginning of the road test. Calculate, to three decimal places, the average velocity during the first 35 seconds of the road test.
(Multiple Choice)
4.8/5 (39)
The cost of producing x units of a certain item is 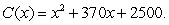 Find the average value of the cost function C(x) over the interval from 0 to 1000. Round answer to nearest penny.
(Multiple Choice)
4.7/5 (33)
Suppose the population of a country between 1921 and 2000 is given by the model Population 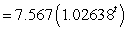 million people
Where t is the number of years since the end of 1900. What was the average population of the country from the beginning of 1990 through the end of 1999? Round your answer to the nearest tenth.
million people
Where t is the number of years since the end of 1900. What was the average population of the country from the beginning of 1990 through the end of 1999? Round your answer to the nearest tenth.
(Multiple Choice)
4.8/5 (37)
Consider the graph of f(t). 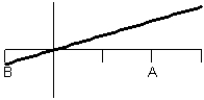 What does the graph of the accumulation function
  look like?
(Multiple Choice)
4.8/5 (40)
Filters
- Essay(0)
- Multiple Choice(0)
- Short Answer(0)
- True False(0)
- Matching(0)