Deck 14: Functions of Several Variables and Partial Differentiation
Full screen (f)
Question
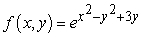
Compute the indicated function value. 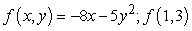
A) -53
B) -29
C) -45
D) -98
A) -53
B) -29
C) -45
D) -98
Question
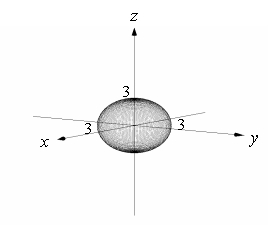
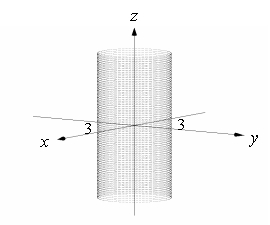
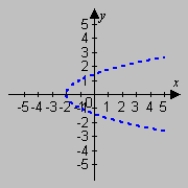
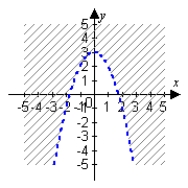
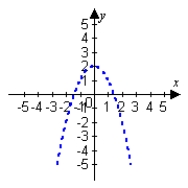
Describe the range of the function. 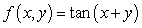
A)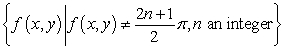
B)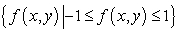
C)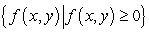
D)
A)
B)
C)
D)
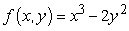
Question
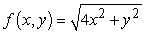
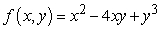
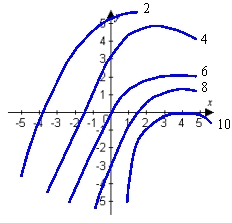
Which of the following is the contour plot of  ?
? 
A)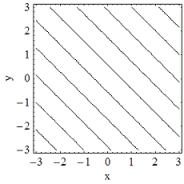
B)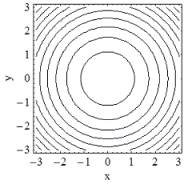
C)
D)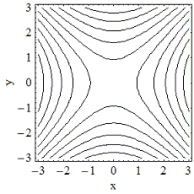
? A)
B)
C)
D)
Question
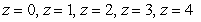
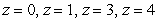
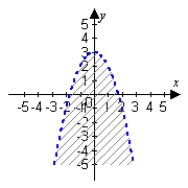
Sketch the indicated traces of 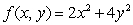 .
. 
. Question
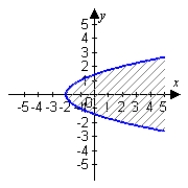
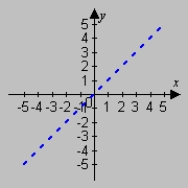
Describe and sketch the domain of the function. 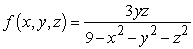
A)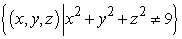
B)
C)
D)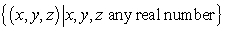
A)
B)
C)
D)
Question
Wind chill is a combination of temperature and wind speed that expresses how cold the air feels. The larger the wind speed, the more rapidly heat is lost to the air and thus the colder it feels. The table shows the wind chill for selected temperatures and wind speeds. For the function  , find
  . Temperature (degrees Fahrenheit)
Wind speed
(mph)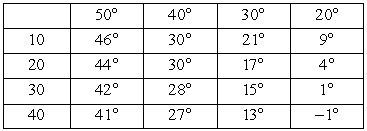
A)
B)
C)
D)
, find . Temperature (degrees Fahrenheit)Wind speed
(mph)
A)
B)
C)
D)
Question
Describe and sketch the domain of the function. 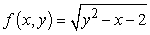
A)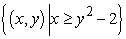
B)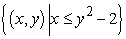
C)
D)

A)
B)
C)
D)
Question
Which of the following is the contour plot of  ?
? 
A)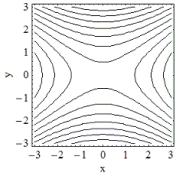
B)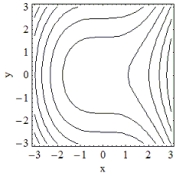
C)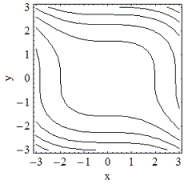
D)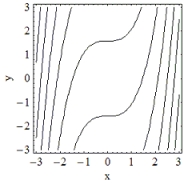
? A)
B)
C)
D)
Question
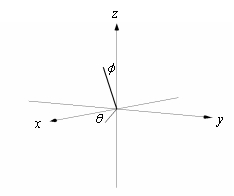
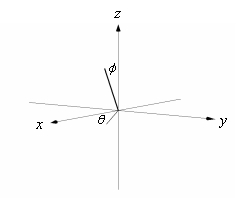
Use a graphing utility to sketch the graph of  . Use the viewpoint
  and
and  (see figure).
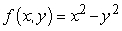

A)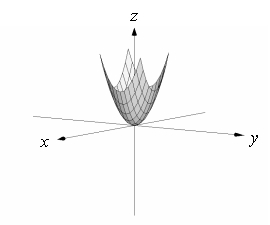
B)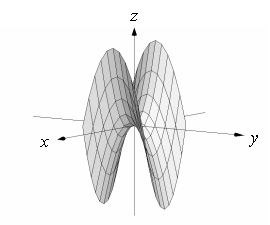
C)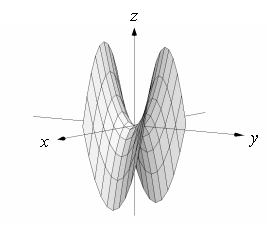
D)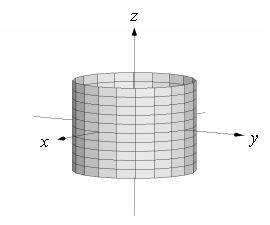
. Use the viewpoint and (see figure). A)
B)
C)
D)
Question
Which of the following is the contour plot of  ?
? 
A)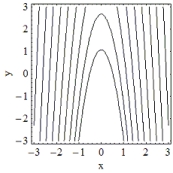
B)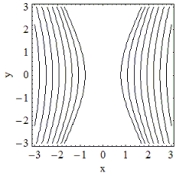
C)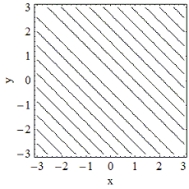
D)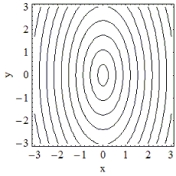
? A)
B)
C)
D)
Question
Describe and sketch the domain of the function. 
A)
B)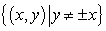
C)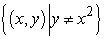
D)

A)
B)
C)
D)
Question
Sketch the indicated traces of 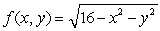 .
. 
. Question
Compute the indicated function value. 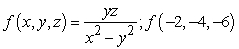
A)
B)
C) -2
D) undefined
A)
B)
C) -2
D) undefined
Question
Use a graphing utility to sketch the graph of  . Use the viewpoint
  and
and  (see figure).
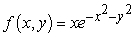
A)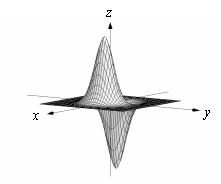
B)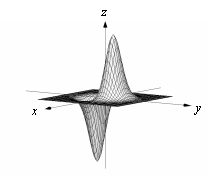
C)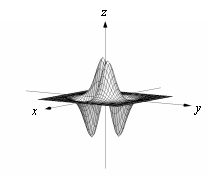
D)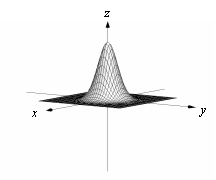
. Use the viewpoint and (see figure). A)
B)
C)
D)
Question
Which of the following is the contour plot of  ?
? 
A)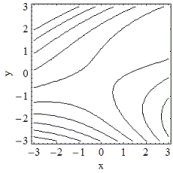
B)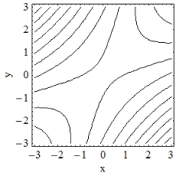
C)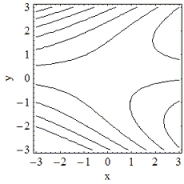
D)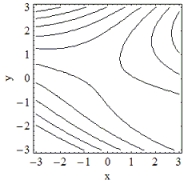
? A)
B)
C)
D)
Question
Describe the range of the function. 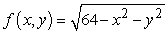
A)
B)
C)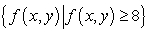
D)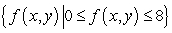
A)
B)
C)
D)
Question
Describe the range of the function. 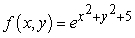
A)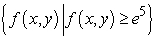
B)
C)
D)
A)
B)
C)
D)
Question
Use a graphing utility to sketch the graph of  . Use the viewpoint
  and
and  (see figure).
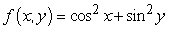
A)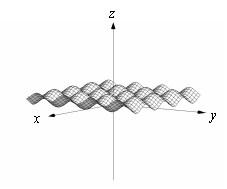
B)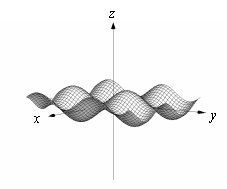
C)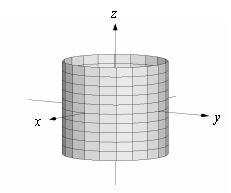
D)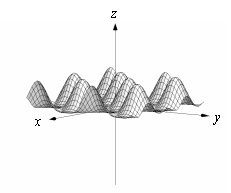
. Use the viewpoint and (see figure). A)
B)
C)
D)
Question
Wind chill is a combination of temperature and wind speed that expresses how cold the air feels. The larger the wind speed, the more rapidly heat is lost to the air and thus the colder it feels. The table shows the wind chill for selected temperatures and wind speeds. At  and a wind speed of 30 mph, how much change in wind chill can be expected if the wind speed increases by 10 mph? Temperature (degrees Fahrenheit)
Wind speed
(mph)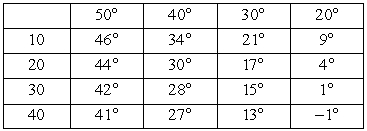
A)
B)
C)
D)
and a wind speed of 30 mph, how much change in wind chill can be expected if the wind speed increases by 10 mph? Temperature (degrees Fahrenheit)Wind speed
(mph)
A)
B)
C)
D)
Question
Describe and sketch the domain of the function. 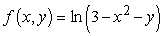
A)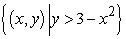
B)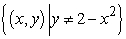
C)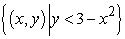
D)
A)
B)
C)
D)
Question
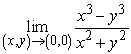
Show that the limit does not exist. 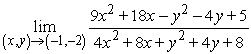
Question
Use polar coordinates to find the indicated limit, if it exists. Note that  is equivalent to
  .
. 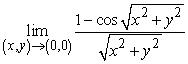
A) 0
B) 1
C) -1
D) The limit is undefined.
is equivalent to . A) 0
B) 1
C) -1
D) The limit is undefined.
Question
Match the surface to its density plot. 
A)
B)
C)
D)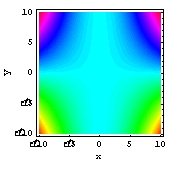
A)
B)
C)
D)
Question
Determine all points at which the given function is continuous. 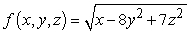
A)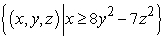
B)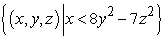
C)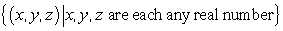
D)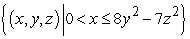
A)
B)
C)
D)
Question
Show that the limit does not exist. 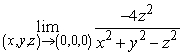
Question
Show that the limit does not exist. 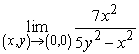
Question
Show that the indicated limit exists. 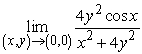
Question
Show that the indicated limit exists. 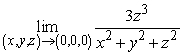
Question
Ammonia (NH3) is a gas used for manufacturing fertilizers as well as urethane foams and coatings. A particular gas cylinder contains 17.03 grams of ammonia. The pressure P (in atmospheres (atm)), volume V (in liters (L)), and temperature T (in Kelvin (K)) of the sample are related by the equation 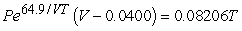 . For the function
  , compute
  .
.
A) 0.0 atm
B) 44.2 atm
C) 14.3 atm
D) 15.5 atm
. For the function , compute .A) 0.0 atm
B) 44.2 atm
C) 14.3 atm
D) 15.5 atm
Question
Compute the indicated limit. 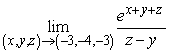
A)
B)
C) 1
D) undefined
A)
B)
C) 1
D) undefined
Question
Match the surface to its contour plot. 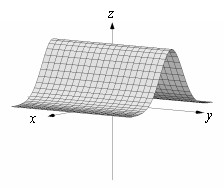
A)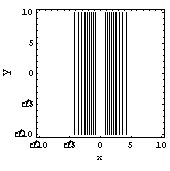
B)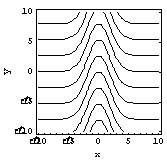
C)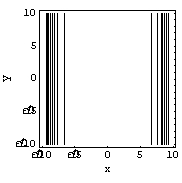
D)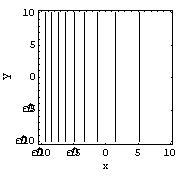
A)
B)
C)
D)
Question
Use polar coordinates to find the indicated limit, if it exists. Note that  is equivalent to
  .
. 
A) 0
B) 1
C) -1
D) The limit is undefined.
is equivalent to . A) 0
B) 1
C) -1
D) The limit is undefined.
Question
Determine all points at which the given function is continuous. 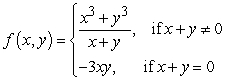
A)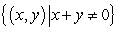
B)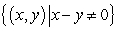
C)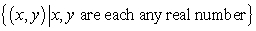
D)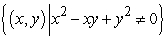
A)
B)
C)
D)
Question
Determine all points at which the given function is continuous. 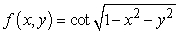
A)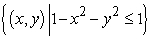
B)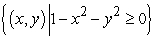
C)
D)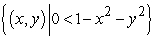
A)
B)
C)
D)
Question
Compute the indicated limit. 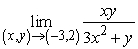
A) undefined
B)
C) 0
D)
A) undefined
B)
C) 0
D)
Question
Match the surface to its density plot. 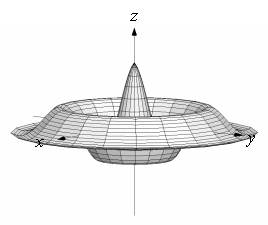
A)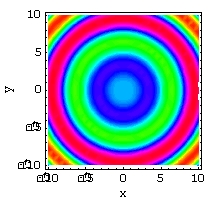
B)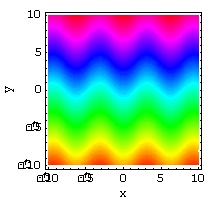
C)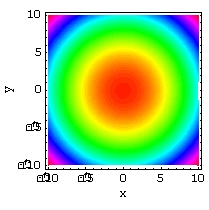
D)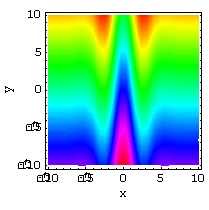
A)
B)
C)
D)
Question
Match the surface to its contour plot. 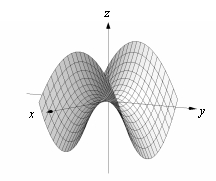
A)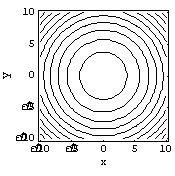
B)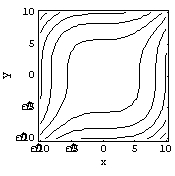
C)
D)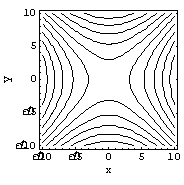
A)
B)
C)
D)
Question
Show that the indicated limit exists. 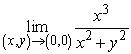
Question
Match the surface to its contour plot. 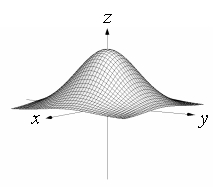
A)
B)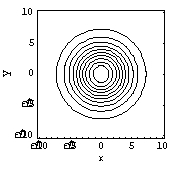
C)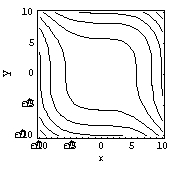
D)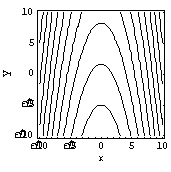
A)
B)
C)
D)
Question
Match the surface to its density plot. 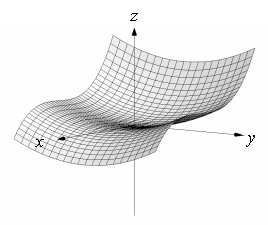
A)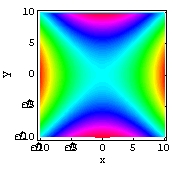
B)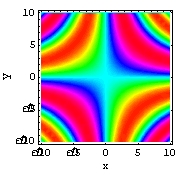
C)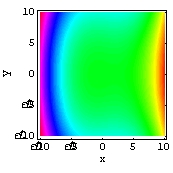
D)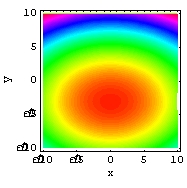
A)
B)
C)
D)
Question
Find the indicated partial derivative. 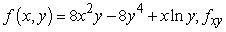
A)
B)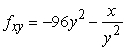
C)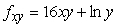
D)
A)
B)
C)
D)
Question
Find a function with the given properties. 
A)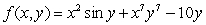
B)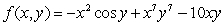
C)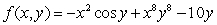
D)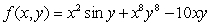
A)
B)
C)
D)
Question
The pressure P of a gas in a leak-tight container can be approximated by 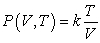 , where V is the volume of the container, T is its absolute (Kelvin) temperature, and k is a constant. Find
  and
and  .
.
A) ,
, 
B) ,
, 
C) ,
, 
D) ,
, 
, where V is the volume of the container, T is its absolute (Kelvin) temperature, and k is a constant. Find and .A)
, B)
, C)
, D)
, Question
Use the contour plot to estimate  and
and  at the origin.
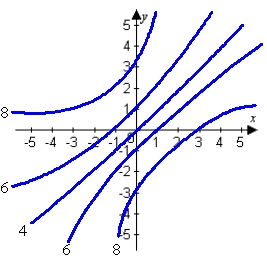
A)
B)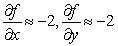
C)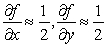
D)
and at the origin. A)
B)
C)
D)
Question
Find the indicated partial derivative. 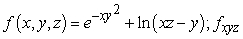
A)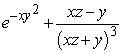
B)
C)
D) 0
A)
B)
C)
D) 0
Question
Find the indicated partial derivative. 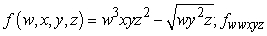
A) 0
B) 6w2z
C) 12wz
D) 3w2
A) 0
B) 6w2z
C) 12wz
D) 3w2
Question
Find all first-order partial derivatives. 
A)
B)
C)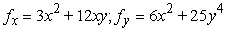
D)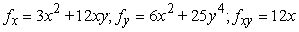
A)
B)
C)
D)
Question
Use the contour plot to estimate  and
and  at the origin.
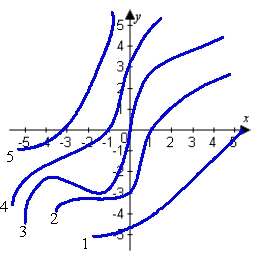
A)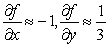
B)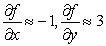
C)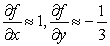
D)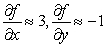
and at the origin. A)
B)
C)
D)
Question
Show that the function 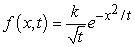 satisfies the diffusion equation
  .
.
satisfies the diffusion equation . Question
Solid bodies, such as mechanical flywheels, experience stress when rotating. The stress s on a flywheel with uniform density d (kg/m3) and radius r (meters) is approximated by ![<strong>Solid bodies, such as mechanical flywheels, experience stress when rotating. The stress s on a flywheel with uniform density d (kg/m<sup>3</sup>) and radius r (meters) is approximated by where is the rotational speed of the flywheel in radians per second. Estimate the percent increase in the stress if the rotational speed of a uniform flywheel is increased from 3205 to 3355 rad/s. [Note: you should be able to answer the question with the given information: no additional information is necessary.]</strong> A) 9% B) 3% C) 0.02% D) 5% <div style=padding-top: 35px>](https://storage.examlex.com/TB5869/11eaa88b_932f_dfaf_a696_2329178029ed_TB5869_11.jpg) where
where ![<strong>Solid bodies, such as mechanical flywheels, experience stress when rotating. The stress s on a flywheel with uniform density d (kg/m<sup>3</sup>) and radius r (meters) is approximated by where is the rotational speed of the flywheel in radians per second. Estimate the percent increase in the stress if the rotational speed of a uniform flywheel is increased from 3205 to 3355 rad/s. [Note: you should be able to answer the question with the given information: no additional information is necessary.]</strong> A) 9% B) 3% C) 0.02% D) 5% <div style=padding-top: 35px>](https://storage.examlex.com/TB5869/11eaa88b_9330_06c0_a696_cb7e81c70f9b_TB5869_11.jpg) is the rotational speed of the flywheel in radians per second. Estimate the percent increase in the stress if the rotational speed of a uniform flywheel is increased from 3205 to 3355 rad/s. [Note: you should be able to answer the question with the given information: no additional information is necessary.]
is the rotational speed of the flywheel in radians per second. Estimate the percent increase in the stress if the rotational speed of a uniform flywheel is increased from 3205 to 3355 rad/s. [Note: you should be able to answer the question with the given information: no additional information is necessary.]
A) 9%
B) 3%
C) 0.02%
D) 5%
where is the rotational speed of the flywheel in radians per second. Estimate the percent increase in the stress if the rotational speed of a uniform flywheel is increased from 3205 to 3355 rad/s. [Note: you should be able to answer the question with the given information: no additional information is necessary.]A) 9%
B) 3%
C) 0.02%
D) 5%
Question
Find the indicated partial derivatives. 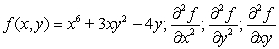
Question
Find an equation for the tangent plane at the given point. 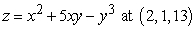
A)
B)
C)
D)
A)
B)
C)
D)
Question
Use the contour plot to estimate  and
and  at the origin.
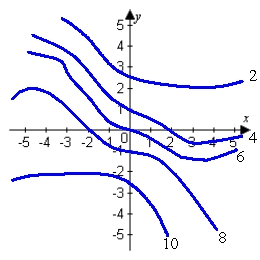
A)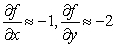
B)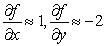
C)
D)
and at the origin. A)
B)
C)
D)
Question
Find all first-order partial derivatives. 
A)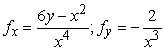
B)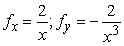
C)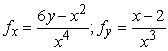
D)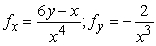
A)
B)
C)
D)
Question
Find an equation for the tangent plane at the given point. 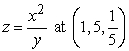
A)
B)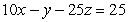
C)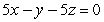
D)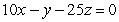
A)
B)
C)
D)
Question
Find all points at which  .
. 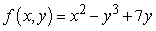
A)
B)
C)
D) (0, 0)
. A)
B)
C)
D) (0, 0)
Question
Find all points at which  .
. 
A)
B)
C)
D)
. A)
B)
C)
D)
Question
Find all first-order partial derivatives. 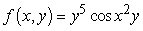
A)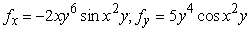
B)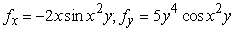
C)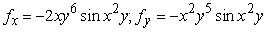
D)
A)
B)
C)
D)
Question
Find an equation for the tangent plane at the given point. 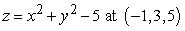
A)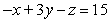
B)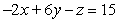
C)
D)
A)
B)
C)
D)
Question
Find all first-order partial derivatives. 
Question
Find the total differential of  .
. 
A)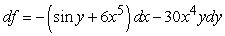
B)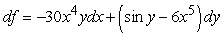
C)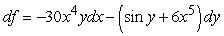
D)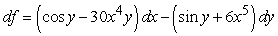
. A)
B)
C)
D)
Question
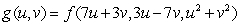
State the chain rule for finding  for the general composite function involving
A)
B)
C)
D)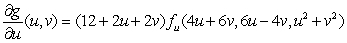
for the general composite function involving A)
B)
C)
D)
Question
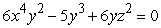
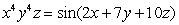
Use implicit differentiation to find  .
. 
A)
B)
C)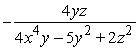
D)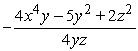
. A)
B)
C)
D)
Question
Use the chain rule to find the indicated derivative.  , where
A)
B)
C)
D)
, where A)
B)
C)
D)
Question
Suppose the production of a firm is modeled by 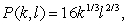 where k measures capital (in millions of dollars) and l measures the labor force (in thousands of workers). Suppose that
  and
and  the labor force is increasing at the rate of 90 and capital is growing at a rate of $200,000 per year. Determine the rate of change of production.
A) Production is increasing at a rate of 13.27 units per year.
B) Production is increasing at a rate of 2.13 units per year.
C) Production is increasing at a rate of 10.15 units per year.
D) Production is increasing at a rate of 21.29 units per year.
where k measures capital (in millions of dollars) and l measures the labor force (in thousands of workers). Suppose that and the labor force is increasing at the rate of 90 and capital is growing at a rate of $200,000 per year. Determine the rate of change of production.A) Production is increasing at a rate of 13.27 units per year.
B) Production is increasing at a rate of 2.13 units per year.
C) Production is increasing at a rate of 10.15 units per year.
D) Production is increasing at a rate of 21.29 units per year.
Question
Use the chain rule to find the indicated derivative.  , where
A)
B)
C)
D)
, where A)
B)
C)
D)
Question
Find the total differential of  .
.
A)
B)
C)
D)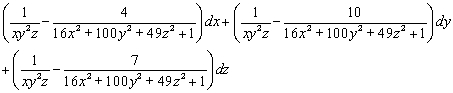
.A)
B)
C)
D)
Question
Use implicit differentiation to find  and
and  Assume that the equation defines z as a differentiable function near each
and Assume that the equation defines z as a differentiable function near each Question
Use the chain rule twice to find  for the general composite function involving
for the general composite function involving Question
Compute the linear approximation of the function at the given point. 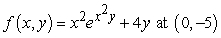
A)
B)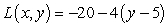
C)
D)
A)
B)
C)
D)
Question
Use implicit differentiation to find  .
. 
A)
B)
C)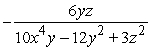
D)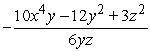
. A)
B)
C)
D)
Question
Use the given contour plot to estimate the linear approximation of  at
at  . Assume each contour line represents a 1 unit increase from left to right with the left-most contour line corresponding to a value of 1.
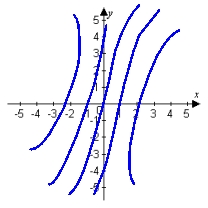
A)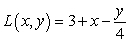
B)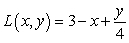
C)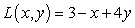
D)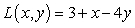
at . Assume each contour line represents a 1 unit increase from left to right with the left-most contour line corresponding to a value of 1. A)
B)
C)
D)
Question
The number n of gas particles in a leak-tight container is approximately described by the equation 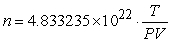 , where T is the temperature of the gas in kelvins (K), P is the pressure of the gas in atmospheres (atm), and V is the volume of the container in liters (L). For a particular sample, an experimenter finds T = 296.6 0.01 K, P = 1.05 0.01 atm, and V = 1.302 0.002 L. Use a linear approximation to estimate the range of the computed value of n.
A) 0 to
B) to
to 
C) to
to 
D) to
to 
, where T is the temperature of the gas in kelvins (K), P is the pressure of the gas in atmospheres (atm), and V is the volume of the container in liters (L). For a particular sample, an experimenter finds T = 296.6 0.01 K, P = 1.05 0.01 atm, and V = 1.302 0.002 L. Use a linear approximation to estimate the range of the computed value of n.A) 0 to
B)
to C)
to D)
to Question
Find an equation of the tangent plane to the parametric surface at the indicated point. S is defined by 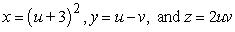 ; at u = -4 and v = -1
A)
B)
C)
D)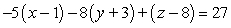
; at u = -4 and v = -1A)
B)
C)
D)
Question
Use the given contour plot to estimate the linear approximation of  at
at  .
. 
A)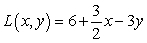
B)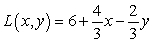
C)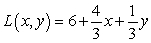
D)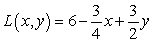
at . A)
B)
C)
D)
Question
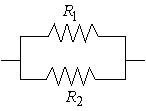
Two electrical resistors with resistances R1 and R2 (in ohms) are wired into an electronics circuit as shown in the figure below. The pair of resistors behaves as a single resistor RT whose resistance is given by  . Once the circuit is energized, the temperatures of the resistors increase, causing the resistances to increase according to:
 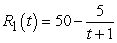 ,
, 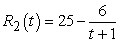 , where t is in seconds. Find
  .
. 
A)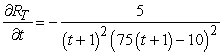
B)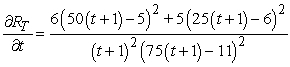
C)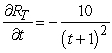
D)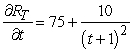
. Once the circuit is energized, the temperatures of the resistors increase, causing the resistances to increase according to: , , where t is in seconds. Find . A)
B)
C)
D)
Question
Write out the third-order Taylor polynomial for 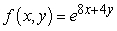 about (0,0).
A)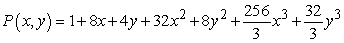
B)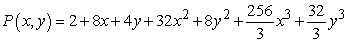
C)
D)
about (0,0).A)
B)
C)
D)
Question
Compute the linear approximation of the function at the given point. 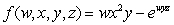 at
at 
A)
B)
C)
D)
at A)
B)
C)
D)
Question
Find the total differential of  .
. 
A)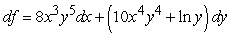
B)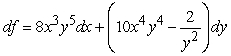
C)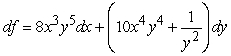
D)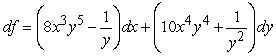
. A)
B)
C)
D)
Question
Find the gradient of the given function. 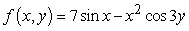
A)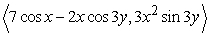
B)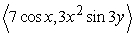
C)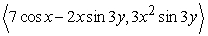
D)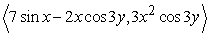
A)
B)
C)
D)

Unlock Deck
Sign up to unlock the cards in this deck!
Unlock Deck
Unlock Deck
1/112
Play
Full screen (f)
Deck 14: Functions of Several Variables and Partial Differentiation
1
Compute the indicated function value.
A) -53
B) -29
C) -45
D) -98
A) -53
B) -29
C) -45
D) -98
-53
2
Describe the range of the function.
A)
B)
C)
D)
A)
B)
C)
D)
3
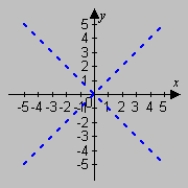
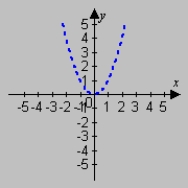
Which of the following is the contour plot of ?
A)
B)
C)
D)
? A)
B)
C)
D)
4
Sketch the indicated traces of .
. Unlock Deck
Unlock for access to all 112 flashcards in this deck.
Unlock Deck
k this deck
5
Describe and sketch the domain of the function.
A)
B)
C)
D)
A)
B)
C)
D)
Unlock Deck
Unlock for access to all 112 flashcards in this deck.
Unlock Deck
k this deck
6
Wind chill is a combination of temperature and wind speed that expresses how cold the air feels. The larger the wind speed, the more rapidly heat is lost to the air and thus the colder it feels. The table shows the wind chill for selected temperatures and wind speeds. For the function , find . Temperature (degrees Fahrenheit)
Wind speed
(mph)
A)
B)
C)
D)
, find . Temperature (degrees Fahrenheit)Wind speed
(mph)
A)
B)
C)
D)
Unlock Deck
Unlock for access to all 112 flashcards in this deck.
Unlock Deck
k this deck
7
Describe and sketch the domain of the function.
A)
B)
C)
D)
A)
B)
C)
D)
Unlock Deck
Unlock for access to all 112 flashcards in this deck.
Unlock Deck
k this deck
8
Which of the following is the contour plot of ?
A)
B)
C)
D)
? A)
B)
C)
D)
Unlock Deck
Unlock for access to all 112 flashcards in this deck.
Unlock Deck
k this deck
9
Use a graphing utility to sketch the graph of . Use the viewpoint and (see figure).
A)
B)
C)
D)
. Use the viewpoint and (see figure). A)
B)
C)
D)
Unlock Deck
Unlock for access to all 112 flashcards in this deck.
Unlock Deck
k this deck
10
Which of the following is the contour plot of ?
A)
B)
C)
D)
? A)
B)
C)
D)
Unlock Deck
Unlock for access to all 112 flashcards in this deck.
Unlock Deck
k this deck
11
Describe and sketch the domain of the function.
A)
B)
C)
D)
A)
B)
C)
D)
Unlock Deck
Unlock for access to all 112 flashcards in this deck.
Unlock Deck
k this deck
12
Sketch the indicated traces of .
. Unlock Deck
Unlock for access to all 112 flashcards in this deck.
Unlock Deck
k this deck
13
Compute the indicated function value.
A)
B)
C) -2
D) undefined
A)
B)
C) -2
D) undefined
Unlock Deck
Unlock for access to all 112 flashcards in this deck.
Unlock Deck
k this deck
14
Use a graphing utility to sketch the graph of . Use the viewpoint and (see figure).
A)
B)
C)
D)
. Use the viewpoint and (see figure). A)
B)
C)
D)
Unlock Deck
Unlock for access to all 112 flashcards in this deck.
Unlock Deck
k this deck
15
Which of the following is the contour plot of ?
A)
B)
C)
D)
? A)
B)
C)
D)
Unlock Deck
Unlock for access to all 112 flashcards in this deck.
Unlock Deck
k this deck
16
Describe the range of the function.
A)
B)
C)
D)
A)
B)
C)
D)
Unlock Deck
Unlock for access to all 112 flashcards in this deck.
Unlock Deck
k this deck
17
Describe the range of the function.
A)
B)
C)
D)
A)
B)
C)
D)
Unlock Deck
Unlock for access to all 112 flashcards in this deck.
Unlock Deck
k this deck
18
Use a graphing utility to sketch the graph of . Use the viewpoint and (see figure).
A)
B)
C)
D)
. Use the viewpoint and (see figure). A)
B)
C)
D)
Unlock Deck
Unlock for access to all 112 flashcards in this deck.
Unlock Deck
k this deck
19
Wind chill is a combination of temperature and wind speed that expresses how cold the air feels. The larger the wind speed, the more rapidly heat is lost to the air and thus the colder it feels. The table shows the wind chill for selected temperatures and wind speeds. At and a wind speed of 30 mph, how much change in wind chill can be expected if the wind speed increases by 10 mph? Temperature (degrees Fahrenheit)
Wind speed
(mph)
A)
B)
C)
D)
and a wind speed of 30 mph, how much change in wind chill can be expected if the wind speed increases by 10 mph? Temperature (degrees Fahrenheit)Wind speed
(mph)
A)
B)
C)
D)
Unlock Deck
Unlock for access to all 112 flashcards in this deck.
Unlock Deck
k this deck
20
Describe and sketch the domain of the function.
A)
B)
C)
D)
A)
B)
C)
D)
Unlock Deck
Unlock for access to all 112 flashcards in this deck.
Unlock Deck
k this deck
21
Show that the limit does not exist.
Unlock Deck
Unlock for access to all 112 flashcards in this deck.
Unlock Deck
k this deck
22
Use polar coordinates to find the indicated limit, if it exists. Note that is equivalent to .
A) 0
B) 1
C) -1
D) The limit is undefined.
is equivalent to . A) 0
B) 1
C) -1
D) The limit is undefined.
Unlock Deck
Unlock for access to all 112 flashcards in this deck.
Unlock Deck
k this deck
23
Match the surface to its density plot.
A)
B)
C)
D)
A)
B)
C)
D)
Unlock Deck
Unlock for access to all 112 flashcards in this deck.
Unlock Deck
k this deck
24
Determine all points at which the given function is continuous.
A)
B)
C)
D)
A)
B)
C)
D)
Unlock Deck
Unlock for access to all 112 flashcards in this deck.
Unlock Deck
k this deck
25
Show that the limit does not exist.
Unlock Deck
Unlock for access to all 112 flashcards in this deck.
Unlock Deck
k this deck
26
Show that the limit does not exist.
Unlock Deck
Unlock for access to all 112 flashcards in this deck.
Unlock Deck
k this deck
27
Show that the indicated limit exists.
Unlock Deck
Unlock for access to all 112 flashcards in this deck.
Unlock Deck
k this deck
28
Show that the indicated limit exists.
Unlock Deck
Unlock for access to all 112 flashcards in this deck.
Unlock Deck
k this deck
29
Ammonia (NH3) is a gas used for manufacturing fertilizers as well as urethane foams and coatings. A particular gas cylinder contains 17.03 grams of ammonia. The pressure P (in atmospheres (atm)), volume V (in liters (L)), and temperature T (in Kelvin (K)) of the sample are related by the equation . For the function , compute .
A) 0.0 atm
B) 44.2 atm
C) 14.3 atm
D) 15.5 atm
. For the function , compute .A) 0.0 atm
B) 44.2 atm
C) 14.3 atm
D) 15.5 atm
Unlock Deck
Unlock for access to all 112 flashcards in this deck.
Unlock Deck
k this deck
30
Compute the indicated limit.
A)
B)
C) 1
D) undefined
A)
B)
C) 1
D) undefined
Unlock Deck
Unlock for access to all 112 flashcards in this deck.
Unlock Deck
k this deck
31
Match the surface to its contour plot.
A)
B)
C)
D)
A)
B)
C)
D)
Unlock Deck
Unlock for access to all 112 flashcards in this deck.
Unlock Deck
k this deck
32
Use polar coordinates to find the indicated limit, if it exists. Note that is equivalent to .
A) 0
B) 1
C) -1
D) The limit is undefined.
is equivalent to . A) 0
B) 1
C) -1
D) The limit is undefined.
Unlock Deck
Unlock for access to all 112 flashcards in this deck.
Unlock Deck
k this deck
33
Determine all points at which the given function is continuous.
A)
B)
C)
D)
A)
B)
C)
D)
Unlock Deck
Unlock for access to all 112 flashcards in this deck.
Unlock Deck
k this deck
34
Determine all points at which the given function is continuous.
A)
B)
C)
D)
A)
B)
C)
D)
Unlock Deck
Unlock for access to all 112 flashcards in this deck.
Unlock Deck
k this deck
35
Compute the indicated limit.
A) undefined
B)
C) 0
D)
A) undefined
B)
C) 0
D)
Unlock Deck
Unlock for access to all 112 flashcards in this deck.
Unlock Deck
k this deck
36
Match the surface to its density plot.
A)
B)
C)
D)
A)
B)
C)
D)
Unlock Deck
Unlock for access to all 112 flashcards in this deck.
Unlock Deck
k this deck
37
Match the surface to its contour plot.
A)
B)
C)
D)
A)
B)
C)
D)
Unlock Deck
Unlock for access to all 112 flashcards in this deck.
Unlock Deck
k this deck
38
Show that the indicated limit exists.
Unlock Deck
Unlock for access to all 112 flashcards in this deck.
Unlock Deck
k this deck
39
Match the surface to its contour plot.
A)
B)
C)
D)
A)
B)
C)
D)
Unlock Deck
Unlock for access to all 112 flashcards in this deck.
Unlock Deck
k this deck
40
Match the surface to its density plot.
A)
B)
C)
D)
A)
B)
C)
D)
Unlock Deck
Unlock for access to all 112 flashcards in this deck.
Unlock Deck
k this deck
41
Find the indicated partial derivative.
A)
B)
C)
D)
A)
B)
C)
D)
Unlock Deck
Unlock for access to all 112 flashcards in this deck.
Unlock Deck
k this deck
42
Find a function with the given properties.
A)
B)
C)
D)
A)
B)
C)
D)
Unlock Deck
Unlock for access to all 112 flashcards in this deck.
Unlock Deck
k this deck
43
The pressure P of a gas in a leak-tight container can be approximated by , where V is the volume of the container, T is its absolute (Kelvin) temperature, and k is a constant. Find and .
A) ,
B) ,
C) ,
D) ,
, where V is the volume of the container, T is its absolute (Kelvin) temperature, and k is a constant. Find and .A)
, B)
, C)
, D)
, Unlock Deck
Unlock for access to all 112 flashcards in this deck.
Unlock Deck
k this deck
44
Use the contour plot to estimate and at the origin.
A)
B)
C)
D)
and at the origin. A)
B)
C)
D)
Unlock Deck
Unlock for access to all 112 flashcards in this deck.
Unlock Deck
k this deck
45
Find the indicated partial derivative.
A)
B)
C)
D) 0
A)
B)
C)
D) 0
Unlock Deck
Unlock for access to all 112 flashcards in this deck.
Unlock Deck
k this deck
46
Find the indicated partial derivative.
A) 0
B) 6w2z
C) 12wz
D) 3w2
A) 0
B) 6w2z
C) 12wz
D) 3w2
Unlock Deck
Unlock for access to all 112 flashcards in this deck.
Unlock Deck
k this deck
47
Find all first-order partial derivatives.
A)
B)
C)
D)
A)
B)
C)
D)
Unlock Deck
Unlock for access to all 112 flashcards in this deck.
Unlock Deck
k this deck
48
Use the contour plot to estimate and at the origin.
A)
B)
C)
D)
and at the origin. A)
B)
C)
D)
Unlock Deck
Unlock for access to all 112 flashcards in this deck.
Unlock Deck
k this deck
49
Show that the function satisfies the diffusion equation .
satisfies the diffusion equation . Unlock Deck
Unlock for access to all 112 flashcards in this deck.
Unlock Deck
k this deck
50
Solid bodies, such as mechanical flywheels, experience stress when rotating. The stress s on a flywheel with uniform density d (kg/m3) and radius r (meters) is approximated by where is the rotational speed of the flywheel in radians per second. Estimate the percent increase in the stress if the rotational speed of a uniform flywheel is increased from 3205 to 3355 rad/s. [Note: you should be able to answer the question with the given information: no additional information is necessary.]
A) 9%
B) 3%
C) 0.02%
D) 5%
where is the rotational speed of the flywheel in radians per second. Estimate the percent increase in the stress if the rotational speed of a uniform flywheel is increased from 3205 to 3355 rad/s. [Note: you should be able to answer the question with the given information: no additional information is necessary.]A) 9%
B) 3%
C) 0.02%
D) 5%
Unlock Deck
Unlock for access to all 112 flashcards in this deck.
Unlock Deck
k this deck
51
Find the indicated partial derivatives.
Unlock Deck
Unlock for access to all 112 flashcards in this deck.
Unlock Deck
k this deck
52
Find an equation for the tangent plane at the given point.
A)
B)
C)
D)
A)
B)
C)
D)
Unlock Deck
Unlock for access to all 112 flashcards in this deck.
Unlock Deck
k this deck
53
Use the contour plot to estimate and at the origin.
A)
B)
C)
D)
and at the origin. A)
B)
C)
D)
Unlock Deck
Unlock for access to all 112 flashcards in this deck.
Unlock Deck
k this deck
54
Find all first-order partial derivatives.
A)
B)
C)
D)
A)
B)
C)
D)
Unlock Deck
Unlock for access to all 112 flashcards in this deck.
Unlock Deck
k this deck
55
Find an equation for the tangent plane at the given point.
A)
B)
C)
D)
A)
B)
C)
D)
Unlock Deck
Unlock for access to all 112 flashcards in this deck.
Unlock Deck
k this deck
56
Find all points at which .
A)
B)
C)
D) (0, 0)
. A)
B)
C)
D) (0, 0)
Unlock Deck
Unlock for access to all 112 flashcards in this deck.
Unlock Deck
k this deck
57
Find all points at which .
A)
B)
C)
D)
. A)
B)
C)
D)
Unlock Deck
Unlock for access to all 112 flashcards in this deck.
Unlock Deck
k this deck
58
Find all first-order partial derivatives.
A)
B)
C)
D)
A)
B)
C)
D)
Unlock Deck
Unlock for access to all 112 flashcards in this deck.
Unlock Deck
k this deck
59
Find an equation for the tangent plane at the given point.
A)
B)
C)
D)
A)
B)
C)
D)
Unlock Deck
Unlock for access to all 112 flashcards in this deck.
Unlock Deck
k this deck
60
Find all first-order partial derivatives.
Unlock Deck
Unlock for access to all 112 flashcards in this deck.
Unlock Deck
k this deck
61
Find the total differential of .
A)
B)
C)
D)
. A)
B)
C)
D)
Unlock Deck
Unlock for access to all 112 flashcards in this deck.
Unlock Deck
k this deck
62
State the chain rule for finding for the general composite function involving
A)
B)
C)
D)
for the general composite function involving A)
B)
C)
D)
Unlock Deck
Unlock for access to all 112 flashcards in this deck.
Unlock Deck
k this deck
63
Use implicit differentiation to find .
A)
B)
C)
D)
. A)
B)
C)
D)
Unlock Deck
Unlock for access to all 112 flashcards in this deck.
Unlock Deck
k this deck
64
Use the chain rule to find the indicated derivative. , where
A)
B)
C)
D)
, where A)
B)
C)
D)
Unlock Deck
Unlock for access to all 112 flashcards in this deck.
Unlock Deck
k this deck
65
Suppose the production of a firm is modeled by where k measures capital (in millions of dollars) and l measures the labor force (in thousands of workers). Suppose that and the labor force is increasing at the rate of 90 and capital is growing at a rate of $200,000 per year. Determine the rate of change of production.
A) Production is increasing at a rate of 13.27 units per year.
B) Production is increasing at a rate of 2.13 units per year.
C) Production is increasing at a rate of 10.15 units per year.
D) Production is increasing at a rate of 21.29 units per year.
where k measures capital (in millions of dollars) and l measures the labor force (in thousands of workers). Suppose that and the labor force is increasing at the rate of 90 and capital is growing at a rate of $200,000 per year. Determine the rate of change of production.A) Production is increasing at a rate of 13.27 units per year.
B) Production is increasing at a rate of 2.13 units per year.
C) Production is increasing at a rate of 10.15 units per year.
D) Production is increasing at a rate of 21.29 units per year.
Unlock Deck
Unlock for access to all 112 flashcards in this deck.
Unlock Deck
k this deck
66
Use the chain rule to find the indicated derivative. , where
A)
B)
C)
D)
, where A)
B)
C)
D)
Unlock Deck
Unlock for access to all 112 flashcards in this deck.
Unlock Deck
k this deck
67
Find the total differential of .
A)
B)
C)
D)
.A)
B)
C)
D)
Unlock Deck
Unlock for access to all 112 flashcards in this deck.
Unlock Deck
k this deck
68
Use implicit differentiation to find and Assume that the equation defines z as a differentiable function near each
and Assume that the equation defines z as a differentiable function near each Unlock Deck
Unlock for access to all 112 flashcards in this deck.
Unlock Deck
k this deck
69
Use the chain rule twice to find for the general composite function involving
for the general composite function involving Unlock Deck
Unlock for access to all 112 flashcards in this deck.
Unlock Deck
k this deck
70
Compute the linear approximation of the function at the given point.
A)
B)
C)
D)
A)
B)
C)
D)
Unlock Deck
Unlock for access to all 112 flashcards in this deck.
Unlock Deck
k this deck
71
Use implicit differentiation to find .
A)
B)
C)
D)
. A)
B)
C)
D)
Unlock Deck
Unlock for access to all 112 flashcards in this deck.
Unlock Deck
k this deck
72
Use the given contour plot to estimate the linear approximation of at . Assume each contour line represents a 1 unit increase from left to right with the left-most contour line corresponding to a value of 1.
A)
B)
C)
D)
at . Assume each contour line represents a 1 unit increase from left to right with the left-most contour line corresponding to a value of 1. A)
B)
C)
D)
Unlock Deck
Unlock for access to all 112 flashcards in this deck.
Unlock Deck
k this deck
73
The number n of gas particles in a leak-tight container is approximately described by the equation , where T is the temperature of the gas in kelvins (K), P is the pressure of the gas in atmospheres (atm), and V is the volume of the container in liters (L). For a particular sample, an experimenter finds T = 296.6 0.01 K, P = 1.05 0.01 atm, and V = 1.302 0.002 L. Use a linear approximation to estimate the range of the computed value of n.
A) 0 to
B) to
C) to
D) to
, where T is the temperature of the gas in kelvins (K), P is the pressure of the gas in atmospheres (atm), and V is the volume of the container in liters (L). For a particular sample, an experimenter finds T = 296.6 0.01 K, P = 1.05 0.01 atm, and V = 1.302 0.002 L. Use a linear approximation to estimate the range of the computed value of n.A) 0 to
B)
to C)
to D)
to Unlock Deck
Unlock for access to all 112 flashcards in this deck.
Unlock Deck
k this deck
74
Find an equation of the tangent plane to the parametric surface at the indicated point. S is defined by ; at u = -4 and v = -1
A)
B)
C)
D)
; at u = -4 and v = -1A)
B)
C)
D)
Unlock Deck
Unlock for access to all 112 flashcards in this deck.
Unlock Deck
k this deck
75
Use the given contour plot to estimate the linear approximation of at .
A)
B)
C)
D)
at . A)
B)
C)
D)
Unlock Deck
Unlock for access to all 112 flashcards in this deck.
Unlock Deck
k this deck
76
Two electrical resistors with resistances R1 and R2 (in ohms) are wired into an electronics circuit as shown in the figure below. The pair of resistors behaves as a single resistor RT whose resistance is given by . Once the circuit is energized, the temperatures of the resistors increase, causing the resistances to increase according to: , , where t is in seconds. Find .
A)
B)
C)
D)
. Once the circuit is energized, the temperatures of the resistors increase, causing the resistances to increase according to: , , where t is in seconds. Find . A)
B)
C)
D)
Unlock Deck
Unlock for access to all 112 flashcards in this deck.
Unlock Deck
k this deck
77
Write out the third-order Taylor polynomial for about (0,0).
A)
B)
C)
D)
about (0,0).A)
B)
C)
D)
Unlock Deck
Unlock for access to all 112 flashcards in this deck.
Unlock Deck
k this deck
78
Compute the linear approximation of the function at the given point. at
A)
B)
C)
D)
at A)
B)
C)
D)
Unlock Deck
Unlock for access to all 112 flashcards in this deck.
Unlock Deck
k this deck
79
Find the total differential of .
A)
B)
C)
D)
. A)
B)
C)
D)
Unlock Deck
Unlock for access to all 112 flashcards in this deck.
Unlock Deck
k this deck
80
Find the gradient of the given function.
A)
B)
C)
D)
A)
B)
C)
D)
Unlock Deck
Unlock for access to all 112 flashcards in this deck.
Unlock Deck
k this deck
Unlock Deck
Unlock for access to all 112 flashcards in this deck.


