Deck 15: Long-Run Macroeconomic Adjustments
Full screen (f)
Question
Question
Question
Question
Question
Question
Question
Question
Question
Question
Question
Question
Question
Question
Question
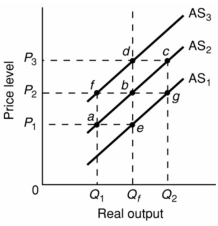
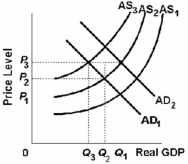
Refer to the above diagram. Assume that nominal wages initially are set on the basis of the price level P2 and that the economy initially is operating at its full-employment level of output Qf. In terms of this diagram, the long-run aggregate supply curve:
A) is AS2.
B) is a vertical line extending from Qf upward through e, b, and d.
C) may be either AS1, AS2, or AS3 depending on whether the price level is P1, P2, or P3.
D) is a horizontal line extending from P2 rightward through f, b, and g.
Question
Question
Question
Refer to the above diagram. Assume that nominal wages initially are set on the basis of the price level P2 and that the economy initially is operating at its full-employment level of output Q f. In the short run, an increase in the price level from P2 to P3 will:
A) change aggregate supply from AS2 to AS3.
B) increase real output from Q1 to Q2.
C) change aggregate supply from AS2 to AS1.
D) increase real output from Q f to Q2.
Question
Question

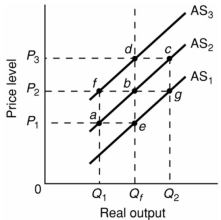
Refer to the above diagram. The initial aggregate demand curve is AD1 and the initial aggregate supply curve is AS1. Demand-pull inflation in the short run is best shown as:
A) a shift of the aggregate demand curve from AD1 to AD2.
B) a move from d to b to a.
C) a move directly from d to a.
D) a shift of the aggregate supply curve from AS1 to AS2.
Question
Question
Refer to the above diagram and assume that prices and wages are flexible both upward and downward in the economy. In the long run AD-AS model:
A) demand-pull inflation would involve a shift of curve D to the right.
B) cost-push inflation would involve a shift of curve B downward.
C) recession would involve a leftward shift of curve A.
D) frictional unemployment would be zero in the long run.
Question
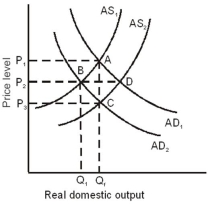
Refer to the graph below. The economy is initially at equilibrium when AD1 and AS1 intersect. If there is cost-push inflation in the economy so that aggregate supply shifts from AS1 to AS2, then to reduce unemployment the government may increase aggregate demand which in the short run shifts: 
A) AD1 to AD2, increases the price level from P1 to P2, and increases real domestic output from Q1 to Q2.
B) AD1 to AD2, increases the price level from P2 to P3, and increases real domestic output from Q1 to Q2.
C) AD1 to AD2, increases the price level from P2 to P3, and increases real domestic output from Q2 to Q1.
D) AD2 to AD1, decreases the price level from P3 to P2, and decreases real domestic output from Q1 to Q2.
Question
Question
Question
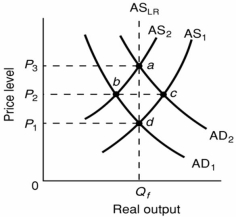
Refer to the diagram below. The initial aggregate demand curve is AD1 and the initial aggregate supply curve is AS1. Assuming no change in aggregate demand, the long-run response to a recession caused by cost-push inflation is best depicted as a: 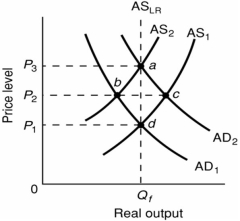
A) move from a to d along the long-run aggregate supply curve.
B) rightward shift of the aggregate supply curve from AS2 to AS1.
C) move from a to c to d.
D) leftward shift of the aggregate supply curve from AS1 to AS2.
A) move from a to d along the long-run aggregate supply curve.
B) rightward shift of the aggregate supply curve from AS2 to AS1.
C) move from a to c to d.
D) leftward shift of the aggregate supply curve from AS1 to AS2.
Question
Refer to the above graph. Given that the economy is at an initial equilibrium where the AD1 and AS1 curves intersect, demand-pull inflation in the short run can best be represented by a shift from:
A) AS1 to AS3.
B) AD1 to AD2.
C) AS1 to AS2.
D) AD2 to AD1.
Question
Question
Refer to the above graph. Assume that the economy is initially at equilibrium at point A. If there is a recession in the economy such that AD1 shifts to AD2, and wages and prices are flexible, then in the long run the price level will be:
A) P2, and real output will be Qf.
B) P3, and real output will be Qf.
C) P1, and real output will be Qf.
D) P2, and real output will be Q1.
Question
Refer to the above diagram. The initial aggregate demand curve is AD1 and the initial aggregate supply curve is AS1. In the long run, demand-pull inflation is best shown as:
A) a shift of aggregate demand from AD1 to AD2 followed by a shift of aggregate supply from AS1 to AS2.
B) a move from d to b to a.
C) a shift of aggregate supply from AS1 to AS2 followed by a shift of aggregate demand from AD1 to AD2.
D) a move from a to d.
Question
Question
Question
Refer to the above diagram. The initial aggregate demand curve is AD1 and the initial aggregate supply curve is AS1. Cost-push inflation in the short run is best represented as a:
A) leftward shift of the aggregate supply curve from AS1 to AS2.
B) rightward shift of the aggregate demand curve from AD1 to AD2.
C) move from d to b to a.
D) move from d directly to a.
Question
Question
Question
Question
Refer to the above diagram. The initial aggregate demand curve is AD1 and the initial aggregate supply curve is AS1. If government offsets the decline in real output resulting from short-run cost-push inflation by increasing aggregate demand from AD1 to AD2:
A) real output will rise above Qf.
B) the price level will rise from P1 to P2.
C) it is possible that aggregate supply will shift rightward from AS2 because nominal wage demands will rise.
D) the price level will rise from P2 to P3.
Question
Refer to the above graph. Assume that the economy is at equilibrium at AD1 and AS1 and then is hit with both demand-pull and cost-push inflation. If this occurs, then, in the short run:
A) AD1 will shift to AD2, AS2 will shift to AS3, the price level will be at P2, and output will be at Q2.
B) AS1 will shift to AS3, AD2 will shift to AD1, the price level will be at P3, and output will be at Q3.
C) AD1 will shift to AD2, AS1 will shift to AS2, the price level will be at P2, and output will be at Q2.
D) AD1 will shift to AD2, AS1 will shift to AS2, the price level will be at P3, and output will be at Q1.
Question
Refer to the graph below. Assume that the economy is in initial equilibrium where AS1 intersects AD1. Then a supply shock occurs that shifts AS1 to AS2. If the government counters with an expansionary fiscal policy that shifts AD1 to AD2, then it is most likely that: 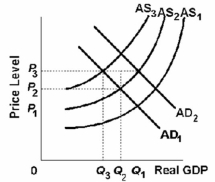
A) AD2 will shift to AD1.
B) AS2 will shift to AS1.
C) AS2 will shift to AS3.
D) AS2 will shift to AS3 and AD2 will shift to AD1.
A) AD2 will shift to AD1.
B) AS2 will shift to AS1.
C) AS2 will shift to AS3.
D) AS2 will shift to AS3 and AD2 will shift to AD1.
Question
Question
Question
Question
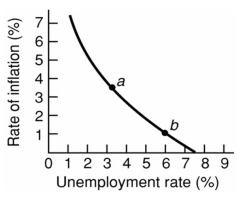
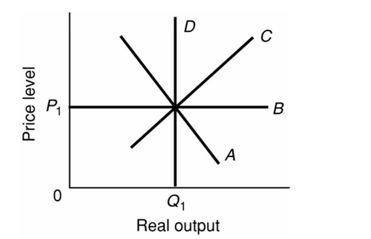
Refer to the above diagram for a specific economy. Stagflation will:
A) shift this curve outward.
B) shift this curve inward.
C) move this economy southeast along the curve.
D) move this economy northwest along the curve.
Question
Refer to the above diagram for a specific economy. The curve on this graph is known as a:
A) Laffer Curve.
B) Phillips Curve.
C) labor demand curve.
D) production possibilities curve.
Question
Question
Refer to the above diagram for a specific economy. Which of the following best describes the relationship shown by this curve?
A) The demand for labor is large when the rate of inflation is small.
B) When the rate of unemployment is high, the rate of inflation is high.
C) The rate of inflation and the rate of unemployment are inversely related.
D) The rate of inflation and the rate of unemployment are directly related.
Question
Question
Question
Question
Refer to the above diagram for a specific economy. An increase in aggregate demand will:
A) shift this curve to the right.
B) shift this curve to the left.
C) move this economy southeast along the curve.
D) move this economy northwest along the curve.
Question
Refer to the above diagram for a specific economy. Which of the following best describes a decision by policymakers which moves this economy from point b to point a?
A) Policymakers have instituted an expansionary money policy and/or a budgetary deficit, thereby accepting more unemployment to reduce the rate of inflation.
B) Policymakers have instituted a tight money policy and/or a budgetary surplus, thereby accepting a higher rate of inflation to reduce unemployment.
C) Policymakers have instituted an expansionary money and/or a budgetary deficit, thereby accepting a higher rate of inflation to reduce unemployment.
D) Policymakers have instituted a tight money policy and/or a budgetary surplus, thereby accepting more unemployment to reduce the rate of inflation.
Question
Question
Question
Question
Question
Refer to the above diagram for a specific economy. The shape of this curve suggests that:
A) the price level rises at a diminishing rate as the level of aggregate demand increases.
B) full employment and price stability are compatible goals only when aggregate demand is falling.
C) each successive unit of decline in the unemployment rate is accompanied by a smaller increase in the rate of inflation.
D) each successive unit of decline in the unemployment rate is accompanied by a larger increase in the rate of inflation.
Question
Question
Question
Refer to the above graph. Assume that the economy is initially at equilibrium at point A. If there is a recession in this economy such that AD1 shifts to AD2, and wages and prices are flexible, then the long-run aggregate supply curve will be:
A) AS2.
B) AS1.
C) a vertical line at Qf.
D) a vertical line at Q1.
Question
Question
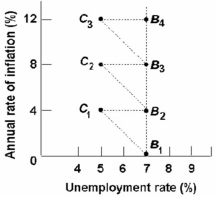
Refer to the above graph. The long-run relationship between the rate of inflation and the unemployment rate is represented by:
A) the zigzag line connecting points B1, C1, B2, C2, B3, C3, and B4.
B) a line connecting points C1, C2, and C3.
C) a line connecting points B1, B2, B3, and B4.
D) a line connecting points B1 and C1.
Question
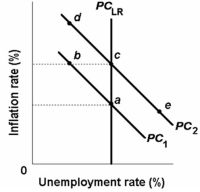
Refer to the above diagram. The move of the economy from c to e on short-run Phillips Curve PC2 would be explained by an:
A) increase in aggregate demand in the economy.
B) increase in aggregate supply in the economy.
C) actual rate of inflation that is less than the expected rate.
D) actual rate of inflation that exceeds the expected rate.
Question
Refer to the above diagram. Point b on short-run Phillips Curve PC1 represents a rate of:
A) inflation below the natural rate.
B) inflation above the natural rate.
C) unemployment above the natural rate.
D) unemployment below the natural rate.
Question
Refer to the above graph. The full-employment unemployment rate in this economy would be:
A) 5 percent.
B) 6 percent.
C) 7 percent.
D) 5-6 percent.
Question
Refer to the graph below. The effects of stagflation, in the short run, are best represented by a shift from: 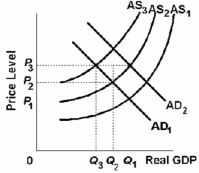
A) AD1 to AD2 given a stable AS1 curve, an increase in the price level from P1 to P2, and a fall in output from Q1 to Q2.
B) AD2 to AD1 given a stable AS1 curve, an increase in the price level from P1 to P2, and a fall in output from Q1 to Q2.
C) AS1 to AS2 given a stable AD1 curve, an increase in the price level from P1 to P2, and a fall in output from Q1 to Q2.
D) AS2 to AS1 given a stable AD1 curve, an increase in the price level from P1 to P2, and a fall in output from Q1 to Q2.
Question
Question
Refer to the above graph. The economy is at point B2, and aggregate demand increases. In the short run, the economy will:
A) stay at point B2.
B) move to point C2 and in the long run to B3.
C) move to point B3 and in the long run to C2.
D) move to point B1 and in the long run to B1.
Question
Refer to the above graph. If the economy moves from point B3 to point C3 because of an increase in aggregate demand, then:
A) nominal wages will rise, reducing profits and thereby negating the short-run stimulus to production and employment so that the economy moves from C3 to B4.
B) real wages will rise, reducing profits and thereby negating the short-run stimulus to production and employment so that the economy moves from C3 to B3.
C) nominal wages will rise, reducing profits and thereby negating the short-run stimulus to production and employment so that the economy moves from C3 to B3.
D) nominal wages will rise, reducing profits and thereby negating the short-run stimulus to production and employment so that the economy moves from C3 to C2.
Question
Question
Refer to the above graph. Assume the economy is at the initial position of B1. An increase in aggregate demand will tend to:
A) temporarily shift the economy to point B2.
B) temporarily shift the economy to point C1.
C) permanently shift the economy to point C1.
D) have no effect in shifting the economy from point B1.
Question
Refer to the above diagram and assume the economy is initially at point b1. Which of the following movements is consistent with The Phillips Curve?
A) the movement from B1 to B2
B) the movement from B1 to C1
C) the movement from C1 to B2
D) the movement from B2 to B1
Question
Question
Refer to the above graph. What events would tend to move the economy from point B2 to C2?
A) a tight monetary policy
B) a contractionary fiscal policy
C) an increase in aggregate demand
D) an increase in aggregate supply
Question
Question
Question
Question
Question
Refer to the above diagram and assume the economy is initially at point b1. According to the adaptive expectations theorists, the long-run relationship between the unemployment rate and the rate of inflation is represented by:
A) the line connecting B1 and C1.
B) the line through B1, B2, B3, and B4.
C) the line connecting C1 and B2.
D) any line parallel to the horizontal axis.
Question
Question
Refer to the above diagram and assume the economy is initially at point b1. If workers fully anticipate price level increases and government uses expansionary policies to lower the unemployment rate below 6 percent, the economy will:
A) move from B1 to C1, at which point macroeconomic policies will cease to be effective.
B) remain at B1.
C) follow the path indicated by B1, B2, B3, and B4.
D) follow the path indicated by B1, C1, B2, C2, B3, etc.

Unlock Deck
Sign up to unlock the cards in this deck!
Unlock Deck
Unlock Deck
1/122
Play
Full screen (f)
Deck 15: Long-Run Macroeconomic Adjustments
1
The short-run aggregate supply curve is upward-sloping because:
A) higher prices discourage the producers to expand output.
B) higher price levels create incentives to expand output when resource prices remain constant.
C) lower prices encourage the producers to expand output.
D) higher price levels create an expectation among producers of still higher price levels.
higher price levels create incentives to expand output when resource prices remain constant.
2
In terms of aggregate supply, the difference between the long run and the short run is that in the long run:
A) the price level is variable.
B) employment is variable.
C) real output is variable.
D) nominal wages and other input prices are variable.
A) the price level is variable.
B) employment is variable.
C) real output is variable.
D) nominal wages and other input prices are variable.
nominal wages and other input prices are variable.
3
Other things equal, an increase in the price level will:
A) shift the short run aggregate supply curve to the right.
B) shift the aggregate demand curve to the right.
C) cause a movement up along a short-run aggregate supply curve.
D) cause a movement down a short run aggregate supply curve.
A) shift the short run aggregate supply curve to the right.
B) shift the aggregate demand curve to the right.
C) cause a movement up along a short-run aggregate supply curve.
D) cause a movement down a short run aggregate supply curve.
cause a movement up along a short-run aggregate supply curve.
4
Other things equal, a decrease in the price level will:
A) shift the short run aggregate supply curve to the left.
B) shift the aggregate demand curve to the left.
C) cause a movement up a short-run aggregate supply curve.
D) cause a movement down a short run aggregate supply curve.
A) shift the short run aggregate supply curve to the left.
B) shift the aggregate demand curve to the left.
C) cause a movement up a short-run aggregate supply curve.
D) cause a movement down a short run aggregate supply curve.
Unlock Deck
Unlock for access to all 122 flashcards in this deck.
Unlock Deck
k this deck
5
In the long run, demand-pull inflation:
A) increases unemployment.
B) decreases nominal wages.
C) decreases real output.
D) increases the price level.
A) increases unemployment.
B) decreases nominal wages.
C) decreases real output.
D) increases the price level.
Unlock Deck
Unlock for access to all 122 flashcards in this deck.
Unlock Deck
k this deck
6
The economy enters the long run once:
A) nominal wages become real wages.
B) real wages become nominal wages.
C) input prices start to change from being inflexible to fully flexible.
D) sufficient time has elapsed for real GDP to increase and unemployment to decrease.
A) nominal wages become real wages.
B) real wages become nominal wages.
C) input prices start to change from being inflexible to fully flexible.
D) sufficient time has elapsed for real GDP to increase and unemployment to decrease.
Unlock Deck
Unlock for access to all 122 flashcards in this deck.
Unlock Deck
k this deck
7
Demand-pull inflation in the short run increases the price level and:
A) real wages.
B) real output.
C) unemployment.
D) nominal wages.
A) real wages.
B) real output.
C) unemployment.
D) nominal wages.
Unlock Deck
Unlock for access to all 122 flashcards in this deck.
Unlock Deck
k this deck
8
Long-run equilibrium occurs where:
A) real output is greater than potential output.
B) the vertical long-run aggregate supply curve, and short-run aggregate supply curve intersect.
C) the aggregate demand curve, and short-run aggregate supply curve intersect
D) the aggregate demand curve, vertical long-run aggregate supply curve, and short-run aggregate supply curve all intersect.
Unlock Deck
Unlock for access to all 122 flashcards in this deck.
Unlock Deck
k this deck
9
In the long-run aggregate demand-aggregate supply model:
A) long-run equilibrium occurs wherever the aggregate demand curve intersects the short-run aggregate supply curve.
B) the long-run aggregate supply curve is horizontal.
C) the price level is the same regardless of the location of the aggregate demand curve.
D) long-run equilibrium occurs at the intersection of the aggregate demand curve, the short-run aggregate supply curve, and the long-run aggregate supply curve.
Unlock Deck
Unlock for access to all 122 flashcards in this deck.
Unlock Deck
k this deck
10
The long-run aggregate supply curve:
A) is downward sloping.
B) is vertical.
C) is horizontal.
D) is upward sloping.
A) is downward sloping.
B) is vertical.
C) is horizontal.
D) is upward sloping.
Unlock Deck
Unlock for access to all 122 flashcards in this deck.
Unlock Deck
k this deck
11
The long-run aggregate supply curve is vertical:
A) because the rate of inflation is steady in the long run.
B) Input prices eventually rise in response to changes in output prices.
C) because product prices always increase at a faster rate than resource prices.
D) only when the money supply increases at the same rate as real GDP.
A) because the rate of inflation is steady in the long run.
B) Input prices eventually rise in response to changes in output prices.
C) because product prices always increase at a faster rate than resource prices.
D) only when the money supply increases at the same rate as real GDP.
Unlock Deck
Unlock for access to all 122 flashcards in this deck.
Unlock Deck
k this deck
12
The short run in macroeconomics is a period in which nominal wages:
A) remain fixed as the price level stays constant.
B) change as the price level stays constant.
C) remain fixed as the price level changes.
D) change as the price level changes.
A) remain fixed as the price level stays constant.
B) change as the price level stays constant.
C) remain fixed as the price level changes.
D) change as the price level changes.
Unlock Deck
Unlock for access to all 122 flashcards in this deck.
Unlock Deck
k this deck
13
With demand-pull inflation in the long-run AD-AS model, there is:
A) a decrease in aggregate demand that eventually increases nominal wages and causes a decrease in the short-run aggregate supply curve.
B) an increase in aggregate demand that eventually increases nominal wages and causes an increase in the short-run aggregate supply curve.
C) an increase in aggregate demand that eventually decreases nominal wages and causes a decrease in the short-run aggregate supply curve.
D) an increase in aggregate demand that eventually increases nominal wages and causes a decrease in the short-run aggregate supply curve.
Unlock Deck
Unlock for access to all 122 flashcards in this deck.
Unlock Deck
k this deck
14
The equilibrium price level and level of real output occur where:
A) real output is at its highest possible level.
B) exports equal imports.
C) price is at its lowest level.
D) the aggregate demand and supply curves intersect.
A) real output is at its highest possible level.
B) exports equal imports.
C) price is at its lowest level.
D) the aggregate demand and supply curves intersect.
Unlock Deck
Unlock for access to all 122 flashcards in this deck.
Unlock Deck
k this deck
15
Refer to the above diagram. Assume that nominal wages initially are set on the basis of the price level P2 and that the economy initially is operating at its full-employment level of output Qf. In terms of this diagram, the long-run aggregate supply curve:
A) is AS2.
B) is a vertical line extending from Qf upward through e, b, and d.
C) may be either AS1, AS2, or AS3 depending on whether the price level is P1, P2, or P3.
D) is a horizontal line extending from P2 rightward through f, b, and g.
Unlock Deck
Unlock for access to all 122 flashcards in this deck.
Unlock Deck
k this deck
16
In the short run, demand-pull inflation increases:
A) real wages, but in the long run only nominal wages.
B) nominal wages, but in the long run only real wages.
C) real output and the price level, but in the long-run only real output.
D) real output and the price level, but in the long-run only the price level.
A) real wages, but in the long run only nominal wages.
B) nominal wages, but in the long run only real wages.
C) real output and the price level, but in the long-run only real output.
D) real output and the price level, but in the long-run only the price level.
Unlock Deck
Unlock for access to all 122 flashcards in this deck.
Unlock Deck
k this deck
17
If there is sufficient time for wage contracts to expire and nominal wage adjustments to occur, then the:
A) economy is operating in the short run.
B) economy has entered the long run.
C) unemployment rate will increase.
D) inflation rate will decrease.
A) economy is operating in the short run.
B) economy has entered the long run.
C) unemployment rate will increase.
D) inflation rate will decrease.
Unlock Deck
Unlock for access to all 122 flashcards in this deck.
Unlock Deck
k this deck
18
Refer to the above diagram. Assume that nominal wages initially are set on the basis of the price level P2 and that the economy initially is operating at its full-employment level of output Q f. In the short run, an increase in the price level from P2 to P3 will:
A) change aggregate supply from AS2 to AS3.
B) increase real output from Q1 to Q2.
C) change aggregate supply from AS2 to AS1.
D) increase real output from Q f to Q2.
Unlock Deck
Unlock for access to all 122 flashcards in this deck.
Unlock Deck
k this deck
19
In terms of aggregate supply, the short run is a period in which:
A) the price level is constant.
B) employment is constant.
C) real GDP is constant.
D) nominal wages and other input prices are constant.
A) the price level is constant.
B) employment is constant.
C) real GDP is constant.
D) nominal wages and other input prices are constant.
Unlock Deck
Unlock for access to all 122 flashcards in this deck.
Unlock Deck
k this deck
20
Refer to the above diagram. The initial aggregate demand curve is AD1 and the initial aggregate supply curve is AS1. Demand-pull inflation in the short run is best shown as:
A) a shift of the aggregate demand curve from AD1 to AD2.
B) a move from d to b to a.
C) a move directly from d to a.
D) a shift of the aggregate supply curve from AS1 to AS2.
Unlock Deck
Unlock for access to all 122 flashcards in this deck.
Unlock Deck
k this deck
21
One policy dilemma posed by cost-push inflation is that:
A) an increase in aggregate demand will increase inflation and the unemployment rate simultaneously.
B) tax rates can be reduced without lowering tax revenues.
C) the reduction of aggregate demand to restrain inflation will cause a further reduction in the real GDP.
D) the adjustment of aggregate demand can neither increase real GDP nor reduce inflation.
Unlock Deck
Unlock for access to all 122 flashcards in this deck.
Unlock Deck
k this deck
22
Refer to the above diagram and assume that prices and wages are flexible both upward and downward in the economy. In the long run AD-AS model:
A) demand-pull inflation would involve a shift of curve D to the right.
B) cost-push inflation would involve a shift of curve B downward.
C) recession would involve a leftward shift of curve A.
D) frictional unemployment would be zero in the long run.
Unlock Deck
Unlock for access to all 122 flashcards in this deck.
Unlock Deck
k this deck
23
Refer to the graph below. The economy is initially at equilibrium when AD1 and AS1 intersect. If there is cost-push inflation in the economy so that aggregate supply shifts from AS1 to AS2, then to reduce unemployment the government may increase aggregate demand which in the short run shifts:
A) AD1 to AD2, increases the price level from P1 to P2, and increases real domestic output from Q1 to Q2.
B) AD1 to AD2, increases the price level from P2 to P3, and increases real domestic output from Q1 to Q2.
C) AD1 to AD2, increases the price level from P2 to P3, and increases real domestic output from Q2 to Q1.
D) AD2 to AD1, decreases the price level from P3 to P2, and decreases real domestic output from Q1 to Q2.
Unlock Deck
Unlock for access to all 122 flashcards in this deck.
Unlock Deck
k this deck
24
Assuming prices and wages are flexible, a recession will decrease the price level, which:
A) raises nominal wages, and which eventually decreases the short-run aggregate supply curve, thus decreasing real output to its original level.
B) raises nominal wages, and which eventually increases the short-run aggregate supply curve, thus increasing real output to its original level.
C) reduces nominal wages, and which eventually decreases the short-run aggregate supply curve, thus decreasing real output to its original level.
D) reduces nominal wages, and which eventually increases the short-run aggregate supply curve, thus increasing real output to its original level.
Unlock Deck
Unlock for access to all 122 flashcards in this deck.
Unlock Deck
k this deck
25
Cost-push inflation results directly from a(n):
A) decrease in per unit production costs that shift the short-run aggregate supply curve to the right .
B) increase in per unit production costs that shift the short-run aggregate supply curve to the left
C) increase in government spending.
D) decrease in government regulation.
A) decrease in per unit production costs that shift the short-run aggregate supply curve to the right .
B) increase in per unit production costs that shift the short-run aggregate supply curve to the left
C) increase in government spending.
D) decrease in government regulation.
Unlock Deck
Unlock for access to all 122 flashcards in this deck.
Unlock Deck
k this deck
26
Refer to the diagram below. The initial aggregate demand curve is AD1 and the initial aggregate supply curve is AS1. Assuming no change in aggregate demand, the long-run response to a recession caused by cost-push inflation is best depicted as a:
A) move from a to d along the long-run aggregate supply curve.
B) rightward shift of the aggregate supply curve from AS2 to AS1.
C) move from a to c to d.
D) leftward shift of the aggregate supply curve from AS1 to AS2.
A) move from a to d along the long-run aggregate supply curve.
B) rightward shift of the aggregate supply curve from AS2 to AS1.
C) move from a to c to d.
D) leftward shift of the aggregate supply curve from AS1 to AS2.
Unlock Deck
Unlock for access to all 122 flashcards in this deck.
Unlock Deck
k this deck
27
Refer to the above graph. Given that the economy is at an initial equilibrium where the AD1 and AS1 curves intersect, demand-pull inflation in the short run can best be represented by a shift from:
A) AS1 to AS3.
B) AD1 to AD2.
C) AS1 to AS2.
D) AD2 to AD1.
Unlock Deck
Unlock for access to all 122 flashcards in this deck.
Unlock Deck
k this deck
28
If government fiscal policy is used to restrain cost-push inflation, we can expect:
A) the unemployment rate to rise.
B) the unemployment rate to fall.
C) the aggregate demand curve to shift rightward.
D) tax-rate declines and increases in government spending.
A) the unemployment rate to rise.
B) the unemployment rate to fall.
C) the aggregate demand curve to shift rightward.
D) tax-rate declines and increases in government spending.
Unlock Deck
Unlock for access to all 122 flashcards in this deck.
Unlock Deck
k this deck
29
Refer to the above graph. Assume that the economy is initially at equilibrium at point A. If there is a recession in the economy such that AD1 shifts to AD2, and wages and prices are flexible, then in the long run the price level will be:
A) P2, and real output will be Qf.
B) P3, and real output will be Qf.
C) P1, and real output will be Qf.
D) P2, and real output will be Q1.
Unlock Deck
Unlock for access to all 122 flashcards in this deck.
Unlock Deck
k this deck
30
Refer to the above diagram. The initial aggregate demand curve is AD1 and the initial aggregate supply curve is AS1. In the long run, demand-pull inflation is best shown as:
A) a shift of aggregate demand from AD1 to AD2 followed by a shift of aggregate supply from AS1 to AS2.
B) a move from d to b to a.
C) a shift of aggregate supply from AS1 to AS2 followed by a shift of aggregate demand from AD1 to AD2.
D) a move from a to d.
Unlock Deck
Unlock for access to all 122 flashcards in this deck.
Unlock Deck
k this deck
31
If prices and wages are flexible, a recession arising from a decrease in aggregate demand will:
A) decrease the price level.
B) increase the price level.
C) increase the interest rate.
D) increase net exports.
A) decrease the price level.
B) increase the price level.
C) increase the interest rate.
D) increase net exports.
Unlock Deck
Unlock for access to all 122 flashcards in this deck.
Unlock Deck
k this deck
32
If government uses its stabilization policies to maintain full employment under conditions of cost-push inflation:
A) a deflationary spiral is likely to occur.
B) an inflationary spiral is likely to occur.
C) stagflation is likely to occur.
D) the Phillips Curve is likely to shift inward.
A) a deflationary spiral is likely to occur.
B) an inflationary spiral is likely to occur.
C) stagflation is likely to occur.
D) the Phillips Curve is likely to shift inward.
Unlock Deck
Unlock for access to all 122 flashcards in this deck.
Unlock Deck
k this deck
33
Refer to the above diagram. The initial aggregate demand curve is AD1 and the initial aggregate supply curve is AS1. Cost-push inflation in the short run is best represented as a:
A) leftward shift of the aggregate supply curve from AS1 to AS2.
B) rightward shift of the aggregate demand curve from AD1 to AD2.
C) move from d to b to a.
D) move from d directly to a.
Unlock Deck
Unlock for access to all 122 flashcards in this deck.
Unlock Deck
k this deck
34
What will occur in the short run if there is cost-push inflation and if the government adopts a hands-off approach to it?
A) an increase in long-run aggregate supply
B) a decrease in long-run aggregate supply
C) low unemployment and a loss of real output
D) high unemployment and a loss of real output
A) an increase in long-run aggregate supply
B) a decrease in long-run aggregate supply
C) low unemployment and a loss of real output
D) high unemployment and a loss of real output
Unlock Deck
Unlock for access to all 122 flashcards in this deck.
Unlock Deck
k this deck
35
The initial aggregate demand curve is AD1 and the initial aggregate supply curve is AS1. In the long run, the aggregate supply curve is vertical in the diagram because:
A) nominal wages and other input prices are assumed to be fixed.
B) real output level Qf is the potential level of output.
C) price level increases produce perfectly offsetting changes in nominal wages and other input prices.
D) higher than expected rates of actual inflation reduce real output only temporarily.
Unlock Deck
Unlock for access to all 122 flashcards in this deck.
Unlock Deck
k this deck
36
An increase in inflation is likely to occur when government:
A) counters cost-push inflation with a stimulative fiscal policy or monetary policy.
B) adopts a hands-off approach to cost-push inflation.
C) increases aggregate supply by lowering nominal wages.
D) increases aggregate demand by raising nominal wages.
A) counters cost-push inflation with a stimulative fiscal policy or monetary policy.
B) adopts a hands-off approach to cost-push inflation.
C) increases aggregate supply by lowering nominal wages.
D) increases aggregate demand by raising nominal wages.
Unlock Deck
Unlock for access to all 122 flashcards in this deck.
Unlock Deck
k this deck
37
Refer to the above diagram. The initial aggregate demand curve is AD1 and the initial aggregate supply curve is AS1. If government offsets the decline in real output resulting from short-run cost-push inflation by increasing aggregate demand from AD1 to AD2:
A) real output will rise above Qf.
B) the price level will rise from P1 to P2.
C) it is possible that aggregate supply will shift rightward from AS2 because nominal wage demands will rise.
D) the price level will rise from P2 to P3.
Unlock Deck
Unlock for access to all 122 flashcards in this deck.
Unlock Deck
k this deck
38
Refer to the above graph. Assume that the economy is at equilibrium at AD1 and AS1 and then is hit with both demand-pull and cost-push inflation. If this occurs, then, in the short run:
A) AD1 will shift to AD2, AS2 will shift to AS3, the price level will be at P2, and output will be at Q2.
B) AS1 will shift to AS3, AD2 will shift to AD1, the price level will be at P3, and output will be at Q3.
C) AD1 will shift to AD2, AS1 will shift to AS2, the price level will be at P2, and output will be at Q2.
D) AD1 will shift to AD2, AS1 will shift to AS2, the price level will be at P3, and output will be at Q1.
Unlock Deck
Unlock for access to all 122 flashcards in this deck.
Unlock Deck
k this deck
39
Refer to the graph below. Assume that the economy is in initial equilibrium where AS1 intersects AD1. Then a supply shock occurs that shifts AS1 to AS2. If the government counters with an expansionary fiscal policy that shifts AD1 to AD2, then it is most likely that:
A) AD2 will shift to AD1.
B) AS2 will shift to AS1.
C) AS2 will shift to AS3.
D) AS2 will shift to AS3 and AD2 will shift to AD1.
A) AD2 will shift to AD1.
B) AS2 will shift to AS1.
C) AS2 will shift to AS3.
D) AS2 will shift to AS3 and AD2 will shift to AD1.
Unlock Deck
Unlock for access to all 122 flashcards in this deck.
Unlock Deck
k this deck
40
In the long-run, the attempt to correct slow economic growth or the unemployment caused by cost-push inflation by implementing an expansionary fiscal policy will most likely produce:
A) disinflation.
B) a recession.
C) a price level surprise.
D) inflation
A) disinflation.
B) a recession.
C) a price level surprise.
D) inflation
Unlock Deck
Unlock for access to all 122 flashcards in this deck.
Unlock Deck
k this deck
41
Although the increase in long-run aggregate supply (other things equal), would expand real GDP and lower the price level, the declines in the price level has not been part of Canada's growth experience. This is because:
A) the Bank of Canada has taken no action to change the nation's money supply.
B) the Bank of Canada has increased the money supply much less than the increase in aggregate supply .
C) the increase in the money supply by Bank of Canada has matched the increase in aggregate supply.
D) the Bank of Canada usually engineers inflationary rightward shifts of the aggregate demand curve that are faster than the deflationary rightward shifts of the aggregate supply curve.
Unlock Deck
Unlock for access to all 122 flashcards in this deck.
Unlock Deck
k this deck
42
Aggregate supply shocks will:
A) move the economy along the Phillips Curve toward less unemployment.
B) move the economy along the Phillips Curve toward less inflation.
C) shift the Phillips Curve to the left.
D) shift the Phillips Curve to the right.
A) move the economy along the Phillips Curve toward less unemployment.
B) move the economy along the Phillips Curve toward less inflation.
C) shift the Phillips Curve to the left.
D) shift the Phillips Curve to the right.
Unlock Deck
Unlock for access to all 122 flashcards in this deck.
Unlock Deck
k this deck
43
Refer to the above diagram for a specific economy. Stagflation will:
A) shift this curve outward.
B) shift this curve inward.
C) move this economy southeast along the curve.
D) move this economy northwest along the curve.
Unlock Deck
Unlock for access to all 122 flashcards in this deck.
Unlock Deck
k this deck
44
Refer to the above diagram for a specific economy. The curve on this graph is known as a:
A) Laffer Curve.
B) Phillips Curve.
C) labor demand curve.
D) production possibilities curve.
Unlock Deck
Unlock for access to all 122 flashcards in this deck.
Unlock Deck
k this deck
45
A rightward shift of the Phillips Curve suggests that:
A) a higher rate of unemployment is associated with each inflation rate.
B) a lower rate of unemployment is associated with each inflation rate.
C) the aggregate supply curve has shifted to the right.
D) the aggregate demand curve has shifted to the left.
A) a higher rate of unemployment is associated with each inflation rate.
B) a lower rate of unemployment is associated with each inflation rate.
C) the aggregate supply curve has shifted to the right.
D) the aggregate demand curve has shifted to the left.
Unlock Deck
Unlock for access to all 122 flashcards in this deck.
Unlock Deck
k this deck
46
Refer to the above diagram for a specific economy. Which of the following best describes the relationship shown by this curve?
A) The demand for labor is large when the rate of inflation is small.
B) When the rate of unemployment is high, the rate of inflation is high.
C) The rate of inflation and the rate of unemployment are inversely related.
D) The rate of inflation and the rate of unemployment are directly related.
Unlock Deck
Unlock for access to all 122 flashcards in this deck.
Unlock Deck
k this deck
47
An adverse aggregate supply shock:
A) automatically shifts the aggregate demand curve rightward.
B) causes the Phillips Curve to shift leftward and downward.
C) can be caused by a boost in the rate of growth of productivity.
D) can cause stagflation.
A) automatically shifts the aggregate demand curve rightward.
B) causes the Phillips Curve to shift leftward and downward.
C) can be caused by a boost in the rate of growth of productivity.
D) can cause stagflation.
Unlock Deck
Unlock for access to all 122 flashcards in this deck.
Unlock Deck
k this deck
48
The Phillips Curve is based on the idea that with a constant short-run aggregate supply curve, a greater increase in aggregate demand is associated with a:
A) smaller increase in price level.
B) smaller increase in nominal wage rates.
C) greater increase in the unemployment rate.
D) greater increase in the rate of inflation.
A) smaller increase in price level.
B) smaller increase in nominal wage rates.
C) greater increase in the unemployment rate.
D) greater increase in the rate of inflation.
Unlock Deck
Unlock for access to all 122 flashcards in this deck.
Unlock Deck
k this deck
49
An "adverse aggregate supply shock" could result from:
A) a sharp rise in productivity.
B) a rapid rise in oil prices.
C) a decline in wages.
D) an appreciation of the dollar.
A) a sharp rise in productivity.
B) a rapid rise in oil prices.
C) a decline in wages.
D) an appreciation of the dollar.
Unlock Deck
Unlock for access to all 122 flashcards in this deck.
Unlock Deck
k this deck
50
Refer to the above diagram for a specific economy. An increase in aggregate demand will:
A) shift this curve to the right.
B) shift this curve to the left.
C) move this economy southeast along the curve.
D) move this economy northwest along the curve.
Unlock Deck
Unlock for access to all 122 flashcards in this deck.
Unlock Deck
k this deck
51
Refer to the above diagram for a specific economy. Which of the following best describes a decision by policymakers which moves this economy from point b to point a?
A) Policymakers have instituted an expansionary money policy and/or a budgetary deficit, thereby accepting more unemployment to reduce the rate of inflation.
B) Policymakers have instituted a tight money policy and/or a budgetary surplus, thereby accepting a higher rate of inflation to reduce unemployment.
C) Policymakers have instituted an expansionary money and/or a budgetary deficit, thereby accepting a higher rate of inflation to reduce unemployment.
D) Policymakers have instituted a tight money policy and/or a budgetary surplus, thereby accepting more unemployment to reduce the rate of inflation.
Unlock Deck
Unlock for access to all 122 flashcards in this deck.
Unlock Deck
k this deck
52
The Phillips Curve reveals that with a constant short-run aggregate supply curve, the larger the increase in aggregate demand:
A) the lesser the increase in real output and the higher the rate of inflation.
B) the greater the increase in real output and the higher the rate of inflation.
C) the greater the increase in real output and the lower the rate of inflation.
D) the lesser the increase in real output and the lower the rate of inflation.
Unlock Deck
Unlock for access to all 122 flashcards in this deck.
Unlock Deck
k this deck
53
The Phillips Curve suggests that, if government uses an expansionary fiscal policy to stimulate output and employment:
A) unemployment may actually increase because of the crowding-out effect.
B) tax revenues may increase even though tax rates have been reduced.
C) inflation may result.
D) the natural rate of unemployment may fall.
A) unemployment may actually increase because of the crowding-out effect.
B) tax revenues may increase even though tax rates have been reduced.
C) inflation may result.
D) the natural rate of unemployment may fall.
Unlock Deck
Unlock for access to all 122 flashcards in this deck.
Unlock Deck
k this deck
54
In the long-run, any inflation that occurs in the economy is the result of:
A) the reduction in the rate of increase in money supply.
B) the growth of aggregate supply.
C) the growth of aggregate demand.
D) the growth of real GDP.
A) the reduction in the rate of increase in money supply.
B) the growth of aggregate supply.
C) the growth of aggregate demand.
D) the growth of real GDP.
Unlock Deck
Unlock for access to all 122 flashcards in this deck.
Unlock Deck
k this deck
55
The basic problem portrayed by the Phillips Curve is:
A) that a level of aggregate demand sufficiently high to result in full employment may also cause inflation.
B) that changes in the composition of total labor demand tend to be deflationary.
C) that unemployment rises at the same time the general price level is rising.
D) the possibility that automation will increase the level of noncyclical unemployment.
Unlock Deck
Unlock for access to all 122 flashcards in this deck.
Unlock Deck
k this deck
56
Refer to the above diagram for a specific economy. The shape of this curve suggests that:
A) the price level rises at a diminishing rate as the level of aggregate demand increases.
B) full employment and price stability are compatible goals only when aggregate demand is falling.
C) each successive unit of decline in the unemployment rate is accompanied by a smaller increase in the rate of inflation.
D) each successive unit of decline in the unemployment rate is accompanied by a larger increase in the rate of inflation.
Unlock Deck
Unlock for access to all 122 flashcards in this deck.
Unlock Deck
k this deck
57
The Phillips Curve suggests a tradeoff between:
A) price level stability and income equality.
B) the level of unemployment and price level stability.
C) unemployment and income equality.
D) economic growth and full employment.
A) price level stability and income equality.
B) the level of unemployment and price level stability.
C) unemployment and income equality.
D) economic growth and full employment.
Unlock Deck
Unlock for access to all 122 flashcards in this deck.
Unlock Deck
k this deck
58
Adverse aggregate supply shocks would result in:
A) a lower rate of inflation and a higher rate of unemployment.
B) a higher rate of inflation and a lower rate of unemployment.
C) a lower rate of inflation and a lower rate of unemployment.
D) a higher rate of inflation and a higher rate of unemployment.
A) a lower rate of inflation and a higher rate of unemployment.
B) a higher rate of inflation and a lower rate of unemployment.
C) a lower rate of inflation and a lower rate of unemployment.
D) a higher rate of inflation and a higher rate of unemployment.
Unlock Deck
Unlock for access to all 122 flashcards in this deck.
Unlock Deck
k this deck
59
Refer to the above graph. Assume that the economy is initially at equilibrium at point A. If there is a recession in this economy such that AD1 shifts to AD2, and wages and prices are flexible, then the long-run aggregate supply curve will be:
A) AS2.
B) AS1.
C) a vertical line at Qf.
D) a vertical line at Q1.
Unlock Deck
Unlock for access to all 122 flashcards in this deck.
Unlock Deck
k this deck
60
Economic growth driven by supply factors causes:
A) continuous leftward shifts of aggregate supply.
B) a rightward shift of an economy's long-run aggregate supply.
C) one time shift in aggregate supply.
D) no shift in aggregate supply.
A) continuous leftward shifts of aggregate supply.
B) a rightward shift of an economy's long-run aggregate supply.
C) one time shift in aggregate supply.
D) no shift in aggregate supply.
Unlock Deck
Unlock for access to all 122 flashcards in this deck.
Unlock Deck
k this deck
61
Refer to the above graph. The long-run relationship between the rate of inflation and the unemployment rate is represented by:
A) the zigzag line connecting points B1, C1, B2, C2, B3, C3, and B4.
B) a line connecting points C1, C2, and C3.
C) a line connecting points B1, B2, B3, and B4.
D) a line connecting points B1 and C1.
Unlock Deck
Unlock for access to all 122 flashcards in this deck.
Unlock Deck
k this deck
62
Refer to the above diagram. The move of the economy from c to e on short-run Phillips Curve PC2 would be explained by an:
A) increase in aggregate demand in the economy.
B) increase in aggregate supply in the economy.
C) actual rate of inflation that is less than the expected rate.
D) actual rate of inflation that exceeds the expected rate.
Unlock Deck
Unlock for access to all 122 flashcards in this deck.
Unlock Deck
k this deck
63
Refer to the above diagram. Point b on short-run Phillips Curve PC1 represents a rate of:
A) inflation below the natural rate.
B) inflation above the natural rate.
C) unemployment above the natural rate.
D) unemployment below the natural rate.
Unlock Deck
Unlock for access to all 122 flashcards in this deck.
Unlock Deck
k this deck
64
Refer to the above graph. The full-employment unemployment rate in this economy would be:
A) 5 percent.
B) 6 percent.
C) 7 percent.
D) 5-6 percent.
Unlock Deck
Unlock for access to all 122 flashcards in this deck.
Unlock Deck
k this deck
65
Refer to the graph below. The effects of stagflation, in the short run, are best represented by a shift from:
A) AD1 to AD2 given a stable AS1 curve, an increase in the price level from P1 to P2, and a fall in output from Q1 to Q2.
B) AD2 to AD1 given a stable AS1 curve, an increase in the price level from P1 to P2, and a fall in output from Q1 to Q2.
C) AS1 to AS2 given a stable AD1 curve, an increase in the price level from P1 to P2, and a fall in output from Q1 to Q2.
D) AS2 to AS1 given a stable AD1 curve, an increase in the price level from P1 to P2, and a fall in output from Q1 to Q2.
Unlock Deck
Unlock for access to all 122 flashcards in this deck.
Unlock Deck
k this deck
66
A major adverse aggregate supply shock:
A) automatically shifts the aggregate demand curve rightward.
B) causes the Phillips Curve to shift outward .
C) can be caused by rising productivity.
D) can be caused by falling wages.
A) automatically shifts the aggregate demand curve rightward.
B) causes the Phillips Curve to shift outward .
C) can be caused by rising productivity.
D) can be caused by falling wages.
Unlock Deck
Unlock for access to all 122 flashcards in this deck.
Unlock Deck
k this deck
67
Refer to the above graph. The economy is at point B2, and aggregate demand increases. In the short run, the economy will:
A) stay at point B2.
B) move to point C2 and in the long run to B3.
C) move to point B3 and in the long run to C2.
D) move to point B1 and in the long run to B1.
Unlock Deck
Unlock for access to all 122 flashcards in this deck.
Unlock Deck
k this deck
68
Refer to the above graph. If the economy moves from point B3 to point C3 because of an increase in aggregate demand, then:
A) nominal wages will rise, reducing profits and thereby negating the short-run stimulus to production and employment so that the economy moves from C3 to B4.
B) real wages will rise, reducing profits and thereby negating the short-run stimulus to production and employment so that the economy moves from C3 to B3.
C) nominal wages will rise, reducing profits and thereby negating the short-run stimulus to production and employment so that the economy moves from C3 to B3.
D) nominal wages will rise, reducing profits and thereby negating the short-run stimulus to production and employment so that the economy moves from C3 to C2.
Unlock Deck
Unlock for access to all 122 flashcards in this deck.
Unlock Deck
k this deck
69
Inflation accompanied by falling real output and employment is known as:
A) Laffer's law.
B) Okun's law.
C) stagflation.
D) the Phillips Curve.
A) Laffer's law.
B) Okun's law.
C) stagflation.
D) the Phillips Curve.
Unlock Deck
Unlock for access to all 122 flashcards in this deck.
Unlock Deck
k this deck
70
Refer to the above graph. Assume the economy is at the initial position of B1. An increase in aggregate demand will tend to:
A) temporarily shift the economy to point B2.
B) temporarily shift the economy to point C1.
C) permanently shift the economy to point C1.
D) have no effect in shifting the economy from point B1.
Unlock Deck
Unlock for access to all 122 flashcards in this deck.
Unlock Deck
k this deck
71
Refer to the above diagram and assume the economy is initially at point b1. Which of the following movements is consistent with The Phillips Curve?
A) the movement from B1 to B2
B) the movement from B1 to C1
C) the movement from C1 to B2
D) the movement from B2 to B1
Unlock Deck
Unlock for access to all 122 flashcards in this deck.
Unlock Deck
k this deck
72
In the conventional view, outward shifts of the Phillips Curve in the 1970s and early 1980s were caused by:
A) adverse shocks to aggregate supply.
B) adverse shocks to aggregate demand.
C) an increase in the misery index.
D) the Vietnam War.
A) adverse shocks to aggregate supply.
B) adverse shocks to aggregate demand.
C) an increase in the misery index.
D) the Vietnam War.
Unlock Deck
Unlock for access to all 122 flashcards in this deck.
Unlock Deck
k this deck
73
Refer to the above graph. What events would tend to move the economy from point B2 to C2?
A) a tight monetary policy
B) a contractionary fiscal policy
C) an increase in aggregate demand
D) an increase in aggregate supply
Unlock Deck
Unlock for access to all 122 flashcards in this deck.
Unlock Deck
k this deck
74
Which of the following most significantly contributed to the 1970s and early 1980s' stagflation?
A) appreciation of the dollar
B) a sharp drop in the prices of farm products
C) a dramatic increase in energy prices
D) rising productivity in manufacturing
A) appreciation of the dollar
B) a sharp drop in the prices of farm products
C) a dramatic increase in energy prices
D) rising productivity in manufacturing
Unlock Deck
Unlock for access to all 122 flashcards in this deck.
Unlock Deck
k this deck
75
Which factor contributed to the termination of stagflation in the 1980s?
A) less foreign competition
B) more government regulation
C) a reduction in oil prices
D) a rise in per-unit production costs
A) less foreign competition
B) more government regulation
C) a reduction in oil prices
D) a rise in per-unit production costs
Unlock Deck
Unlock for access to all 122 flashcards in this deck.
Unlock Deck
k this deck
76
A rightward shift of The Phillips Curve would suggest that:
A) the productivity of labour increased.
B) each higher rate of inflation is now associated with a higher rate of unemployment than previously.
C) cost-push inflation decreased.
D) a lower rate of inflation is now associated with each rate of unemployment than previously.
A) the productivity of labour increased.
B) each higher rate of inflation is now associated with a higher rate of unemployment than previously.
C) cost-push inflation decreased.
D) a lower rate of inflation is now associated with each rate of unemployment than previously.
Unlock Deck
Unlock for access to all 122 flashcards in this deck.
Unlock Deck
k this deck
77
"Stagflation" refers to:
A) an increase in inflation accompanied by decreases in real output and employment.
B) a decline in the price level accompanied by increases in real output and employment.
C) a simultaneous increase in real output and the price level.
D) a simultaneous reduction in real output and the price level.
A) an increase in inflation accompanied by decreases in real output and employment.
B) a decline in the price level accompanied by increases in real output and employment.
C) a simultaneous increase in real output and the price level.
D) a simultaneous reduction in real output and the price level.
Unlock Deck
Unlock for access to all 122 flashcards in this deck.
Unlock Deck
k this deck
78
Refer to the above diagram and assume the economy is initially at point b1. According to the adaptive expectations theorists, the long-run relationship between the unemployment rate and the rate of inflation is represented by:
A) the line connecting B1 and C1.
B) the line through B1, B2, B3, and B4.
C) the line connecting C1 and B2.
D) any line parallel to the horizontal axis.
Unlock Deck
Unlock for access to all 122 flashcards in this deck.
Unlock Deck
k this deck
79
Statistical data for the 1970s and 1980s suggest that:
A) the Phillips Curve was stable.
B) the Phillips Curve was unstable.
C) low levels of unemployment were consistently associated with high rates of inflation.
D) the inflation rate was highly stable.
A) the Phillips Curve was stable.
B) the Phillips Curve was unstable.
C) low levels of unemployment were consistently associated with high rates of inflation.
D) the inflation rate was highly stable.
Unlock Deck
Unlock for access to all 122 flashcards in this deck.
Unlock Deck
k this deck
80
Refer to the above diagram and assume the economy is initially at point b1. If workers fully anticipate price level increases and government uses expansionary policies to lower the unemployment rate below 6 percent, the economy will:
A) move from B1 to C1, at which point macroeconomic policies will cease to be effective.
B) remain at B1.
C) follow the path indicated by B1, B2, B3, and B4.
D) follow the path indicated by B1, C1, B2, C2, B3, etc.
Unlock Deck
Unlock for access to all 122 flashcards in this deck.
Unlock Deck
k this deck
Unlock Deck
Unlock for access to all 122 flashcards in this deck.


