Exam 15: Long-Run Macroeconomic Adjustments
Exam 1: Limits, Alternatives, and Choices261 Questions
Exam 2: The Market System and the Circular Flow112 Questions
Exam 4: Introduction to Macroeconomics58 Questions
Exam 5: Measuring the Economys Output183 Questions
Exam 6: Economic Growth113 Questions
Exam 7: Business Cycles, Unemployment, and Inflation184 Questions
Exam 8: Basic Macroeconomic Relationships188 Questions
Exam 9: The Aggregate Expenditures Model235 Questions
Exam 10: Aggregate Demand and Aggregate Supply195 Questions
Exam 11: Fiscal Policy, Deficits, Surpluses, and Debt223 Questions
Exam 12: Money, Banking, and Money Creation286 Questions
Exam 13: Interest Rates and Monetary Policy376 Questions
Exam 14: Financial Economics51 Questions
Exam 15: Long-Run Macroeconomic Adjustments122 Questions
Exam 16: International Trade181 Questions
Exam 17: Exchange Rates and the Balance of Payments127 Questions
Select questions type
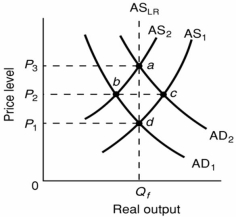 -Refer to the above diagram. The initial aggregate demand curve is AD1 and the initial aggregate supply curve is AS1. If government offsets the decline in real output resulting from short-run cost-push inflation by increasing aggregate demand from AD1 to AD2:
Free
(Multiple Choice)
4.8/5  (35)
(35)
Correct Answer: Verified
D
An adverse aggregate supply shock:
Free
(Multiple Choice)
4.8/5 (36)
Correct Answer:Verified
D
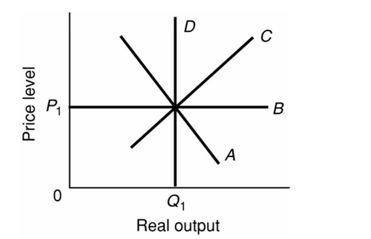
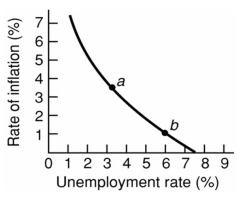 -Refer to the above diagram for a specific economy. Which of the following best describes the relationship shown by this curve?
Free
(Multiple Choice)
4.6/5 (29)
Correct Answer:Verified
C
-Refer to the above diagram for a specific economy. The shape of this curve suggests that:
(Multiple Choice)
4.7/5 (38)
Many economists doubt the proposition that supply-side tax cuts increase aggregate:
(Multiple Choice)
4.9/5 (37)
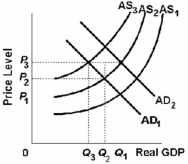 -Refer to the above graph. Given that the economy is at an initial equilibrium where the AD1 and AS1 curves intersect, demand-pull inflation in the short run can best be represented by a shift from:
(Multiple Choice)
4.8/5 (38)
The Laffer Curve suggests that lower tax rates will decrease saving and increase consumption.
(True/False)
4.9/5 (25)
The short-run aggregate supply curve is vertical and the long-run aggregate supply curve is horizontal.
(True/False)
4.7/5 (35)
Demand-pull inflation in the short run increases the price level and:
(Multiple Choice)
4.7/5 (35)
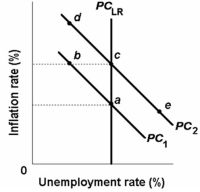 -Refer to the above diagram. The move of the economy from c to e on short-run Phillips Curve PC2 would be explained by an:
(Multiple Choice)
5.0/5 (37)
The short-run aggregate supply curve shifts to the left when nominal wages rise in response to price level increases.
(True/False)
4.9/5 (37)
 -Refer to the above diagram and assume that prices and wages are flexible both upward and downward in the economy. In the long run AD-AS model:
(Multiple Choice)
4.8/5 (38)
The long-run Phillips Curve is essentially a horizontal line at the economy's natural rate of unemployment.
(True/False)
4.9/5 (35)
-Refer to the above diagram. The initial aggregate demand curve is AD1 and the initial aggregate supply curve is AS1. Cost-push inflation in the short run is best represented as a:
(Multiple Choice)
4.7/5 (33)
What will occur in the short run if there is cost-push inflation and if the government adopts a hands-off approach to it?
(Multiple Choice)
4.8/5 (34)
More inflation is likely to result when the government enacts policies to maintain full employment when there is cost-push inflation.
(True/False)
4.8/5 (30)
Filters
- Essay(0)
- Multiple Choice(0)
- Short Answer(0)
- True False(0)
- Matching(0)