Deck 7: The Correlation Coefficient
Full screen (f)
Question
Question
Question
Question
If you see the notation  ,what should you do?
A)First multiply each X by its partner Y,then sum the results.
B)First sum the Xs then multiply the sum of the Xs by each Y.
C)First sum the Ys,then multiply the sum of the Ys by each X.
D)First sum the Xs,then sum the Ys,then multiply the sums.
,what should you do?A)First multiply each X by its partner Y,then sum the results.
B)First sum the Xs then multiply the sum of the Xs by each Y.
C)First sum the Ys,then multiply the sum of the Ys by each X.
D)First sum the Xs,then sum the Ys,then multiply the sums.
Question
Question
Question
Question
Question
Question
Question
Question
Question
What type of relationship does the following regression line represent? 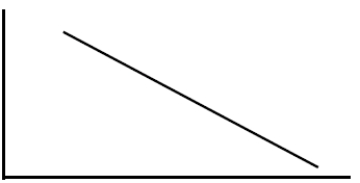
A)A positive relationship
B)A negative relationship
C)A curvilinear relationship
D)No relationship
A)A positive relationship
B)A negative relationship
C)A curvilinear relationship
D)No relationship
Question
Question
What type of relationship does the following regression line represent? 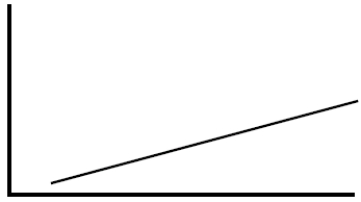
A)A positive relationship
B)A negative relationship
C)A curvilinear relationship
D)No relationship
A)A positive relationship
B)A negative relationship
C)A curvilinear relationship
D)No relationship
Question
Question
Question
Question
If you see the notation  ,what should you do?
A)First multiply each X by its partner Y,then sum the results.
B)First sum the Xs,then sum the Ys,then multiply the results.
C)First sum the Xs,then multiply the result by each Y.
D)First sum the Ys,then multiply the result by each X.
,what should you do?A)First multiply each X by its partner Y,then sum the results.
B)First sum the Xs,then sum the Ys,then multiply the results.
C)First sum the Xs,then multiply the result by each Y.
D)First sum the Ys,then multiply the result by each X.
Question
Question
Question
What kind of relationship is depicted in the following graph? 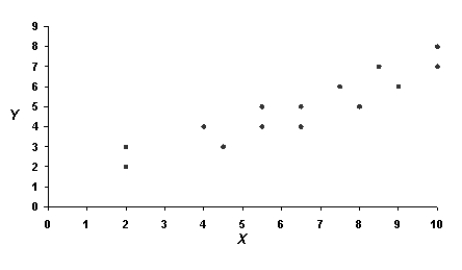
A)A positive linear correlation
B)A negative linear correlation
C)No correlation
D)A nonlinear correlation
A)A positive linear correlation
B)A negative linear correlation
C)No correlation
D)A nonlinear correlation
Question
Question
What type of relationship does the following regression line represent? 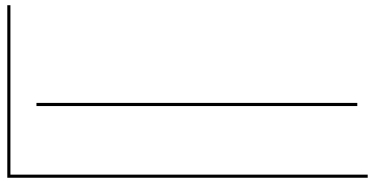
A)A positive relationship
B)A negative relationship
C)A curvilinear relationship
D)No relationship
A)A positive relationship
B)A negative relationship
C)A curvilinear relationship
D)No relationship
Question
What kind of relationship is depicted in the following graph? 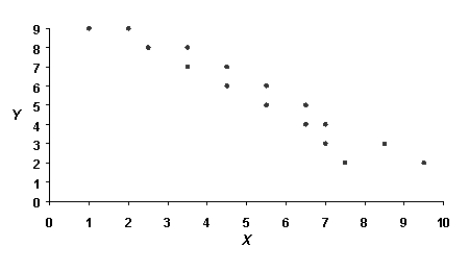
A)A positive linear correlation
B)A negative linear correlation
C)No correlation
D)A nonlinear correlation
A)A positive linear correlation
B)A negative linear correlation
C)No correlation
D)A nonlinear correlation
Question
Question
Question
Question
Question
Question
Calculate the appropriate correlation coefficient for the following data. 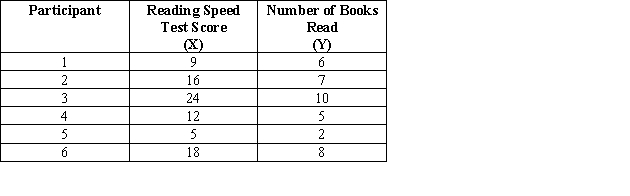
A)-0.07
B)+0.95
C)+0.49
D)+0.23
A)-0.07
B)+0.95
C)+0.49
D)+0.23
Question
What kind of relationship is depicted in the following graph? 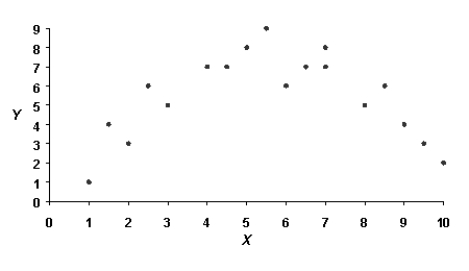
A)A positive linear correlation
B)A negative linear correlation
C)No correlation
D)A nonlinear correlation
A)A positive linear correlation
B)A negative linear correlation
C)No correlation
D)A nonlinear correlation
Question
Question
What kind of relationship is depicted in the following graph? 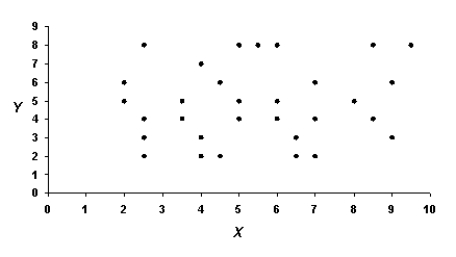
A)A positive linear correlation
B)A negative linear correlation
C)No correlation
D)A nonlinear correlation
A)A positive linear correlation
B)A negative linear correlation
C)No correlation
D)A nonlinear correlation
Question
Question
Question
Which of the following studies represents the weakest relationship? 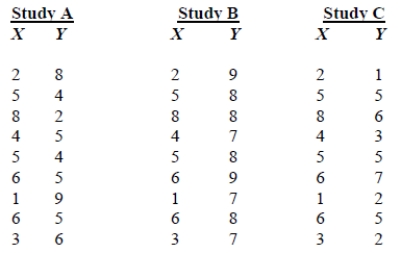
A)Study A
B)Study B
C)Study C
D)Cannot determine
A)Study A
B)Study B
C)Study C
D)Cannot determine
Question
Question
Question
Question
Calculate the appropriate correlation coefficient for the following data. 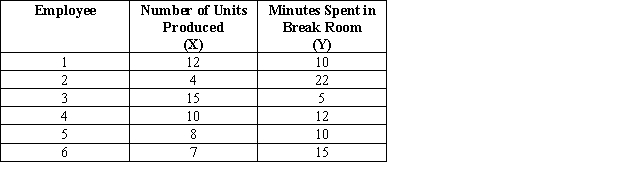
A)-0.92
B)-0.37
C)-0.06
D)+0.75
A)-0.92
B)-0.37
C)-0.06
D)+0.75
Question
Calculate the appropriate correlation coefficient for the following data. 
A)-0.52
B)+0.52
C)+0.83
D)+0.94
A)-0.52
B)+0.52
C)+0.83
D)+0.94
Question
Question
Question
Question
Calculate the appropriate correlation coefficient for the following data,assuming X is an interval variable and Y is a ratio variable. 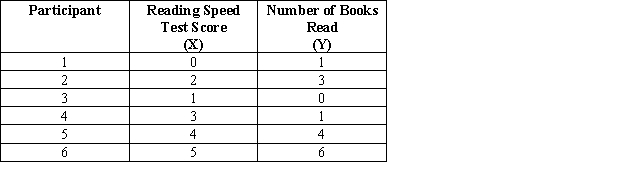
A)-0.65
B)+0.09
C)+0.40
D)+0.59
A)-0.65
B)+0.09
C)+0.40
D)+0.59
Question
Question
Question
Question
Calculate the appropriate correlation coefficient for the following data. 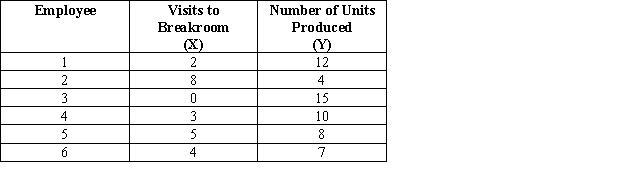
A)-0.97
B)-0.39
C)+0.11
D)+0.57
A)-0.97
B)-0.39
C)+0.11
D)+0.57
Question
Calculate the appropriate correlation coefficient for the following data 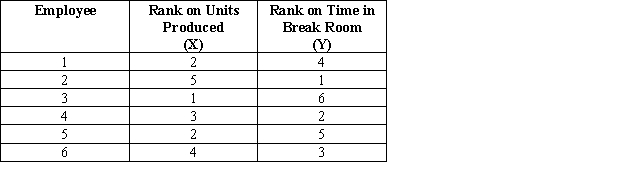
A)-0.68
B)+0.72
C)-0.41
D)-0.93
A)-0.68
B)+0.72
C)-0.41
D)-0.93
Question
As a part of her Master's Degree thesis in Geology,Candice needs to calculate a correlation coefficient between the amount of rainfall (measured in inches)and the height of the ground water table (measured in inches)in various parts of the continental U.S.Which formula should she use for this calculation?
A)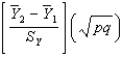
B)
C)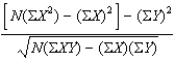
D)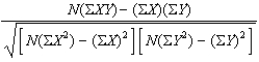
A)
B)
C)
D)

Unlock Deck
Sign up to unlock the cards in this deck!
Unlock Deck
Unlock Deck
1/52
Play
Full screen (f)
Deck 7: The Correlation Coefficient
1
When plotting correlational data,the appropriate graph to use is the
A)line graph.
B)bar graph.
C)histogram.
D)scatterplot.
A)line graph.
B)bar graph.
C)histogram.
D)scatterplot.
scatterplot.
2
What does a correlation coefficient do?
A)It allows us to draw conclusions about whether one variable causes another variable.
B)It creates a correlational design,rather than an experimental design.
C)It quantifies the pattern in a relationship.
D)It summarizes the X scores and the Y scores separately.
A)It allows us to draw conclusions about whether one variable causes another variable.
B)It creates a correlational design,rather than an experimental design.
C)It quantifies the pattern in a relationship.
D)It summarizes the X scores and the Y scores separately.
It quantifies the pattern in a relationship.
3
We should do a scatterplot of the data when we compute a correlation because the scatterplot allows us to
A)see the relationship between the two variables.
B)determine the exact value of the correlation coefficient.
C)determine whether a relationship is likely to exist in the population from which the sample is taken.
D)predict accurate Y scores for known X scores.
A)see the relationship between the two variables.
B)determine the exact value of the correlation coefficient.
C)determine whether a relationship is likely to exist in the population from which the sample is taken.
D)predict accurate Y scores for known X scores.
see the relationship between the two variables.
4
If you see the notation ,what should you do?
A)First multiply each X by its partner Y,then sum the results.
B)First sum the Xs then multiply the sum of the Xs by each Y.
C)First sum the Ys,then multiply the sum of the Ys by each X.
D)First sum the Xs,then sum the Ys,then multiply the sums.
,what should you do?A)First multiply each X by its partner Y,then sum the results.
B)First sum the Xs then multiply the sum of the Xs by each Y.
C)First sum the Ys,then multiply the sum of the Ys by each X.
D)First sum the Xs,then sum the Ys,then multiply the sums.
Unlock Deck
Unlock for access to all 52 flashcards in this deck.
Unlock Deck
k this deck
5
Using a correlational design,a researcher found a relationship between the healthiness of one's heart and the amount of fish oil in one's diet.The researcher should conclude that
A)a healthier heart causes one to consume more fish oil.
B)the amount of fish oil in one's diet causes a healthier heart.
C)although a relationship exists,one cannot infer that changes in one variable are causing changes in the other variable.
D)the availability of fish causes changes in both the healthiness of one's heart and the amount of fish oil consumed.
Unlock Deck
Unlock for access to all 52 flashcards in this deck.
Unlock Deck
k this deck
6
"The bigger they are,the harder they fall" describes
A)a positive linear correlation.
B)a negative linear correlation.
C)no correlation.
D)a nonlinear correlation.
A)a positive linear correlation.
B)a negative linear correlation.
C)no correlation.
D)a nonlinear correlation.
Unlock Deck
Unlock for access to all 52 flashcards in this deck.
Unlock Deck
k this deck
7
If we calculate a correlation coefficient and we find that there is a relationship between the two variables,we
A)know that the data must be interval or ratio.
B)know,without referring to the study,that a correlational design was used.
C)can conclude that changes in one variable cause changes in the other variable.
D)cannot conclude that changes in one variable cause changes in the other variable.
A)know that the data must be interval or ratio.
B)know,without referring to the study,that a correlational design was used.
C)can conclude that changes in one variable cause changes in the other variable.
D)cannot conclude that changes in one variable cause changes in the other variable.
Unlock Deck
Unlock for access to all 52 flashcards in this deck.
Unlock Deck
k this deck
8
In general,a positive correlation means that as the values of one variable _____,there is a tendency for the values of the other variable to _____.
A)increase;increase
B)increase;decrease
C)increase;remain the same
D)decrease;increase
A)increase;increase
B)increase;decrease
C)increase;remain the same
D)decrease;increase
Unlock Deck
Unlock for access to all 52 flashcards in this deck.
Unlock Deck
k this deck
9
In an experimental design _____,whereas in a correlational design _____.
A)there is only one variable (the independent variable);there are two variables (X and Y)
B)there are two X variables;there are an X and a Y variable
C)researchers assign each person an X score and then measure the score on the Y variable;researchers measure scores on variables that a participant has already experienced
D)researchers measure scores on variables that a participant has already experienced;researchers assign each person an X score and then measure the score on the Y variable
Unlock Deck
Unlock for access to all 52 flashcards in this deck.
Unlock Deck
k this deck
10
The best-fitting line through a scatterplot is known as the
A)scatterplot line.
B)correlation line.
C)variance line.
D)regression line.
A)scatterplot line.
B)correlation line.
C)variance line.
D)regression line.
Unlock Deck
Unlock for access to all 52 flashcards in this deck.
Unlock Deck
k this deck
11
Professor Johnston has found a strong positive correlation between wearing neckties and the frequency of strokes (r = 0.89).He thinks that the necktie reduces blood flow to the brain,preventing the brain from receiving enough oxygen.Professor Johnston and his associates claim to have proven that wearing neckties causes strokes.What error has Professor Johnston made?
A)An r = 0.89 is not a very large r-value.
B)Professor Johnston is drawing a causal conclusion from correlational findings.
C)Not everyone who wears a necktie wears it very tight.
D)Professor Johnston should know that there are other ways for blood to reach the brain.
A)An r = 0.89 is not a very large r-value.
B)Professor Johnston is drawing a causal conclusion from correlational findings.
C)Not everyone who wears a necktie wears it very tight.
D)Professor Johnston should know that there are other ways for blood to reach the brain.
Unlock Deck
Unlock for access to all 52 flashcards in this deck.
Unlock Deck
k this deck
12
In a correlational analysis,N stands for the
A)total number of pairs of scores.
B)total number of X scores plus the total number of Y scores.
C)total number of X scores times the total number of Y scores.
D)total number of pairs of scores minus 2.
A)total number of pairs of scores.
B)total number of X scores plus the total number of Y scores.
C)total number of X scores times the total number of Y scores.
D)total number of pairs of scores minus 2.
Unlock Deck
Unlock for access to all 52 flashcards in this deck.
Unlock Deck
k this deck
13
What type of relationship does the following regression line represent?
A)A positive relationship
B)A negative relationship
C)A curvilinear relationship
D)No relationship
A)A positive relationship
B)A negative relationship
C)A curvilinear relationship
D)No relationship
Unlock Deck
Unlock for access to all 52 flashcards in this deck.
Unlock Deck
k this deck
14
"The self-confidence of a group of students is positively correlated with their chances of getting through the course." What does this statement mean?
A)The students will pass the course if they can be made to be self-confident.
B)The chances of passing the course tend to increase as the self-confidence scores of the students increase.
C)The chances of passing the course tend to decrease as the self-confidence scores of the students increase.
D)Passing the course will make the students self-confident.
Unlock Deck
Unlock for access to all 52 flashcards in this deck.
Unlock Deck
k this deck
15
What type of relationship does the following regression line represent?
A)A positive relationship
B)A negative relationship
C)A curvilinear relationship
D)No relationship
A)A positive relationship
B)A negative relationship
C)A curvilinear relationship
D)No relationship
Unlock Deck
Unlock for access to all 52 flashcards in this deck.
Unlock Deck
k this deck
16
If there is a relationship between "income" and "happiness," then as the amount of income increases,the amount of happiness
A)also increases.
B)decreases.
C)stays the same.
D)changes in some consistent manner.
A)also increases.
B)decreases.
C)stays the same.
D)changes in some consistent manner.
Unlock Deck
Unlock for access to all 52 flashcards in this deck.
Unlock Deck
k this deck
17
To know whether there is a relationship between two variables,you draw a line around the outer edges of a scatterplot.If there is a negative relationship,
A)the scatterplot is simultaneously elliptical and circular.
B)the scatterplot is elliptical and is slanted upward (left to right).
C)the scatterplot is elliptical and is slanted downward (left to right).
D)the scatterplot is either circular or elliptical,and the ellipse is parallel to the X axis.
A)the scatterplot is simultaneously elliptical and circular.
B)the scatterplot is elliptical and is slanted upward (left to right).
C)the scatterplot is elliptical and is slanted downward (left to right).
D)the scatterplot is either circular or elliptical,and the ellipse is parallel to the X axis.
Unlock Deck
Unlock for access to all 52 flashcards in this deck.
Unlock Deck
k this deck
18
In a linear relationship,as the X scores increase,the Y scores change
A)in only one direction.
B)only in the negative direction.
C)only in the positive direction.
D)in the positive and then in the negative direction.
A)in only one direction.
B)only in the negative direction.
C)only in the positive direction.
D)in the positive and then in the negative direction.
Unlock Deck
Unlock for access to all 52 flashcards in this deck.
Unlock Deck
k this deck
19
If you see the notation ,what should you do?
A)First multiply each X by its partner Y,then sum the results.
B)First sum the Xs,then sum the Ys,then multiply the results.
C)First sum the Xs,then multiply the result by each Y.
D)First sum the Ys,then multiply the result by each X.
,what should you do?A)First multiply each X by its partner Y,then sum the results.
B)First sum the Xs,then sum the Ys,then multiply the results.
C)First sum the Xs,then multiply the result by each Y.
D)First sum the Ys,then multiply the result by each X.
Unlock Deck
Unlock for access to all 52 flashcards in this deck.
Unlock Deck
k this deck
20
"The more you save,the less you spend" describes
A)a positive linear correlation.
B)a negative linear correlation.
C)no correlation.
D)a nonlinear correlation.
A)a positive linear correlation.
B)a negative linear correlation.
C)no correlation.
D)a nonlinear correlation.
Unlock Deck
Unlock for access to all 52 flashcards in this deck.
Unlock Deck
k this deck
21
In general,a zero correlation means that
A)as the values of one variable increase,there is no tendency for the values of the other variable to change in any consistent,predictable fashion.
B)as the values of one variable increase,there is a tendency for the values of the other variable also to increase.
C)as the values of one variable increase,there is a tendency for the values of the other variable to decrease.
D)as the values of one variable decrease,there is a tendency for the values of the other variable also to decrease.
Unlock Deck
Unlock for access to all 52 flashcards in this deck.
Unlock Deck
k this deck
22
What kind of relationship is depicted in the following graph?
A)A positive linear correlation
B)A negative linear correlation
C)No correlation
D)A nonlinear correlation
A)A positive linear correlation
B)A negative linear correlation
C)No correlation
D)A nonlinear correlation
Unlock Deck
Unlock for access to all 52 flashcards in this deck.
Unlock Deck
k this deck
23
Which relationship is stronger,r = +0.62 or r = -0.62?
A)An r = +0.62 represents a stronger relationship than r = -0.62.
B)An r = -0.62 represents a stronger relationship than r = +0.62.
C)There is no difference in the strength of the two relationships.
D)Without seeing a scatterplot of the data,there is no way to determine which is stronger.
A)An r = +0.62 represents a stronger relationship than r = -0.62.
B)An r = -0.62 represents a stronger relationship than r = +0.62.
C)There is no difference in the strength of the two relationships.
D)Without seeing a scatterplot of the data,there is no way to determine which is stronger.
Unlock Deck
Unlock for access to all 52 flashcards in this deck.
Unlock Deck
k this deck
24
What type of relationship does the following regression line represent?
A)A positive relationship
B)A negative relationship
C)A curvilinear relationship
D)No relationship
A)A positive relationship
B)A negative relationship
C)A curvilinear relationship
D)No relationship
Unlock Deck
Unlock for access to all 52 flashcards in this deck.
Unlock Deck
k this deck
25
What kind of relationship is depicted in the following graph?
A)A positive linear correlation
B)A negative linear correlation
C)No correlation
D)A nonlinear correlation
A)A positive linear correlation
B)A negative linear correlation
C)No correlation
D)A nonlinear correlation
Unlock Deck
Unlock for access to all 52 flashcards in this deck.
Unlock Deck
k this deck
26
A "weak" relationship between two variables is represented by
A)a small spread of Y scores at each X score.
B)a large spread of Y scores at each X score.
C)only one value of Y at each X score.
D)an equal spread of Y scores at each X score.
A)a small spread of Y scores at each X score.
B)a large spread of Y scores at each X score.
C)only one value of Y at each X score.
D)an equal spread of Y scores at each X score.
Unlock Deck
Unlock for access to all 52 flashcards in this deck.
Unlock Deck
k this deck
27
Which of the following r-values indicates the weakest relationship between two variables?
A)-0.45
B)-0.30
C)-0.03
D)-0.45.
A)-0.45
B)-0.30
C)-0.03
D)-0.45.
Unlock Deck
Unlock for access to all 52 flashcards in this deck.
Unlock Deck
k this deck
28
In a nonlinear or curvilinear relationship,as the X scores change,the Y scores
A)tend to increase.
B)change consistently,but in more than one direction.
C)tend to be the same as the X scores.
D)do not change in a consistent fashion.
A)tend to increase.
B)change consistently,but in more than one direction.
C)tend to be the same as the X scores.
D)do not change in a consistent fashion.
Unlock Deck
Unlock for access to all 52 flashcards in this deck.
Unlock Deck
k this deck
29
Professor Miller has found that the correlation between a person's "need for affiliation" (found by taking a test to determine the need to be with others)and the number of hours spent watching television is -0.69.He should conclude that
A)as we observe people with higher and higher need for affiliation,we see a tendency for those people to spend less and less time watching television.
B)there is not much of a relationship between the two variables because the r is negative.
C)as we observe people with higher and higher need for affiliation,we see a tendency for those people to spend more and more time watching television.
D)the people who watch more television tend to have more need to be around others.
Unlock Deck
Unlock for access to all 52 flashcards in this deck.
Unlock Deck
k this deck
30
What statistic should be used to find out whether there is a relationship between hours spent participating in sports and GPA?
A)The Pearson correlation coefficient
B)The Spearman rank-order correlation coefficient
C)The point-biserial correlation coefficient
D)The nonlinear correlation coefficient
A)The Pearson correlation coefficient
B)The Spearman rank-order correlation coefficient
C)The point-biserial correlation coefficient
D)The nonlinear correlation coefficient
Unlock Deck
Unlock for access to all 52 flashcards in this deck.
Unlock Deck
k this deck
31
Calculate the appropriate correlation coefficient for the following data.
A)-0.07
B)+0.95
C)+0.49
D)+0.23
A)-0.07
B)+0.95
C)+0.49
D)+0.23
Unlock Deck
Unlock for access to all 52 flashcards in this deck.
Unlock Deck
k this deck
32
What kind of relationship is depicted in the following graph?
A)A positive linear correlation
B)A negative linear correlation
C)No correlation
D)A nonlinear correlation
A)A positive linear correlation
B)A negative linear correlation
C)No correlation
D)A nonlinear correlation
Unlock Deck
Unlock for access to all 52 flashcards in this deck.
Unlock Deck
k this deck
33
What statistic should be used to find out whether there is a relationship between years of education and annual income?
A)The Pearson correlation coefficient
B)The Spearman rank-order correlation coefficient
C)The point-biserial correlation coefficient
D)The nonlinear correlation coefficient
A)The Pearson correlation coefficient
B)The Spearman rank-order correlation coefficient
C)The point-biserial correlation coefficient
D)The nonlinear correlation coefficient
Unlock Deck
Unlock for access to all 52 flashcards in this deck.
Unlock Deck
k this deck
34
What kind of relationship is depicted in the following graph?
A)A positive linear correlation
B)A negative linear correlation
C)No correlation
D)A nonlinear correlation
A)A positive linear correlation
B)A negative linear correlation
C)No correlation
D)A nonlinear correlation
Unlock Deck
Unlock for access to all 52 flashcards in this deck.
Unlock Deck
k this deck
35
Which of the following r-values indicates the strongest relationship between two variables?
A)+0.65
B)-0.89
C)+0.10
D)-0.10
A)+0.65
B)-0.89
C)+0.10
D)-0.10
Unlock Deck
Unlock for access to all 52 flashcards in this deck.
Unlock Deck
k this deck
36
The strength of a relationship is indicated by the extent to which _____ paired with one and only one individual value of the _____ variable.
A)many values of the Y variable are;X
B)many values of the X variable are;Y
C)the entire range of the Y variable is;X
D)one value of the Y variable is;X
A)many values of the Y variable are;X
B)many values of the X variable are;Y
C)the entire range of the Y variable is;X
D)one value of the Y variable is;X
Unlock Deck
Unlock for access to all 52 flashcards in this deck.
Unlock Deck
k this deck
37
Which of the following studies represents the weakest relationship?
A)Study A
B)Study B
C)Study C
D)Cannot determine
A)Study A
B)Study B
C)Study C
D)Cannot determine
Unlock Deck
Unlock for access to all 52 flashcards in this deck.
Unlock Deck
k this deck
38
Which correlation coefficient should we use if we want to find out whether a relationship exists between two variables that are both interval or ratio variables?
A)The Pearson correlation coefficient
B)The Spearman rank-order correlation coefficient
C)The point-biserial correlation coefficient
D)The nonlinear correlation coefficient
A)The Pearson correlation coefficient
B)The Spearman rank-order correlation coefficient
C)The point-biserial correlation coefficient
D)The nonlinear correlation coefficient
Unlock Deck
Unlock for access to all 52 flashcards in this deck.
Unlock Deck
k this deck
39
Professor Helgin has found that the correlation between the length of a person's index finger and the person's IQ is -0.11.He should conclude that
A)as the length of the index finger goes up,there is a fairly strong tendency for a person to have a lower IQ.
B)there is no relationship between the two variables because the r is negative.
C)we can be confident in predicting that people with high IQs will tend to have long index fingers.
D)there is a very weak relationship between the length of the index finger and IQ because r is nearly 0.
Unlock Deck
Unlock for access to all 52 flashcards in this deck.
Unlock Deck
k this deck
40
When the correlation coefficient representing the relationship between X and Y is intermediate,then all of the following are true except
A)there is not a perfectly consistent association.
B)there are different Y scores associated with a single X score.
C)prediction of Y from a known X score has some error.
D)all data points fall on the regression line.
A)there is not a perfectly consistent association.
B)there are different Y scores associated with a single X score.
C)prediction of Y from a known X score has some error.
D)all data points fall on the regression line.
Unlock Deck
Unlock for access to all 52 flashcards in this deck.
Unlock Deck
k this deck
41
Calculate the appropriate correlation coefficient for the following data.
A)-0.92
B)-0.37
C)-0.06
D)+0.75
A)-0.92
B)-0.37
C)-0.06
D)+0.75
Unlock Deck
Unlock for access to all 52 flashcards in this deck.
Unlock Deck
k this deck
42
Calculate the appropriate correlation coefficient for the following data.
A)-0.52
B)+0.52
C)+0.83
D)+0.94
A)-0.52
B)+0.52
C)+0.83
D)+0.94
Unlock Deck
Unlock for access to all 52 flashcards in this deck.
Unlock Deck
k this deck
43
Which correlation coefficient should we use if we want to find out whether a relationship exists between scores from one interval variable and one ordinal variable?
A)The Pearson correlation coefficient
B)The Spearman rank-order correlation coefficient
C)The point-biserial correlation coefficient
D)The nonlinear correlation coefficient
A)The Pearson correlation coefficient
B)The Spearman rank-order correlation coefficient
C)The point-biserial correlation coefficient
D)The nonlinear correlation coefficient
Unlock Deck
Unlock for access to all 52 flashcards in this deck.
Unlock Deck
k this deck
44
In a study about the relationship between their age and women's attitudes about marriage,you survey over 500 undergraduate women and calculate a Pearson correlation coefficient.What mistake have you made?
A)You have collected too much data.
B)There is no way a woman's attitude about marriage can affect her age.
C)You only surveyed young women in college causing a restriction of range.
D)You have used the wrong correlation coefficient the type of data.
A)You have collected too much data.
B)There is no way a woman's attitude about marriage can affect her age.
C)You only surveyed young women in college causing a restriction of range.
D)You have used the wrong correlation coefficient the type of data.
Unlock Deck
Unlock for access to all 52 flashcards in this deck.
Unlock Deck
k this deck
45
If we compute a correlation on data that come only from the middle of the X distribution (restricted range)rather than from the entire range,the correlation is likely to be _____ the correlation from the entire range.
A)smaller than
B)the same as
C)a little larger than
D)a lot larger than
A)smaller than
B)the same as
C)a little larger than
D)a lot larger than
Unlock Deck
Unlock for access to all 52 flashcards in this deck.
Unlock Deck
k this deck
46
Calculate the appropriate correlation coefficient for the following data,assuming X is an interval variable and Y is a ratio variable.
A)-0.65
B)+0.09
C)+0.40
D)+0.59
A)-0.65
B)+0.09
C)+0.40
D)+0.59
Unlock Deck
Unlock for access to all 52 flashcards in this deck.
Unlock Deck
k this deck
47
Suppose a researcher has trained two observers to rank participants according to their level of frustration when trying to solve a puzzle.What statistic should be used to determine the extent to which the two observers agree in their rankings of frustration?
A)The Pearson correlation coefficient
B)The Spearman rank-order correlation coefficient
C)The point-biserial correlation coefficient
D)The nonlinear correlation coefficient
A)The Pearson correlation coefficient
B)The Spearman rank-order correlation coefficient
C)The point-biserial correlation coefficient
D)The nonlinear correlation coefficient
Unlock Deck
Unlock for access to all 52 flashcards in this deck.
Unlock Deck
k this deck
48
What statistic should be used to find out whether there is a relationship between high school class rank and first-semester college GPA rank?
A)The Pearson correlation coefficient
B)The Spearman rank-order correlation coefficient
C)The point-biserial correlation coefficient
D)The nonlinear correlation coefficient
A)The Pearson correlation coefficient
B)The Spearman rank-order correlation coefficient
C)The point-biserial correlation coefficient
D)The nonlinear correlation coefficient
Unlock Deck
Unlock for access to all 52 flashcards in this deck.
Unlock Deck
k this deck
49
Which correlation coefficient should we use if we want to find out whether a relationship exists between two variables that represent pairs of ordinal scores?
A)The Pearson correlation coefficient
B)The Spearman rank-order correlation coefficient
C)The point-biserial correlation coefficient
D)The nonlinear correlation coefficient
A)The Pearson correlation coefficient
B)The Spearman rank-order correlation coefficient
C)The point-biserial correlation coefficient
D)The nonlinear correlation coefficient
Unlock Deck
Unlock for access to all 52 flashcards in this deck.
Unlock Deck
k this deck
50
Calculate the appropriate correlation coefficient for the following data.
A)-0.97
B)-0.39
C)+0.11
D)+0.57
A)-0.97
B)-0.39
C)+0.11
D)+0.57
Unlock Deck
Unlock for access to all 52 flashcards in this deck.
Unlock Deck
k this deck
51
Calculate the appropriate correlation coefficient for the following data
A)-0.68
B)+0.72
C)-0.41
D)-0.93
A)-0.68
B)+0.72
C)-0.41
D)-0.93
Unlock Deck
Unlock for access to all 52 flashcards in this deck.
Unlock Deck
k this deck
52
As a part of her Master's Degree thesis in Geology,Candice needs to calculate a correlation coefficient between the amount of rainfall (measured in inches)and the height of the ground water table (measured in inches)in various parts of the continental U.S.Which formula should she use for this calculation?
A)
B)
C)
D)
A)
B)
C)
D)
Unlock Deck
Unlock for access to all 52 flashcards in this deck.
Unlock Deck
k this deck
Unlock Deck
Unlock for access to all 52 flashcards in this deck.


