Exam 7: The Correlation Coefficient
Exam 1: Introduction to Statistics43 Questions
Exam 2: Statistics and the Research Process75 Questions
Exam 3: Frequency Distributions and Percentiles48 Questions
Exam 4: Measures of Central Tendency;the Mean, median, and Mode62 Questions
Exam 5: Measures of Variability: Range, variance, and Standard Deviation59 Questions
Exam 6: Z-Scores and the Normal Curve60 Questions
Exam 7: The Correlation Coefficient52 Questions
Exam 8: Linear Regression52 Questions
Exam 9: Using Probability to Make Decisions About Data56 Questions
Exam 10: Introduction to Hypothesis Testing56 Questions
Exam 11: Performing the One-Sample T-Test and Testing Correlation Coefficients57 Questions
Exam 12: The Two-Sample T-Test65 Questions
Exam 13: The One-Way Analysis of Variance61 Questions
Exam 14: The Two-Way Analysis of Variance56 Questions
Exam 15: Chi Square and Other Nonparametric Procedures49 Questions
Select questions type
In a nonlinear or curvilinear relationship,as the X scores change,the Y scores
Free
(Multiple Choice)
4.8/5  (36)
(36)
Correct Answer: Verified
B
Which of the following r-values indicates the weakest relationship between two variables?
Free
(Multiple Choice)
4.9/5 (37)
Correct Answer:Verified
C
The best-fitting line through a scatterplot is known as the
Free
(Multiple Choice)
4.9/5 (33)
Correct Answer:Verified
D
Using a correlational design,a researcher found a relationship between the healthiness of one's heart and the amount of fish oil in one's diet.The researcher should conclude that
(Multiple Choice)
4.8/5 (37)
Calculate the appropriate correlation coefficient for the following data,assuming X is an interval variable and Y is a ratio variable. 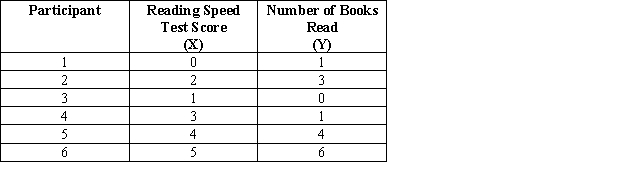
(Multiple Choice)
4.7/5 (36)
The strength of a relationship is indicated by the extent to which _____ paired with one and only one individual value of the _____ variable.
(Multiple Choice)
4.9/5 (29)
Which correlation coefficient should we use if we want to find out whether a relationship exists between two variables that represent pairs of ordinal scores?
(Multiple Choice)
4.9/5 (36)
What kind of relationship is depicted in the following graph? 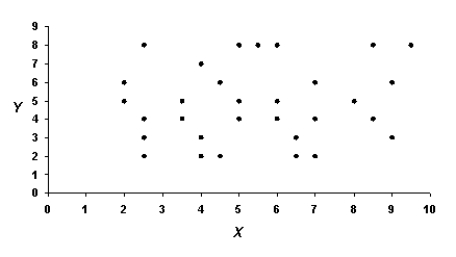
(Multiple Choice)
4.8/5 (26)
Which correlation coefficient should we use if we want to find out whether a relationship exists between scores from one interval variable and one ordinal variable?
(Multiple Choice)
4.8/5 (42)
In general,a positive correlation means that as the values of one variable _____,there is a tendency for the values of the other variable to _____.
(Multiple Choice)
4.9/5 (39)
Calculate the appropriate correlation coefficient for the following data. 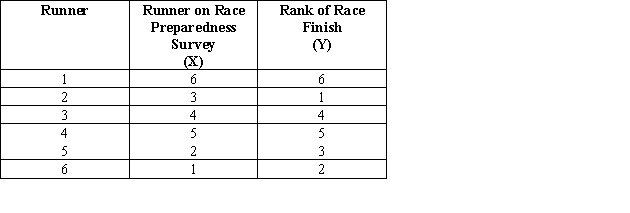
(Multiple Choice)
4.7/5 (38)
A "weak" relationship between two variables is represented by
(Multiple Choice)
4.7/5 (34)
What type of relationship does the following regression line represent? 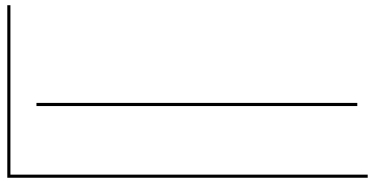
(Multiple Choice)
4.8/5 (41)
If there is a relationship between "income" and "happiness," then as the amount of income increases,the amount of happiness
(Multiple Choice)
4.8/5 (27)
To know whether there is a relationship between two variables,you draw a line around the outer edges of a scatterplot.If there is a negative relationship,
(Multiple Choice)
4.9/5 (30)
When plotting correlational data,the appropriate graph to use is the
(Multiple Choice)
4.8/5 (30)
In a linear relationship,as the X scores increase,the Y scores change
(Multiple Choice)
4.8/5 (34)
Filters
- Essay(0)
- Multiple Choice(0)
- Short Answer(0)
- True False(0)
- Matching(0)