Deck 17: Statistics for Quality: Control and Capability
Full screen (f)
Question
Question
When we examine  and s charts,what is the best strategy to use?
A)Start with the chart and only examine the s chart if a point is out of control.
B)Start with the s chart and ignore the chart unless the s chart is in control or until any special causes for lack of control in the s chart have been found and removed.
C)Examine both simultaneously and only declare a point out of control if it is outside the control limits on both charts.
D)Examine both simultaneously and only declare a point out of control if it is outside the control limits of the chart but within the control limits of the s chart.
and s charts,what is the best strategy to use?A)Start with the
chart and only examine the s chart if a point is out of control.B)Start with the s chart and ignore the
chart unless the s chart is in control or until any special causes for lack of control in the s chart have been found and removed.C)Examine both simultaneously and only declare a point out of control if it is outside the control limits on both charts.
D)Examine both simultaneously and only declare a point out of control if it is outside the control limits of the
chart but within the control limits of the s chart. Question
Piston rings for an automotive engine are produced by a forging process.We wish to monitor the inside diameter of the rings manufactured by this process using an  and an s control chart.Samples of size 4 are to be taken at regular intervals,and the sample means and standard deviations are computed and plotted on the charts in time order.The target values for the inside diameter are a mean of = 75 millimeters and a standard deviation of = 0.02 millimeters.The control chart constants are (partially)reproduced below.
  What is the lower control limit for the s chart?
A)-0.04 millimeters
B)0 millimeters
C)0.018 millimeters
D)0.02 millimeters
and an s control chart.Samples of size 4 are to be taken at regular intervals,and the sample means and standard deviations are computed and plotted on the charts in time order.The target values for the inside diameter are a mean of = 75 millimeters and a standard deviation of = 0.02 millimeters.The control chart constants are (partially)reproduced below. What is the lower control limit for the s chart?A)-0.04 millimeters
B)0 millimeters
C)0.018 millimeters
D)0.02 millimeters
Question
Parts manufactured by an injection molding process are subjected to a compressive strength test.We wish to monitor the compressive strength of the parts manufactured by this process using both  and s charts.Samples of size 9 are to be taken at regular intervals,and their mean compressive strength (in psi = pounds per square inch)and standard deviation are plotted on the charts in time order.The target values for the compressive strengths are a mean of = 80 psi and a standard deviation of = 3 psi.The control chart constants are (partially)reproduced below.
  What is the upper control limit for the s chart?
A)0.7 psi
B)2.9 psi
C)5.1 psi
D)12 psi
and s charts.Samples of size 9 are to be taken at regular intervals,and their mean compressive strength (in psi = pounds per square inch)and standard deviation are plotted on the charts in time order.The target values for the compressive strengths are a mean of = 80 psi and a standard deviation of = 3 psi.The control chart constants are (partially)reproduced below. What is the upper control limit for the s chart?A)0.7 psi
B)2.9 psi
C)5.1 psi
D)12 psi
Question
Piston rings for an automotive engine are produced by a forging process.We wish to monitor the inside diameter of the rings manufactured by this process using an  and an s control chart.Samples of size 4 are to be taken at regular intervals,and the sample means and standard deviations are computed and plotted on the charts in time order.The target values for the inside diameter are a mean of = 75 millimeters and a standard deviation of = 0.02 millimeters.The control chart constants are (partially)reproduced below.
  What is the upper control limit for the
Chart?
A)0.03 millimeters
B)74.97 millimeters
C)75 millimeters
D)75.03 millimeters
and an s control chart.Samples of size 4 are to be taken at regular intervals,and the sample means and standard deviations are computed and plotted on the charts in time order.The target values for the inside diameter are a mean of = 75 millimeters and a standard deviation of = 0.02 millimeters.The control chart constants are (partially)reproduced below. What is the upper control limit for the Chart?
A)0.03 millimeters
B)74.97 millimeters
C)75 millimeters
D)75.03 millimeters
Question
Parts manufactured by an injection molding process are subjected to a compressive strength test.We wish to monitor the compressive strength of the parts manufactured by this process using both  and s charts.Samples of size 9 are to be taken at regular intervals,and their mean compressive strength (in psi = pounds per square inch)and standard deviation are plotted on the charts in time order.The target values for the compressive strengths are a mean of = 80 psi and a standard deviation of = 3 psi.The control chart constants are (partially)reproduced below.
  What is the center line for the s chart?
A)0.7 psi
B)2.9 psi
C)3 psi
D)5.1 psi
and s charts.Samples of size 9 are to be taken at regular intervals,and their mean compressive strength (in psi = pounds per square inch)and standard deviation are plotted on the charts in time order.The target values for the compressive strengths are a mean of = 80 psi and a standard deviation of = 3 psi.The control chart constants are (partially)reproduced below. What is the center line for the s chart?A)0.7 psi
B)2.9 psi
C)3 psi
D)5.1 psi
Question
Piston rings for an automotive engine are produced by a forging process.We wish to monitor the inside diameter of the rings manufactured by this process using an  and an s control chart.Samples of size 4 are to be taken at regular intervals,and the sample means and standard deviations are computed and plotted on the charts in time order.The target values for the inside diameter are a mean of = 75 millimeters and a standard deviation of = 0.02 millimeters.The control chart constants are (partially)reproduced below.
  What is the center line for the s chart?
A)0.018 millimeters
B)0.02 millimeters
C)0.04 millimeters
D)75 millimeters
and an s control chart.Samples of size 4 are to be taken at regular intervals,and the sample means and standard deviations are computed and plotted on the charts in time order.The target values for the inside diameter are a mean of = 75 millimeters and a standard deviation of = 0.02 millimeters.The control chart constants are (partially)reproduced below. What is the center line for the s chart?A)0.018 millimeters
B)0.02 millimeters
C)0.04 millimeters
D)75 millimeters
Question
What is the name of a chart in which the standard deviations of samples taken at regular intervals are plotted against the time order in which the samples were taken?
A)An s chart
B)An
Chart
C)An R chart
D)A p chart
A)An s chart
B)An
Chart
C)An R chart
D)A p chart
Question
A statistic Q is to be used to monitor a process over time,using a control chart for that statistic.When the process is running in a state of control,it is known that the statistic Q has mean  and standard deviation
.Which of the following is NOT a feature of the appropriate three-sigma control chart for Q?
A)Values of Q,obtained from regular samples from the process,will be plotted on the control chart against the time order of the samples.
B)A signal will be given if the value of the statistic Q falls between the upper control limit (UCL)and the lower control limit (LCL).
C)The center line for the control chart will be set at
.
D)The lower control limit (LCL)will be set at
- 3

.
E)The upper control limit (UCL)will be set at
+ 3

.
and standard deviation .Which of the following is NOT a feature of the appropriate three-sigma control chart for Q?
A)Values of Q,obtained from regular samples from the process,will be plotted on the control chart against the time order of the samples.
B)A signal will be given if the value of the statistic Q falls between the upper control limit (UCL)and the lower control limit (LCL).
C)The center line for the control chart will be set at
.
D)The lower control limit (LCL)will be set at
- 3
.
E)The upper control limit (UCL)will be set at
+ 3
.
Question
Question
Question
Question
Question
Question
Question
Question
Parts manufactured by an injection molding process are subjected to a compressive strength test.We wish to monitor the compressive strength of the parts manufactured by this process using both  and s charts.Samples of size 9 are to be taken at regular intervals,and their mean compressive strength (in psi = pounds per square inch)and standard deviation are plotted on the charts in time order.The target values for the compressive strengths are a mean of = 80 psi and a standard deviation of = 3 psi.The control chart constants are (partially)reproduced below.
  Suppose at the time of sample 10,we observe a mean of 85 psi.What should we do?
A)Declare the process out of control.
B)Continue sampling-the process is still in control.
C)Continue sampling,but increase the sample size to 16.The process is barely in control.
D)Continue sampling,but reduce the sample size to 4.The process is well in control.
and s charts.Samples of size 9 are to be taken at regular intervals,and their mean compressive strength (in psi = pounds per square inch)and standard deviation are plotted on the charts in time order.The target values for the compressive strengths are a mean of = 80 psi and a standard deviation of = 3 psi.The control chart constants are (partially)reproduced below. Suppose at the time of sample 10,we observe a mean of 85 psi.What should we do?A)Declare the process out of control.
B)Continue sampling-the process is still in control.
C)Continue sampling,but increase the sample size to 16.The process is barely in control.
D)Continue sampling,but reduce the sample size to 4.The process is well in control.
Question
Piston rings for an automotive engine are produced by a forging process.We wish to monitor the inside diameter of the rings manufactured by this process using an  and an s control chart.Samples of size 4 are to be taken at regular intervals,and the sample means and standard deviations are computed and plotted on the charts in time order.The target values for the inside diameter are a mean of = 75 millimeters and a standard deviation of = 0.02 millimeters.The control chart constants are (partially)reproduced below.
  What is the center line for the
Chart?
A)0.03 millimeters
B)74.97 millimeters
C)75 millimeters
D)75.03 millimeters
and an s control chart.Samples of size 4 are to be taken at regular intervals,and the sample means and standard deviations are computed and plotted on the charts in time order.The target values for the inside diameter are a mean of = 75 millimeters and a standard deviation of = 0.02 millimeters.The control chart constants are (partially)reproduced below. What is the center line for the Chart?
A)0.03 millimeters
B)74.97 millimeters
C)75 millimeters
D)75.03 millimeters
Question
Parts manufactured by an injection molding process are subjected to a compressive strength test.We wish to monitor the compressive strength of the parts manufactured by this process using both  and s charts.Samples of size 9 are to be taken at regular intervals,and their mean compressive strength (in psi = pounds per square inch)and standard deviation are plotted on the charts in time order.The target values for the compressive strengths are a mean of = 80 psi and a standard deviation of = 3 psi.The control chart constants are (partially)reproduced below.
  What is the lower control limit for the
Chart?
A)71 psi
B)77 psi
C)83 psi
D)89 psi
and s charts.Samples of size 9 are to be taken at regular intervals,and their mean compressive strength (in psi = pounds per square inch)and standard deviation are plotted on the charts in time order.The target values for the compressive strengths are a mean of = 80 psi and a standard deviation of = 3 psi.The control chart constants are (partially)reproduced below. What is the lower control limit for the Chart?
A)71 psi
B)77 psi
C)83 psi
D)89 psi
Question
Parts manufactured by an injection molding process are subjected to a compressive strength test.We wish to monitor the compressive strength of the parts manufactured by this process using both  and s charts.Samples of size 9 are to be taken at regular intervals,and their mean compressive strength (in psi = pounds per square inch)and standard deviation are plotted on the charts in time order.The target values for the compressive strengths are a mean of = 80 psi and a standard deviation of = 3 psi.The control chart constants are (partially)reproduced below.
  What is the center line for the
Chart?
A)3 psi
B)77 psi
C)80 psi
D)None of the above
and s charts.Samples of size 9 are to be taken at regular intervals,and their mean compressive strength (in psi = pounds per square inch)and standard deviation are plotted on the charts in time order.The target values for the compressive strengths are a mean of = 80 psi and a standard deviation of = 3 psi.The control chart constants are (partially)reproduced below. What is the center line for the Chart?
A)3 psi
B)77 psi
C)80 psi
D)None of the above
Question
Question
The data below represent the means from 15 sample control charts for the amount of time in minutes it takes students to complete a quiz in a basic statistics course.The same quiz was given to 15 different sections of a basic statistics course.Five students were sampled from each class and each mean is shown below.  What is the value of the lower control limit?
A)16.71
B)2.83
C)9.77
D)None of the above
What is the value of the lower control limit?A)16.71
B)2.83
C)9.77
D)None of the above
Question
Question
The data below represent the means from 15 sample control charts for the amount of time in minutes it takes students to complete a quiz in a basic statistics course.The same quiz was given to 15 different sections of a basic statistics course.Five students were sampled from each class and each mean is shown below.  What is the approximate value of the center line for the correct control chart?
A)16.71
B)2.83
C)9.77
D)None of the above
What is the approximate value of the center line for the correct control chart?A)16.71
B)2.83
C)9.77
D)None of the above
Question
Question
Question
Question
Question
The sampling distribution of  under the process-monitoring condition is __________.
A)Normal
B)binomial
C)T
D)any distribution
under the process-monitoring condition is __________.A)Normal
B)binomial
C)T
D)any distribution
Question
Question
Question
Question
Question
Question
The data below represent the means from 15 sample control charts for the amount of time in minutes it takes students to complete a quiz in a basic statistics course.The same quiz was given to 15 different sections of a basic statistics course.Five students were sampled from each class and each mean is shown below. 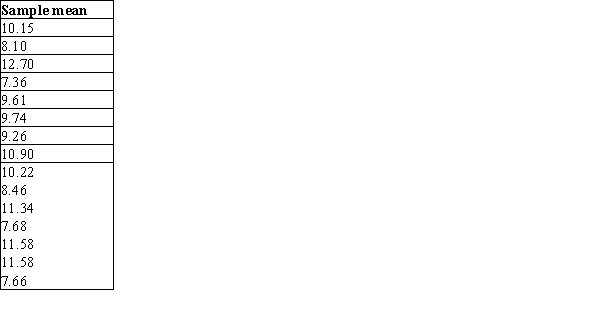 Which graph is the control chart for
  ?
?
A)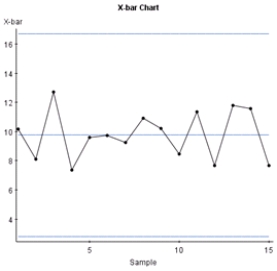
B)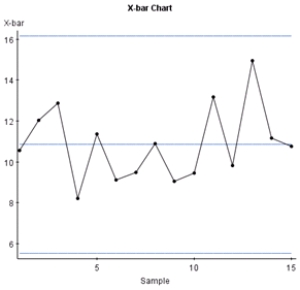
C)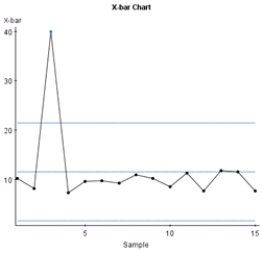
D)None of the above
Which graph is the control chart for ?A)
B)
C)
D)None of the above
Question
Question
Question
Which of the control charts is out of control?
A)
B)
C)All of the above
D)None of the above
A)
B)
C)All of the above
D)None of the above
Question
The data below represent the means from 15 sample control charts for the amount of time in minutes it takes students to complete a quiz in a basic statistics course.The same quiz was given to 15 different sections of a basic statistics course.Five students were sampled from each class and each mean is shown below.  What is the value of the upper control limit?
A)16.71
B)2.83
C)9.77
D)None of the above
What is the value of the upper control limit?A)16.71
B)2.83
C)9.77
D)None of the above
Question
Which of the control charts is in control?
A)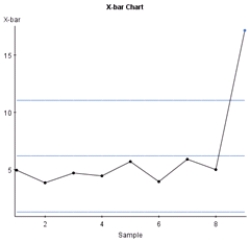
B)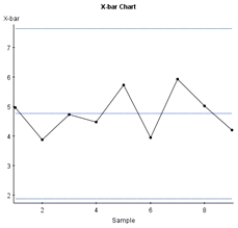
C)All of the above
D)None of the above
A)
B)
C)All of the above
D)None of the above
Question
When a process variable is Normally distributed,there are two important process characteristics that need to be monitored: the mean,,and the standard deviation,.Which control chart would be used to monitor the process spread?
A)The R chart
B)The chart
chart
C)The s chart
D)Any of the above charts would be appropriate to monitor process spread.
E)Only A and C monitor process spread.
A)The R chart
B)The
chartC)The s chart
D)Any of the above charts would be appropriate to monitor process spread.
E)Only A and C monitor process spread.
Question
Parts manufactured by an injection molding process are subjected to a compressive strength test.We monitor the compressive strength of the parts manufactured by this process using an  and an s control chart.Samples of size 9 are taken at regular intervals,and their mean compressive strength (in psi = pounds per square inch)and standard deviation are plotted on the charts in time order.The overall mean of the sample means is
  = 81.2 psi,and the mean of the sample standard deviations is
  = 2.9 psi.The control chart constants are (partially)reproduced below.
  What is the lower control limit for the
  chart?
A)0 psi
B)18.8 psi
C)78.2 psi
D)78.7 psi
and an s control chart.Samples of size 9 are taken at regular intervals,and their mean compressive strength (in psi = pounds per square inch)and standard deviation are plotted on the charts in time order.The overall mean of the sample means is = 81.2 psi,and the mean of the sample standard deviations is = 2.9 psi.The control chart constants are (partially)reproduced below. What is the lower control limit for the chart?A)0 psi
B)18.8 psi
C)78.2 psi
D)78.7 psi
Question
Question
Suppose we use a "run of eight" rule;that is,we declare the process out of control if eight consecutive points are all above the center line of the  chart or if eight consecutive points are all below the center line of the
Chart.If the process is in statistical control,what is the (approximate)probability that we declare the process out of control using this rule?
A)0.001
B)0.004
C)0.008
D)0.05
chart or if eight consecutive points are all below the center line of the Chart.If the process is in statistical control,what is the (approximate)probability that we declare the process out of control using this rule?
A)0.001
B)0.004
C)0.008
D)0.05
Question
Question
Piston rings for an automotive engine are produced by a forging process.We monitor the inside diameter of the rings manufactured by this process using an  and an s control chart.Samples of size 4 are taken at regular intervals,and the sample means and standard deviations are computed and plotted on the charts in time order.The overall mean of the sample means is 73.812 millimeters,and the mean of the sample standard deviations is 0.022 millimeters.The control chart constants are (partially)reproduced below.
  What is the value of the upper control limit for the
  chart?
A)73.834 millimeters
B)73.848 millimeters
C)73.878 millimeters
D)154.119 millimeters
and an s control chart.Samples of size 4 are taken at regular intervals,and the sample means and standard deviations are computed and plotted on the charts in time order.The overall mean of the sample means is 73.812 millimeters,and the mean of the sample standard deviations is 0.022 millimeters.The control chart constants are (partially)reproduced below. What is the value of the upper control limit for the chart?A)73.834 millimeters
B)73.848 millimeters
C)73.878 millimeters
D)154.119 millimeters
Question
Which of the following statements about the use of control charts is/are FALSE?
A)The one point outside the control limits on the chart is effective for detecting a gradual shift in the process mean.
B)To provide a quicker alarm when the process has gone out of control we can look for other patterns on the chart,such as by adding a runs rule.
C)A pattern such as nine consecutive points,either above the center line or below the center line,can be used as a signal that a process has been disturbed by a special cause.
D)When additional patterns are looked for on a control chart,the false alarm rate,when the process is in control,will increase.
E)A false alarm occurs on a control chart when a plotted point gives an out-of-control signal,but the process is operating only with common cause variability.
A)The one point outside the control limits on the
chart is effective for detecting a gradual shift in the process mean.B)To provide a quicker alarm when the process has gone out of control we can look for other patterns on the
chart,such as by adding a runs rule.C)A pattern such as nine consecutive points,either above the center line or below the center line,can be used as a signal that a process has been disturbed by a special cause.
D)When additional patterns are looked for on a control chart,the false alarm rate,when the process is in control,will increase.
E)A false alarm occurs on a control chart when a plotted point gives an out-of-control signal,but the process is operating only with common cause variability.
Question
Piston rings for an automotive engine are produced by a forging process.We monitor the inside diameter of the rings manufactured by this process using an  and an s control chart.Samples of size 4 are taken at regular intervals,and the sample means and standard deviations are computed and plotted on the charts in time order.The overall mean of the sample means is 73.812 millimeters,and the mean of the sample standard deviations is 0.022 millimeters.The control chart constants are (partially)reproduced below.
  What value would we use for the center line of the
  chart?
A)68.003 millimeters
B)73.790 millimeters
C)73.812 millimeters
D)154.119 millimeters
and an s control chart.Samples of size 4 are taken at regular intervals,and the sample means and standard deviations are computed and plotted on the charts in time order.The overall mean of the sample means is 73.812 millimeters,and the mean of the sample standard deviations is 0.022 millimeters.The control chart constants are (partially)reproduced below. What value would we use for the center line of the chart?A)68.003 millimeters
B)73.790 millimeters
C)73.812 millimeters
D)154.119 millimeters
Question
Parts manufactured by an injection molding process are subjected to a compressive strength test.We monitor the compressive strength of the parts manufactured by this process using an  and an s control chart.Samples of size 9 are taken at regular intervals,and their mean compressive strength (in psi = pounds per square inch)and standard deviation are plotted on the charts in time order.The overall mean of the sample means is
  = 81.2 psi,and the mean of the sample standard deviations is
  = 2.9 psi.The control chart constants are (partially)reproduced below.
  What is the value of the center line for the
  chart?
A)18.8 psi
B)78.7 psi
C)81.2 psi
D)138.6 psi
and an s control chart.Samples of size 9 are taken at regular intervals,and their mean compressive strength (in psi = pounds per square inch)and standard deviation are plotted on the charts in time order.The overall mean of the sample means is = 81.2 psi,and the mean of the sample standard deviations is = 2.9 psi.The control chart constants are (partially)reproduced below. What is the value of the center line for the chart?A)18.8 psi
B)78.7 psi
C)81.2 psi
D)138.6 psi
Question
Piston rings for an automotive engine are produced by a forging process.We monitor the inside diameter of the rings manufactured by this process using an  and an s control chart.Samples of size 4 are taken at regular intervals,and the sample means and standard deviations are computed and plotted on the charts in time order.The overall mean of the sample means is 73.812 millimeters,and the mean of the sample standard deviations is 0.022 millimeters.The control chart constants are (partially)reproduced below.
  The overall mean of the sample means is given as 73.812 millimeters.What symbol do we use to represent this value?
A)
B)
C)
D)

and an s control chart.Samples of size 4 are taken at regular intervals,and the sample means and standard deviations are computed and plotted on the charts in time order.The overall mean of the sample means is 73.812 millimeters,and the mean of the sample standard deviations is 0.022 millimeters.The control chart constants are (partially)reproduced below. The overall mean of the sample means is given as 73.812 millimeters.What symbol do we use to represent this value?A)
B)
C)
D)
Question
An important characteristic in the proper operation of ignition keys for automobiles is the groove width of the key.In a large manufacturing plant that produces thousands of keys,control charts have been established to monitor the process of cutting the groove.It is believed that the measurement (in inches)of the groove width is Normally distributed.Over a period of time,20 samples,each of size n = 5,were selected in order to establish 3-sigma  and s charts.From these samples the following were determined:
  = 0.15932 and
= 0.0193438.Examination of the chart and the s chart for the samples led to the conclusion that the process was in control at this time.Because this process is in a state of statistical control,we are able to predict what to expect in the finished product.What will be the natural tolerances for the grooves in the ignition keys?
A)(0.00659,0.00935)
B)(0.00488,0.01105)
C)(0.00506,0.01087)
D)(0.13337,0.18527)
E)This cannot be determined with the given information.
and s charts.From these samples the following were determined: = 0.15932 and = 0.0193438.Examination of the
chart and the s chart for the samples led to the conclusion that the process was in control at this time.Because this process is in a state of statistical control,we are able to predict what to expect in the finished product.What will be the natural tolerances for the grooves in the ignition keys?A)(0.00659,0.00935)
B)(0.00488,0.01105)
C)(0.00506,0.01087)
D)(0.13337,0.18527)
E)This cannot be determined with the given information.
Question
An important characteristic in the proper operation of ignition keys for automobiles is the groove width of the key.In a large manufacturing plant that produces thousands of keys,control charts have been established to monitor the process of cutting the groove.It is believed that the measurement (in inches)of the groove width is Normally distributed.Over a period of time,20 samples,each of size n = 5,were selected in order to establish 3-sigma  and s charts.From these samples the following were determined:
  = 0.15932 and
= 0.0193438.What is the value of the center line on the chart and on the s chart,respectively?
A)0.00797;0.001028
B)0.15932;0.019344
C)0.00797;0.000967
D)0.15932;0.000967
E)0.00797;0.019344
and s charts.From these samples the following were determined: = 0.15932 and = 0.0193438.What is the value of the center line on the
chart and on the s chart,respectively?A)0.00797;0.001028
B)0.15932;0.019344
C)0.00797;0.000967
D)0.15932;0.000967
E)0.00797;0.019344
Question
Question
Parts manufactured by an injection molding process are subjected to a compressive strength test.We monitor the compressive strength of the parts manufactured by this process using an  and an s control chart.Samples of size 9 are taken at regular intervals,and their mean compressive strength (in psi = pounds per square inch)and standard deviation are plotted on the charts in time order.The overall mean of the sample means is
  = 81.2 psi,and the mean of the sample standard deviations is
  = 2.9 psi.The control chart constants are (partially)reproduced below.
  What is the center line for the s chart?
A)2.8 psi
B)2.9 psi
C)3 psi
D)5.0 psi
and an s control chart.Samples of size 9 are taken at regular intervals,and their mean compressive strength (in psi = pounds per square inch)and standard deviation are plotted on the charts in time order.The overall mean of the sample means is = 81.2 psi,and the mean of the sample standard deviations is = 2.9 psi.The control chart constants are (partially)reproduced below. What is the center line for the s chart?A)2.8 psi
B)2.9 psi
C)3 psi
D)5.0 psi
Question
An important characteristic in the proper operation of ignition keys for automobiles is the groove width of the key.In a large manufacturing plant that produces thousands of keys,control charts have been established to monitor the process of cutting the groove.It is believed that the measurement (in inches)of the groove width is Normally distributed.Over a period of time,20 samples,each of size n = 5,were selected in order to establish 3-sigma  and s charts.From these samples the following were determined:
  = 0.15932 and
= 0.0193438.For the chart that is being set up,what are the appropriate 3-sigma lower and upper control limits, (LCL,UCL)?
A)(0.00667,0.00927)
B)(-0.02289,0.03883)
C)(0.13337,0.18527)
D)(0.00659,0.00935)
E)None of the above
and s charts.From these samples the following were determined: = 0.15932 and = 0.0193438.For the
chart that is being set up,what are the appropriate 3-sigma lower and upper control limits, (LCL,UCL)?A)(0.00667,0.00927)
B)(-0.02289,0.03883)
C)(0.13337,0.18527)
D)(0.00659,0.00935)
E)None of the above
Question
Piston rings for an automotive engine are produced by a forging process.We monitor the inside diameter of the rings manufactured by this process using an  and an s control chart.Samples of size 4 are taken at regular intervals,and the sample means and standard deviations are computed and plotted on the charts in time order.The overall mean of the sample means is 73.812 millimeters,and the mean of the sample standard deviations is 0.022 millimeters.The control chart constants are (partially)reproduced below.
 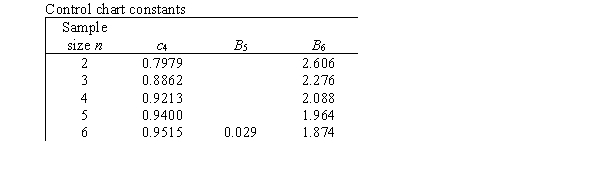 What is the value of the center line of the s chart?
A)0 millimeters
B)0.020 millimeters
C)0.022 millimeters
D)0.046 millimeters
and an s control chart.Samples of size 4 are taken at regular intervals,and the sample means and standard deviations are computed and plotted on the charts in time order.The overall mean of the sample means is 73.812 millimeters,and the mean of the sample standard deviations is 0.022 millimeters.The control chart constants are (partially)reproduced below. What is the value of the center line of the s chart?A)0 millimeters
B)0.020 millimeters
C)0.022 millimeters
D)0.046 millimeters
Question
An important characteristic in the proper operation of ignition keys for automobiles is the groove width of the key.In a large manufacturing plant that produces thousands of keys,control charts have been established to monitor the process of cutting the groove.It is believed that the measurement (in inches)of the groove width is Normally distributed.Over a period of time,20 samples,each of size n = 5,were selected in order to establish 3-sigma  and s charts.From these samples the following were determined:
  = 0.15932 and
= 0.0193438.Examination of the chart and the s chart for the samples led to the conclusion that the process was in control at this time.What,then,are the estimates of the process mean,,and process standard deviation,?
A)

= 0.00797;

= 0.000967
B)

= 0.00797;

= 0.019344
C)

= 0.15932;

= 0.020578
D)

= 0.15932;

= 0.001029
E)

= 0.00797;

= 0.001029
and s charts.From these samples the following were determined: = 0.15932 and = 0.0193438.Examination of the
chart and the s chart for the samples led to the conclusion that the process was in control at this time.What,then,are the estimates of the process mean,,and process standard deviation,?A)
= 0.00797;
= 0.000967
B)
= 0.00797;
= 0.019344
C)
= 0.15932;
= 0.020578
D)
= 0.15932;
= 0.001029
E)
= 0.00797;
= 0.001029
Question
Question
Piston rings for an automotive engine are produced by a forging process.We monitor the inside diameter of the rings manufactured by this process using an  and an s control chart.Samples of size 4 are taken at regular intervals,and the sample means and standard deviations are computed and plotted on the charts in time order.The overall mean of the sample means is 73.812 millimeters,and the mean of the sample standard deviations is 0.022 millimeters.The control chart constants are (partially)reproduced below.
  What is the lower control limit for the s chart?
A)-0.066 millimeters
B)0 millimeters
C)0.020 millimeters
D)0.022 millimeters
and an s control chart.Samples of size 4 are taken at regular intervals,and the sample means and standard deviations are computed and plotted on the charts in time order.The overall mean of the sample means is 73.812 millimeters,and the mean of the sample standard deviations is 0.022 millimeters.The control chart constants are (partially)reproduced below. What is the lower control limit for the s chart?A)-0.066 millimeters
B)0 millimeters
C)0.020 millimeters
D)0.022 millimeters
Question
Question
Question
Question
Question
Question
Piston rings for an automotive engine are produced by a forging process.We monitor the inside diameter of the rings manufactured by this process using an  and an s control chart.Samples of size 4 are taken at regular intervals,and the sample means and standard deviations are computed and plotted on the charts in time order.The overall mean of the sample means is
  = 73.97 millimeters,and the sample standard deviation of all measurements is s = 0.03 millimeters.Specifications call for the inside diameter of the rings to be 74.00 ± 0.10 millimeters.The control chart constants are (partially)reproduced below.
  What is the value of an estimate of the capability index Cpk?
A)0.72
B)0.78
C)1.02
D)1.11
and an s control chart.Samples of size 4 are taken at regular intervals,and the sample means and standard deviations are computed and plotted on the charts in time order.The overall mean of the sample means is = 73.97 millimeters,and the sample standard deviation of all measurements is s = 0.03 millimeters.Specifications call for the inside diameter of the rings to be 74.00 ± 0.10 millimeters.The control chart constants are (partially)reproduced below. What is the value of an estimate of the capability index Cpk?A)0.72
B)0.78
C)1.02
D)1.11
Question
Question
A control chart on a process characteristic has been shown to be in control.It has been determined that the process characteristic is approximately Normally distributed with an estimated mean  = 36.5 and standard deviation
= 1.25.The customer has indicated that the output from the process is acceptable if the measured characteristic is between a lower specification limit of 30 and an upper specification limit of 40.What are the estimated values of and
and  ,respectively,for this process output?
A)

= 1.33 and

= 1.73
B)

= 1.33 and

= 0.93
C)

= 1.33 and

= 1.33
D)

= 0.87 and

= 0.93
E)

= 0.87 and

= 1.73
= 36.5 and standard deviation = 1.25.The customer has indicated that the output from the process is acceptable if the measured characteristic is between a lower specification limit of 30 and an upper specification limit of 40.What are the estimated values of
and ,respectively,for this process output?A)
= 1.33 and
= 1.73
B)
= 1.33 and
= 0.93
C)
= 1.33 and
= 1.33
D)
= 0.87 and
= 0.93
E)
= 0.87 and
= 1.73
Question
Question
Parts manufactured by an injection molding process are subjected to a compressive strength test.We monitor the compressive strength of the parts manufactured by this process using an  and an s control chart.Samples of size 9 are taken at regular intervals,and their mean compressive strength (in psi = pounds per square inch)and standard deviation are plotted on the charts in time order.The overall mean of the sample means is
  = 81.2 psi,and the sample standard deviation of all measurements is s = 3.0 psi.Specifications call for the compressive strength of parts to be 80 ± 2.5 psi.The control chart constants are (partially)reproduced below.
 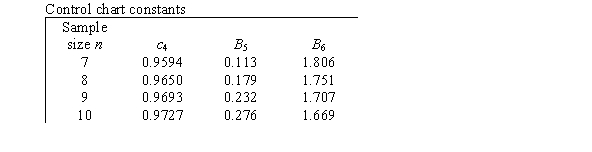 What is the value of an estimate of the capability index Cp?
A)0.140
B)0.144
C)0.269
D)0.278
and an s control chart.Samples of size 9 are taken at regular intervals,and their mean compressive strength (in psi = pounds per square inch)and standard deviation are plotted on the charts in time order.The overall mean of the sample means is = 81.2 psi,and the sample standard deviation of all measurements is s = 3.0 psi.Specifications call for the compressive strength of parts to be 80 ± 2.5 psi.The control chart constants are (partially)reproduced below. What is the value of an estimate of the capability index Cp?A)0.140
B)0.144
C)0.269
D)0.278
Question
Question
Question
Parts manufactured by an injection molding process are subjected to a compressive strength test.We monitor the compressive strength of the parts manufactured by this process using an  and an s control chart.Samples of size 9 are taken at regular intervals,and their mean compressive strength (in psi = pounds per square inch)and standard deviation are plotted on the charts in time order.The overall mean of the sample means is
  = 81.2 psi,and the sample standard deviation of all measurements is s = 3.0 psi.Specifications call for the compressive strength of parts to be 80 ± 2.5 psi.The control chart constants are (partially)reproduced below.
  What is the value of an estimate of the capability index Cpk?
A)0.140
B)0.144
C)0.269
D)0.278
and an s control chart.Samples of size 9 are taken at regular intervals,and their mean compressive strength (in psi = pounds per square inch)and standard deviation are plotted on the charts in time order.The overall mean of the sample means is = 81.2 psi,and the sample standard deviation of all measurements is s = 3.0 psi.Specifications call for the compressive strength of parts to be 80 ± 2.5 psi.The control chart constants are (partially)reproduced below. What is the value of an estimate of the capability index Cpk?A)0.140
B)0.144
C)0.269
D)0.278
Question
Question
Question
Piston rings for an automotive engine are produced by a forging process.We monitor the inside diameter of the rings manufactured by this process using an  and an s control chart.Samples of size 4 are taken at regular intervals,and the sample means and standard deviations are computed and plotted on the charts in time order.The overall mean of the sample means is
= 73.97 millimeters,and the sample standard deviation of all measurements is s = 0.03 millimeters.Specifications call for the inside diameter of the rings to be 74.00 ± 0.10 millimeters.The control chart constants are (partially)reproduced below. What is the value of an estimate of the capability index Cp?
A)0.72
B)0.78
C)1.02
D)1.11
and an s control chart.Samples of size 4 are taken at regular intervals,and the sample means and standard deviations are computed and plotted on the charts in time order.The overall mean of the sample means is = 73.97 millimeters,and the sample standard deviation of all measurements is s = 0.03 millimeters.Specifications call for the inside diameter of the rings to be 74.00 ± 0.10 millimeters.The control chart constants are (partially)reproduced below.
What is the value of an estimate of the capability index Cp?A)0.72
B)0.78
C)1.02
D)1.11
Question
Under what circumstances will the process capability indexes  and
and  be equal?
A)They will be equal when the process is in control.
B)They will be equal when the natural tolerance limits of the process are inside the specification limits.
C)They will be equal if the process mean is outside the specification limits.
D)They will be equal if the process mean is centered midway between the lower specification limit (LSL)and the upper specification limit (USL).
E)They will be never be equal because has 3 in the denominator but
 has 6.
and be equal?A)They will be equal when the process is in control.
B)They will be equal when the natural tolerance limits of the process are inside the specification limits.
C)They will be equal if the process mean is outside the specification limits.
D)They will be equal if the process mean is centered midway between the lower specification limit (LSL)and the upper specification limit (USL).
E)They will be never be equal because
has 3 in the denominator but has 6. Question
Suppose you want to determine if offering students free flu shots has been useful in cutting down on the number students missing class due to illness.Each week during flu season you count the number of students out of the entire student body who report to the campus clinic with flu symptoms.Which chart would be useful in helping you monitor this process?
A)p chart
B) chart
chart
C)R chart
D)None of the above
A)p chart
B)
chartC)R chart
D)None of the above
Question
The capability index 
can be very informative and useful even if the sample size is small.
can be very informative and useful even if the sample size is small.
Question
Question

Unlock Deck
Sign up to unlock the cards in this deck!
Unlock Deck
Unlock Deck
1/86
Play
Full screen (f)
Deck 17: Statistics for Quality: Control and Capability
1
A variable is measured periodically on a process.Suppose the variable continues to be described by the same distribution when observed over time.What can we say about this variable?
A)It is nonrandom.
B)It is in statistical control.
C)It is a simple random variable.
D)It is natural.
A)It is nonrandom.
B)It is in statistical control.
C)It is a simple random variable.
D)It is natural.
It is in statistical control.
2
When we examine and s charts,what is the best strategy to use?
A)Start with the chart and only examine the s chart if a point is out of control.
B)Start with the s chart and ignore the chart unless the s chart is in control or until any special causes for lack of control in the s chart have been found and removed.
C)Examine both simultaneously and only declare a point out of control if it is outside the control limits on both charts.
D)Examine both simultaneously and only declare a point out of control if it is outside the control limits of the chart but within the control limits of the s chart.
and s charts,what is the best strategy to use?A)Start with the
chart and only examine the s chart if a point is out of control.B)Start with the s chart and ignore the
chart unless the s chart is in control or until any special causes for lack of control in the s chart have been found and removed.C)Examine both simultaneously and only declare a point out of control if it is outside the control limits on both charts.
D)Examine both simultaneously and only declare a point out of control if it is outside the control limits of the
chart but within the control limits of the s chart.Start with the s chart and ignore the chart unless the s chart is in control or until any special causes for lack of control in the s chart have been found and removed.
chart unless the s chart is in control or until any special causes for lack of control in the s chart have been found and removed. 3
Piston rings for an automotive engine are produced by a forging process.We wish to monitor the inside diameter of the rings manufactured by this process using an and an s control chart.Samples of size 4 are to be taken at regular intervals,and the sample means and standard deviations are computed and plotted on the charts in time order.The target values for the inside diameter are a mean of = 75 millimeters and a standard deviation of = 0.02 millimeters.The control chart constants are (partially)reproduced below. What is the lower control limit for the s chart?
A)-0.04 millimeters
B)0 millimeters
C)0.018 millimeters
D)0.02 millimeters
and an s control chart.Samples of size 4 are to be taken at regular intervals,and the sample means and standard deviations are computed and plotted on the charts in time order.The target values for the inside diameter are a mean of = 75 millimeters and a standard deviation of = 0.02 millimeters.The control chart constants are (partially)reproduced below. What is the lower control limit for the s chart?A)-0.04 millimeters
B)0 millimeters
C)0.018 millimeters
D)0.02 millimeters
0 millimeters
4
Parts manufactured by an injection molding process are subjected to a compressive strength test.We wish to monitor the compressive strength of the parts manufactured by this process using both and s charts.Samples of size 9 are to be taken at regular intervals,and their mean compressive strength (in psi = pounds per square inch)and standard deviation are plotted on the charts in time order.The target values for the compressive strengths are a mean of = 80 psi and a standard deviation of = 3 psi.The control chart constants are (partially)reproduced below. What is the upper control limit for the s chart?
A)0.7 psi
B)2.9 psi
C)5.1 psi
D)12 psi
and s charts.Samples of size 9 are to be taken at regular intervals,and their mean compressive strength (in psi = pounds per square inch)and standard deviation are plotted on the charts in time order.The target values for the compressive strengths are a mean of = 80 psi and a standard deviation of = 3 psi.The control chart constants are (partially)reproduced below. What is the upper control limit for the s chart?A)0.7 psi
B)2.9 psi
C)5.1 psi
D)12 psi
Unlock Deck
Unlock for access to all 86 flashcards in this deck.
Unlock Deck
k this deck
5
Piston rings for an automotive engine are produced by a forging process.We wish to monitor the inside diameter of the rings manufactured by this process using an and an s control chart.Samples of size 4 are to be taken at regular intervals,and the sample means and standard deviations are computed and plotted on the charts in time order.The target values for the inside diameter are a mean of = 75 millimeters and a standard deviation of = 0.02 millimeters.The control chart constants are (partially)reproduced below. What is the upper control limit for the
Chart?
A)0.03 millimeters
B)74.97 millimeters
C)75 millimeters
D)75.03 millimeters
and an s control chart.Samples of size 4 are to be taken at regular intervals,and the sample means and standard deviations are computed and plotted on the charts in time order.The target values for the inside diameter are a mean of = 75 millimeters and a standard deviation of = 0.02 millimeters.The control chart constants are (partially)reproduced below. What is the upper control limit for the Chart?
A)0.03 millimeters
B)74.97 millimeters
C)75 millimeters
D)75.03 millimeters
Unlock Deck
Unlock for access to all 86 flashcards in this deck.
Unlock Deck
k this deck
6
Parts manufactured by an injection molding process are subjected to a compressive strength test.We wish to monitor the compressive strength of the parts manufactured by this process using both and s charts.Samples of size 9 are to be taken at regular intervals,and their mean compressive strength (in psi = pounds per square inch)and standard deviation are plotted on the charts in time order.The target values for the compressive strengths are a mean of = 80 psi and a standard deviation of = 3 psi.The control chart constants are (partially)reproduced below. What is the center line for the s chart?
A)0.7 psi
B)2.9 psi
C)3 psi
D)5.1 psi
and s charts.Samples of size 9 are to be taken at regular intervals,and their mean compressive strength (in psi = pounds per square inch)and standard deviation are plotted on the charts in time order.The target values for the compressive strengths are a mean of = 80 psi and a standard deviation of = 3 psi.The control chart constants are (partially)reproduced below. What is the center line for the s chart?A)0.7 psi
B)2.9 psi
C)3 psi
D)5.1 psi
Unlock Deck
Unlock for access to all 86 flashcards in this deck.
Unlock Deck
k this deck
7
Piston rings for an automotive engine are produced by a forging process.We wish to monitor the inside diameter of the rings manufactured by this process using an and an s control chart.Samples of size 4 are to be taken at regular intervals,and the sample means and standard deviations are computed and plotted on the charts in time order.The target values for the inside diameter are a mean of = 75 millimeters and a standard deviation of = 0.02 millimeters.The control chart constants are (partially)reproduced below. What is the center line for the s chart?
A)0.018 millimeters
B)0.02 millimeters
C)0.04 millimeters
D)75 millimeters
and an s control chart.Samples of size 4 are to be taken at regular intervals,and the sample means and standard deviations are computed and plotted on the charts in time order.The target values for the inside diameter are a mean of = 75 millimeters and a standard deviation of = 0.02 millimeters.The control chart constants are (partially)reproduced below. What is the center line for the s chart?A)0.018 millimeters
B)0.02 millimeters
C)0.04 millimeters
D)75 millimeters
Unlock Deck
Unlock for access to all 86 flashcards in this deck.
Unlock Deck
k this deck
8
What is the name of a chart in which the standard deviations of samples taken at regular intervals are plotted against the time order in which the samples were taken?
A)An s chart
B)An
Chart
C)An R chart
D)A p chart
A)An s chart
B)An
Chart
C)An R chart
D)A p chart
Unlock Deck
Unlock for access to all 86 flashcards in this deck.
Unlock Deck
k this deck
9
A statistic Q is to be used to monitor a process over time,using a control chart for that statistic.When the process is running in a state of control,it is known that the statistic Q has mean and standard deviation
.Which of the following is NOT a feature of the appropriate three-sigma control chart for Q?
A)Values of Q,obtained from regular samples from the process,will be plotted on the control chart against the time order of the samples.
B)A signal will be given if the value of the statistic Q falls between the upper control limit (UCL)and the lower control limit (LCL).
C)The center line for the control chart will be set at
.
D)The lower control limit (LCL)will be set at
- 3
.
E)The upper control limit (UCL)will be set at
+ 3
.
and standard deviation .Which of the following is NOT a feature of the appropriate three-sigma control chart for Q?
A)Values of Q,obtained from regular samples from the process,will be plotted on the control chart against the time order of the samples.
B)A signal will be given if the value of the statistic Q falls between the upper control limit (UCL)and the lower control limit (LCL).
C)The center line for the control chart will be set at
.
D)The lower control limit (LCL)will be set at
- 3
.
E)The upper control limit (UCL)will be set at
+ 3
.
Unlock Deck
Unlock for access to all 86 flashcards in this deck.
Unlock Deck
k this deck
10
Which of the following is an example of a process that is in control but does not have capability?
A)Every day you spend 1 hour cooking dinner for your kids,and they always love the meal.However,today you came home and the electricity was out,so all of the food is spoiled.Hence,you order takeout.
B)Every day you spend 1 hour cooking dinner for your kids,and they always love the meal.However,today you are late getting home from work so you cook dinner 1 hour later than usual.
C)Every day you spend 1 hour cooking dinner for your kids,but your kids usually do not like what you cook.
D)None of the above
Unlock Deck
Unlock for access to all 86 flashcards in this deck.
Unlock Deck
k this deck
11
It is said that "the first step to improving a process is to understand it." Which of the following may be helpful in gaining an understanding of the process?
A)A flowchart showing all the stages of a process
B)A cause-and-effect diagram showing the logical relationships between the inputs,the stages of a process,and the outputs
C)A histogram of the measurements made at a specific stage of the process
D)Any and all of the above
E)Only A and B
A)A flowchart showing all the stages of a process
B)A cause-and-effect diagram showing the logical relationships between the inputs,the stages of a process,and the outputs
C)A histogram of the measurements made at a specific stage of the process
D)Any and all of the above
E)Only A and B
Unlock Deck
Unlock for access to all 86 flashcards in this deck.
Unlock Deck
k this deck
12
What is the main function of a cause-and-effect diagram?
A)It is a picture of the stages of a process.
B)It organizes the logical relationships between the inputs and stages of a process and an output.
C)It is a scatterplot that uses different plotting symbols for points that correspond to possibly different causes.
D)It is a bar chart in which the bars are ordered by height.
Unlock Deck
Unlock for access to all 86 flashcards in this deck.
Unlock Deck
k this deck
13
Statistical stability means there is no variation in the variable measured.
Unlock Deck
Unlock for access to all 86 flashcards in this deck.
Unlock Deck
k this deck
14
Which of the following statements about special causes of variation is/are FALSE?
A)It is the type of variation that we would hope to be able to detect so that it could be eliminated.
B)It is variation that is added to common cause variation because of unpredictable disturbances that affect the normal functioning of the process from time to time.
C)It is variation that is inherent to the process because of the many small causes that are always present in a process.
D)Control charts are designed to give a signal when special causes of variation are present,so that action can be taken to find and remove the cause of the disturbance.
E)As a result of a special cause,the result may be that the process mean,the process standard deviation,or both may have changed.
Unlock Deck
Unlock for access to all 86 flashcards in this deck.
Unlock Deck
k this deck
15
Which of the following is an example of special cause variation?
A)Every day you spend 1 hour cooking dinner for your kids,and they always love the meal.However,today you came home and the electricity was out,so all of the food is spoiled.Hence,you order takeout.
B)Every day you spend 1 hour cooking dinner for your kids,and they always love the meal.However,today you are late getting home from work so you cook dinner 1 hour later than usual.
C)Every day you spend 1 hour cooking dinner for your kids,but your kids usually do not like what you cook.
D)None of the above
Unlock Deck
Unlock for access to all 86 flashcards in this deck.
Unlock Deck
k this deck
16
You drive to school every day.This can be viewed as a process.It takes you approximately 15 minutes to get from your apartment to school,but the exact time varies from day to day.Which of the following would be considered special cause variation?
A)The number of red traffic lights you encounter
B)A major accident along the route you take ties up traffic for a long period of time
C)Getting stuck behind a car going under the speed limit for a few blocks
D)Driving to work in a heavy rain storm
A)The number of red traffic lights you encounter
B)A major accident along the route you take ties up traffic for a long period of time
C)Getting stuck behind a car going under the speed limit for a few blocks
D)Driving to work in a heavy rain storm
Unlock Deck
Unlock for access to all 86 flashcards in this deck.
Unlock Deck
k this deck
17
Parts manufactured by an injection molding process are subjected to a compressive strength test.We wish to monitor the compressive strength of the parts manufactured by this process using both and s charts.Samples of size 9 are to be taken at regular intervals,and their mean compressive strength (in psi = pounds per square inch)and standard deviation are plotted on the charts in time order.The target values for the compressive strengths are a mean of = 80 psi and a standard deviation of = 3 psi.The control chart constants are (partially)reproduced below. Suppose at the time of sample 10,we observe a mean of 85 psi.What should we do?
A)Declare the process out of control.
B)Continue sampling-the process is still in control.
C)Continue sampling,but increase the sample size to 16.The process is barely in control.
D)Continue sampling,but reduce the sample size to 4.The process is well in control.
and s charts.Samples of size 9 are to be taken at regular intervals,and their mean compressive strength (in psi = pounds per square inch)and standard deviation are plotted on the charts in time order.The target values for the compressive strengths are a mean of = 80 psi and a standard deviation of = 3 psi.The control chart constants are (partially)reproduced below. Suppose at the time of sample 10,we observe a mean of 85 psi.What should we do?A)Declare the process out of control.
B)Continue sampling-the process is still in control.
C)Continue sampling,but increase the sample size to 16.The process is barely in control.
D)Continue sampling,but reduce the sample size to 4.The process is well in control.
Unlock Deck
Unlock for access to all 86 flashcards in this deck.
Unlock Deck
k this deck
18
Piston rings for an automotive engine are produced by a forging process.We wish to monitor the inside diameter of the rings manufactured by this process using an and an s control chart.Samples of size 4 are to be taken at regular intervals,and the sample means and standard deviations are computed and plotted on the charts in time order.The target values for the inside diameter are a mean of = 75 millimeters and a standard deviation of = 0.02 millimeters.The control chart constants are (partially)reproduced below. What is the center line for the
Chart?
A)0.03 millimeters
B)74.97 millimeters
C)75 millimeters
D)75.03 millimeters
and an s control chart.Samples of size 4 are to be taken at regular intervals,and the sample means and standard deviations are computed and plotted on the charts in time order.The target values for the inside diameter are a mean of = 75 millimeters and a standard deviation of = 0.02 millimeters.The control chart constants are (partially)reproduced below. What is the center line for the Chart?
A)0.03 millimeters
B)74.97 millimeters
C)75 millimeters
D)75.03 millimeters
Unlock Deck
Unlock for access to all 86 flashcards in this deck.
Unlock Deck
k this deck
19
Parts manufactured by an injection molding process are subjected to a compressive strength test.We wish to monitor the compressive strength of the parts manufactured by this process using both and s charts.Samples of size 9 are to be taken at regular intervals,and their mean compressive strength (in psi = pounds per square inch)and standard deviation are plotted on the charts in time order.The target values for the compressive strengths are a mean of = 80 psi and a standard deviation of = 3 psi.The control chart constants are (partially)reproduced below. What is the lower control limit for the
Chart?
A)71 psi
B)77 psi
C)83 psi
D)89 psi
and s charts.Samples of size 9 are to be taken at regular intervals,and their mean compressive strength (in psi = pounds per square inch)and standard deviation are plotted on the charts in time order.The target values for the compressive strengths are a mean of = 80 psi and a standard deviation of = 3 psi.The control chart constants are (partially)reproduced below. What is the lower control limit for the Chart?
A)71 psi
B)77 psi
C)83 psi
D)89 psi
Unlock Deck
Unlock for access to all 86 flashcards in this deck.
Unlock Deck
k this deck
20
Parts manufactured by an injection molding process are subjected to a compressive strength test.We wish to monitor the compressive strength of the parts manufactured by this process using both and s charts.Samples of size 9 are to be taken at regular intervals,and their mean compressive strength (in psi = pounds per square inch)and standard deviation are plotted on the charts in time order.The target values for the compressive strengths are a mean of = 80 psi and a standard deviation of = 3 psi.The control chart constants are (partially)reproduced below. What is the center line for the
Chart?
A)3 psi
B)77 psi
C)80 psi
D)None of the above
and s charts.Samples of size 9 are to be taken at regular intervals,and their mean compressive strength (in psi = pounds per square inch)and standard deviation are plotted on the charts in time order.The target values for the compressive strengths are a mean of = 80 psi and a standard deviation of = 3 psi.The control chart constants are (partially)reproduced below. What is the center line for the Chart?
A)3 psi
B)77 psi
C)80 psi
D)None of the above
Unlock Deck
Unlock for access to all 86 flashcards in this deck.
Unlock Deck
k this deck
21
Which of the following would produce an out-of-control signal in a control chart?
A)One point below the upper control limit or one point above the lower control limit
B)A run of nine points over the center line or a run of nine points below the center line
C)All of the above
D)None of the above
A)One point below the upper control limit or one point above the lower control limit
B)A run of nine points over the center line or a run of nine points below the center line
C)All of the above
D)None of the above
Unlock Deck
Unlock for access to all 86 flashcards in this deck.
Unlock Deck
k this deck
22
The data below represent the means from 15 sample control charts for the amount of time in minutes it takes students to complete a quiz in a basic statistics course.The same quiz was given to 15 different sections of a basic statistics course.Five students were sampled from each class and each mean is shown below. What is the value of the lower control limit?
A)16.71
B)2.83
C)9.77
D)None of the above
What is the value of the lower control limit?A)16.71
B)2.83
C)9.77
D)None of the above
Unlock Deck
Unlock for access to all 86 flashcards in this deck.
Unlock Deck
k this deck
23
Which of the following is true about processes that are in control?
A)Processes that are in control are also stable.
B)Processes that are in control are also capable.
C)Processes that are in control are also feasible.
D)None of the above
A)Processes that are in control are also stable.
B)Processes that are in control are also capable.
C)Processes that are in control are also feasible.
D)None of the above
Unlock Deck
Unlock for access to all 86 flashcards in this deck.
Unlock Deck
k this deck
24
The data below represent the means from 15 sample control charts for the amount of time in minutes it takes students to complete a quiz in a basic statistics course.The same quiz was given to 15 different sections of a basic statistics course.Five students were sampled from each class and each mean is shown below. What is the approximate value of the center line for the correct control chart?
A)16.71
B)2.83
C)9.77
D)None of the above
What is the approximate value of the center line for the correct control chart?A)16.71
B)2.83
C)9.77
D)None of the above
Unlock Deck
Unlock for access to all 86 flashcards in this deck.
Unlock Deck
k this deck
25
What do control limits show?
A)The exact value for the mean when a process is in control
B)The variation in the means that is expected when a process is not in control
C)The variation in the means that is expected when a process is in control
D)None of the above
A)The exact value for the mean when a process is in control
B)The variation in the means that is expected when a process is not in control
C)The variation in the means that is expected when a process is in control
D)None of the above
Unlock Deck
Unlock for access to all 86 flashcards in this deck.
Unlock Deck
k this deck
26
You have been invited to give a special address at the Joint Statistics Meeting on your research area.You are allotted 1 hour to give your talk.You practice your talk many times in order to make sure it is perfect and within the time constraints.What is a special cause variation for the length of the talk?
A)The variation in the length of the talk caused by you intentionally speaking quickly in a few of your practice sessions so that you can finish the talk quickly in order to attend an impromptu meeting
B)The variation in the length of the talk caused by variation in the speed with which you talk and the amount of words used during each practice session
C)All of the above
D)None of the above
Unlock Deck
Unlock for access to all 86 flashcards in this deck.
Unlock Deck
k this deck
27
Which of the following is an example of a process that is in control but does not have capability?
A)A university builds new dormitories that most students give a high ranking of 5.7 out of 6 for the best place to live in the Washington,DC,area.However,very few students actually choose to live in the new dormitories when school starts.
B)A university builds new dormitories that students give a low ranking of 1.4 out of 6 for the best place to live in the Washington,DC,area.Therefore,very few students actually choose to live in the new dormitories.
C)A university builds new dormitories that are plagued with problems.Average rankings from students of the new dormitories range from 1 to 6 out of a possible 7.
D)None of the above
Unlock Deck
Unlock for access to all 86 flashcards in this deck.
Unlock Deck
k this deck
28
Out of control signals are produced from control charts when __________.
A)a single point is outside the control limits
B)consecutive points are outside the control limits
C)Both A and B are possible.
D)None of the above
A)a single point is outside the control limits
B)consecutive points are outside the control limits
C)Both A and B are possible.
D)None of the above
Unlock Deck
Unlock for access to all 86 flashcards in this deck.
Unlock Deck
k this deck
29
The sampling distribution of under the process-monitoring condition is __________.
A)Normal
B)binomial
C)T
D)any distribution
under the process-monitoring condition is __________.A)Normal
B)binomial
C)T
D)any distribution
Unlock Deck
Unlock for access to all 86 flashcards in this deck.
Unlock Deck
k this deck
30
You have been invited to give a special address at the Joint Statistics Meeting on your research area.You are allotted 1 hour to give your talk.You practice your talk many times in order to make sure it is perfect and within the time constraints.What is the common cause variation for the length of the talk?
A)The variation in the length of the talk caused by you intentionally speaking quickly in a few of your practice sessions so that you can finish the talk in order to attend an impromptu meeting
B)The variation in the length of the talk caused by variation in the speed with which you talk and the amount of words used during each practice session
C)All of the above
D)None of the above
Unlock Deck
Unlock for access to all 86 flashcards in this deck.
Unlock Deck
k this deck
31
What condition is necessary for a process to be capable?
A)The process must be in control.
B)The process must meet external specifications.
C)The process must not have any runs.
D)None of the above
A)The process must be in control.
B)The process must meet external specifications.
C)The process must not have any runs.
D)None of the above
Unlock Deck
Unlock for access to all 86 flashcards in this deck.
Unlock Deck
k this deck
32
Which of the following is true about s and R charts?
A)An R chart is more informative than an s chart.
B)An s chart is more informative than an R chart.
C)Both charts are equally informative.
D)None of the above
A)An R chart is more informative than an s chart.
B)An s chart is more informative than an R chart.
C)Both charts are equally informative.
D)None of the above
Unlock Deck
Unlock for access to all 86 flashcards in this deck.
Unlock Deck
k this deck
33
Which rule will typically signal an out-of-control signal faster?
A)The one-point rule
B)The runs rule
A)The one-point rule
B)The runs rule
Unlock Deck
Unlock for access to all 86 flashcards in this deck.
Unlock Deck
k this deck
34
Which of the following is an example of a process?
A)Reading through all your email every day and determining whether or not to reply
B)Reading all your friends' Facebook status updates and deciding whether or not to add a comment
C)Going through your music library to determine which songs you will put on your smart phone
D)All of the above
A)Reading through all your email every day and determining whether or not to reply
B)Reading all your friends' Facebook status updates and deciding whether or not to add a comment
C)Going through your music library to determine which songs you will put on your smart phone
D)All of the above
Unlock Deck
Unlock for access to all 86 flashcards in this deck.
Unlock Deck
k this deck
35
The data below represent the means from 15 sample control charts for the amount of time in minutes it takes students to complete a quiz in a basic statistics course.The same quiz was given to 15 different sections of a basic statistics course.Five students were sampled from each class and each mean is shown below. Which graph is the control chart for ?
A)
B)
C)
D)None of the above
Which graph is the control chart for ?A)
B)
C)
D)None of the above
Unlock Deck
Unlock for access to all 86 flashcards in this deck.
Unlock Deck
k this deck
36
Why is statistical control necessary?
A)If a process is in control,then we know exactly what the final output will be at the end.
B)If a process is in control,then we have a good idea of what to expect in the end.
C)Actually,statistical control is not necessary or desirable.
A)If a process is in control,then we know exactly what the final output will be at the end.
B)If a process is in control,then we have a good idea of what to expect in the end.
C)Actually,statistical control is not necessary or desirable.
Unlock Deck
Unlock for access to all 86 flashcards in this deck.
Unlock Deck
k this deck
37
What do R charts measure?
A)The spread based on the range
B)The spread based on the standard deviation
C)The mean based on the range
D)The mean based on the standard deviation
A)The spread based on the range
B)The spread based on the standard deviation
C)The mean based on the range
D)The mean based on the standard deviation
Unlock Deck
Unlock for access to all 86 flashcards in this deck.
Unlock Deck
k this deck
38
Which of the control charts is out of control?
A)
B)
C)All of the above
D)None of the above
A)
B)
C)All of the above
D)None of the above
Unlock Deck
Unlock for access to all 86 flashcards in this deck.
Unlock Deck
k this deck
39
The data below represent the means from 15 sample control charts for the amount of time in minutes it takes students to complete a quiz in a basic statistics course.The same quiz was given to 15 different sections of a basic statistics course.Five students were sampled from each class and each mean is shown below. What is the value of the upper control limit?
A)16.71
B)2.83
C)9.77
D)None of the above
What is the value of the upper control limit?A)16.71
B)2.83
C)9.77
D)None of the above
Unlock Deck
Unlock for access to all 86 flashcards in this deck.
Unlock Deck
k this deck
40
Which of the control charts is in control?
A)
B)
C)All of the above
D)None of the above
A)
B)
C)All of the above
D)None of the above
Unlock Deck
Unlock for access to all 86 flashcards in this deck.
Unlock Deck
k this deck
41
When a process variable is Normally distributed,there are two important process characteristics that need to be monitored: the mean,,and the standard deviation,.Which control chart would be used to monitor the process spread?
A)The R chart
B)The chart
C)The s chart
D)Any of the above charts would be appropriate to monitor process spread.
E)Only A and C monitor process spread.
A)The R chart
B)The
chartC)The s chart
D)Any of the above charts would be appropriate to monitor process spread.
E)Only A and C monitor process spread.
Unlock Deck
Unlock for access to all 86 flashcards in this deck.
Unlock Deck
k this deck
42
Parts manufactured by an injection molding process are subjected to a compressive strength test.We monitor the compressive strength of the parts manufactured by this process using an and an s control chart.Samples of size 9 are taken at regular intervals,and their mean compressive strength (in psi = pounds per square inch)and standard deviation are plotted on the charts in time order.The overall mean of the sample means is = 81.2 psi,and the mean of the sample standard deviations is = 2.9 psi.The control chart constants are (partially)reproduced below. What is the lower control limit for the chart?
A)0 psi
B)18.8 psi
C)78.2 psi
D)78.7 psi
and an s control chart.Samples of size 9 are taken at regular intervals,and their mean compressive strength (in psi = pounds per square inch)and standard deviation are plotted on the charts in time order.The overall mean of the sample means is = 81.2 psi,and the mean of the sample standard deviations is = 2.9 psi.The control chart constants are (partially)reproduced below. What is the lower control limit for the chart?A)0 psi
B)18.8 psi
C)78.2 psi
D)78.7 psi
Unlock Deck
Unlock for access to all 86 flashcards in this deck.
Unlock Deck
k this deck
43
What do we call the ability of a process to meet or exceed the requirements placed on it?
A)Being in control
B)Being within tolerances
C)The stability
D)The capability
A)Being in control
B)Being within tolerances
C)The stability
D)The capability
Unlock Deck
Unlock for access to all 86 flashcards in this deck.
Unlock Deck
k this deck
44
Suppose we use a "run of eight" rule;that is,we declare the process out of control if eight consecutive points are all above the center line of the chart or if eight consecutive points are all below the center line of the
Chart.If the process is in statistical control,what is the (approximate)probability that we declare the process out of control using this rule?
A)0.001
B)0.004
C)0.008
D)0.05
chart or if eight consecutive points are all below the center line of the Chart.If the process is in statistical control,what is the (approximate)probability that we declare the process out of control using this rule?
A)0.001
B)0.004
C)0.008
D)0.05
Unlock Deck
Unlock for access to all 86 flashcards in this deck.
Unlock Deck
k this deck
45
A bank is interested in improving the time it takes to complete transactions at teller windows.The goal is to have no transaction take more than 5 minutes.What name do we give the quantity "5 minutes"?
A)The upper control limit
B)The upper tolerance limit
C)The upper specification limit
D)The upper capability limit
A)The upper control limit
B)The upper tolerance limit
C)The upper specification limit
D)The upper capability limit
Unlock Deck
Unlock for access to all 86 flashcards in this deck.
Unlock Deck
k this deck
46
Piston rings for an automotive engine are produced by a forging process.We monitor the inside diameter of the rings manufactured by this process using an and an s control chart.Samples of size 4 are taken at regular intervals,and the sample means and standard deviations are computed and plotted on the charts in time order.The overall mean of the sample means is 73.812 millimeters,and the mean of the sample standard deviations is 0.022 millimeters.The control chart constants are (partially)reproduced below. What is the value of the upper control limit for the chart?
A)73.834 millimeters
B)73.848 millimeters
C)73.878 millimeters
D)154.119 millimeters
and an s control chart.Samples of size 4 are taken at regular intervals,and the sample means and standard deviations are computed and plotted on the charts in time order.The overall mean of the sample means is 73.812 millimeters,and the mean of the sample standard deviations is 0.022 millimeters.The control chart constants are (partially)reproduced below. What is the value of the upper control limit for the chart?A)73.834 millimeters
B)73.848 millimeters
C)73.878 millimeters
D)154.119 millimeters
Unlock Deck
Unlock for access to all 86 flashcards in this deck.
Unlock Deck
k this deck
47
Which of the following statements about the use of control charts is/are FALSE?
A)The one point outside the control limits on the chart is effective for detecting a gradual shift in the process mean.
B)To provide a quicker alarm when the process has gone out of control we can look for other patterns on the chart,such as by adding a runs rule.
C)A pattern such as nine consecutive points,either above the center line or below the center line,can be used as a signal that a process has been disturbed by a special cause.
D)When additional patterns are looked for on a control chart,the false alarm rate,when the process is in control,will increase.
E)A false alarm occurs on a control chart when a plotted point gives an out-of-control signal,but the process is operating only with common cause variability.
A)The one point outside the control limits on the
chart is effective for detecting a gradual shift in the process mean.B)To provide a quicker alarm when the process has gone out of control we can look for other patterns on the
chart,such as by adding a runs rule.C)A pattern such as nine consecutive points,either above the center line or below the center line,can be used as a signal that a process has been disturbed by a special cause.
D)When additional patterns are looked for on a control chart,the false alarm rate,when the process is in control,will increase.
E)A false alarm occurs on a control chart when a plotted point gives an out-of-control signal,but the process is operating only with common cause variability.
Unlock Deck
Unlock for access to all 86 flashcards in this deck.
Unlock Deck
k this deck
48
Piston rings for an automotive engine are produced by a forging process.We monitor the inside diameter of the rings manufactured by this process using an and an s control chart.Samples of size 4 are taken at regular intervals,and the sample means and standard deviations are computed and plotted on the charts in time order.The overall mean of the sample means is 73.812 millimeters,and the mean of the sample standard deviations is 0.022 millimeters.The control chart constants are (partially)reproduced below. What value would we use for the center line of the chart?
A)68.003 millimeters
B)73.790 millimeters
C)73.812 millimeters
D)154.119 millimeters
and an s control chart.Samples of size 4 are taken at regular intervals,and the sample means and standard deviations are computed and plotted on the charts in time order.The overall mean of the sample means is 73.812 millimeters,and the mean of the sample standard deviations is 0.022 millimeters.The control chart constants are (partially)reproduced below. What value would we use for the center line of the chart?A)68.003 millimeters
B)73.790 millimeters
C)73.812 millimeters
D)154.119 millimeters
Unlock Deck
Unlock for access to all 86 flashcards in this deck.
Unlock Deck
k this deck
49
Parts manufactured by an injection molding process are subjected to a compressive strength test.We monitor the compressive strength of the parts manufactured by this process using an and an s control chart.Samples of size 9 are taken at regular intervals,and their mean compressive strength (in psi = pounds per square inch)and standard deviation are plotted on the charts in time order.The overall mean of the sample means is = 81.2 psi,and the mean of the sample standard deviations is = 2.9 psi.The control chart constants are (partially)reproduced below. What is the value of the center line for the chart?
A)18.8 psi
B)78.7 psi
C)81.2 psi
D)138.6 psi
and an s control chart.Samples of size 9 are taken at regular intervals,and their mean compressive strength (in psi = pounds per square inch)and standard deviation are plotted on the charts in time order.The overall mean of the sample means is = 81.2 psi,and the mean of the sample standard deviations is = 2.9 psi.The control chart constants are (partially)reproduced below. What is the value of the center line for the chart?A)18.8 psi
B)78.7 psi
C)81.2 psi
D)138.6 psi
Unlock Deck
Unlock for access to all 86 flashcards in this deck.
Unlock Deck
k this deck
50
Piston rings for an automotive engine are produced by a forging process.We monitor the inside diameter of the rings manufactured by this process using an and an s control chart.Samples of size 4 are taken at regular intervals,and the sample means and standard deviations are computed and plotted on the charts in time order.The overall mean of the sample means is 73.812 millimeters,and the mean of the sample standard deviations is 0.022 millimeters.The control chart constants are (partially)reproduced below. The overall mean of the sample means is given as 73.812 millimeters.What symbol do we use to represent this value?
A)
B)
C)
D)
and an s control chart.Samples of size 4 are taken at regular intervals,and the sample means and standard deviations are computed and plotted on the charts in time order.The overall mean of the sample means is 73.812 millimeters,and the mean of the sample standard deviations is 0.022 millimeters.The control chart constants are (partially)reproduced below. The overall mean of the sample means is given as 73.812 millimeters.What symbol do we use to represent this value?A)
B)
C)
D)
Unlock Deck
Unlock for access to all 86 flashcards in this deck.
Unlock Deck
k this deck
51
An important characteristic in the proper operation of ignition keys for automobiles is the groove width of the key.In a large manufacturing plant that produces thousands of keys,control charts have been established to monitor the process of cutting the groove.It is believed that the measurement (in inches)of the groove width is Normally distributed.Over a period of time,20 samples,each of size n = 5,were selected in order to establish 3-sigma and s charts.From these samples the following were determined: = 0.15932 and
= 0.0193438.Examination of the chart and the s chart for the samples led to the conclusion that the process was in control at this time.Because this process is in a state of statistical control,we are able to predict what to expect in the finished product.What will be the natural tolerances for the grooves in the ignition keys?
A)(0.00659,0.00935)
B)(0.00488,0.01105)
C)(0.00506,0.01087)
D)(0.13337,0.18527)
E)This cannot be determined with the given information.
and s charts.From these samples the following were determined: = 0.15932 and = 0.0193438.Examination of the
chart and the s chart for the samples led to the conclusion that the process was in control at this time.Because this process is in a state of statistical control,we are able to predict what to expect in the finished product.What will be the natural tolerances for the grooves in the ignition keys?A)(0.00659,0.00935)
B)(0.00488,0.01105)
C)(0.00506,0.01087)
D)(0.13337,0.18527)
E)This cannot be determined with the given information.
Unlock Deck
Unlock for access to all 86 flashcards in this deck.
Unlock Deck
k this deck
52
An important characteristic in the proper operation of ignition keys for automobiles is the groove width of the key.In a large manufacturing plant that produces thousands of keys,control charts have been established to monitor the process of cutting the groove.It is believed that the measurement (in inches)of the groove width is Normally distributed.Over a period of time,20 samples,each of size n = 5,were selected in order to establish 3-sigma and s charts.From these samples the following were determined: = 0.15932 and
= 0.0193438.What is the value of the center line on the chart and on the s chart,respectively?
A)0.00797;0.001028
B)0.15932;0.019344
C)0.00797;0.000967
D)0.15932;0.000967
E)0.00797;0.019344
and s charts.From these samples the following were determined: = 0.15932 and = 0.0193438.What is the value of the center line on the
chart and on the s chart,respectively?A)0.00797;0.001028
B)0.15932;0.019344
C)0.00797;0.000967
D)0.15932;0.000967
E)0.00797;0.019344
Unlock Deck
Unlock for access to all 86 flashcards in this deck.
Unlock Deck
k this deck
53
What is an R chart used for?
A)To monitor the center of a process
B)To monitor the spread of a process
C)To monitor both the center and spread of a process
D)To monitor the correlation of a process
A)To monitor the center of a process
B)To monitor the spread of a process
C)To monitor both the center and spread of a process
D)To monitor the correlation of a process
Unlock Deck
Unlock for access to all 86 flashcards in this deck.
Unlock Deck
k this deck
54
Parts manufactured by an injection molding process are subjected to a compressive strength test.We monitor the compressive strength of the parts manufactured by this process using an and an s control chart.Samples of size 9 are taken at regular intervals,and their mean compressive strength (in psi = pounds per square inch)and standard deviation are plotted on the charts in time order.The overall mean of the sample means is = 81.2 psi,and the mean of the sample standard deviations is = 2.9 psi.The control chart constants are (partially)reproduced below. What is the center line for the s chart?
A)2.8 psi
B)2.9 psi
C)3 psi
D)5.0 psi
and an s control chart.Samples of size 9 are taken at regular intervals,and their mean compressive strength (in psi = pounds per square inch)and standard deviation are plotted on the charts in time order.The overall mean of the sample means is = 81.2 psi,and the mean of the sample standard deviations is = 2.9 psi.The control chart constants are (partially)reproduced below. What is the center line for the s chart?A)2.8 psi
B)2.9 psi
C)3 psi
D)5.0 psi
Unlock Deck
Unlock for access to all 86 flashcards in this deck.
Unlock Deck
k this deck
55
An important characteristic in the proper operation of ignition keys for automobiles is the groove width of the key.In a large manufacturing plant that produces thousands of keys,control charts have been established to monitor the process of cutting the groove.It is believed that the measurement (in inches)of the groove width is Normally distributed.Over a period of time,20 samples,each of size n = 5,were selected in order to establish 3-sigma and s charts.From these samples the following were determined: = 0.15932 and
= 0.0193438.For the chart that is being set up,what are the appropriate 3-sigma lower and upper control limits, (LCL,UCL)?
A)(0.00667,0.00927)
B)(-0.02289,0.03883)
C)(0.13337,0.18527)
D)(0.00659,0.00935)
E)None of the above
and s charts.From these samples the following were determined: = 0.15932 and = 0.0193438.For the
chart that is being set up,what are the appropriate 3-sigma lower and upper control limits, (LCL,UCL)?A)(0.00667,0.00927)
B)(-0.02289,0.03883)
C)(0.13337,0.18527)
D)(0.00659,0.00935)
E)None of the above
Unlock Deck
Unlock for access to all 86 flashcards in this deck.
Unlock Deck
k this deck
56
Piston rings for an automotive engine are produced by a forging process.We monitor the inside diameter of the rings manufactured by this process using an and an s control chart.Samples of size 4 are taken at regular intervals,and the sample means and standard deviations are computed and plotted on the charts in time order.The overall mean of the sample means is 73.812 millimeters,and the mean of the sample standard deviations is 0.022 millimeters.The control chart constants are (partially)reproduced below. What is the value of the center line of the s chart?
A)0 millimeters
B)0.020 millimeters
C)0.022 millimeters
D)0.046 millimeters
and an s control chart.Samples of size 4 are taken at regular intervals,and the sample means and standard deviations are computed and plotted on the charts in time order.The overall mean of the sample means is 73.812 millimeters,and the mean of the sample standard deviations is 0.022 millimeters.The control chart constants are (partially)reproduced below. What is the value of the center line of the s chart?A)0 millimeters
B)0.020 millimeters
C)0.022 millimeters
D)0.046 millimeters
Unlock Deck
Unlock for access to all 86 flashcards in this deck.
Unlock Deck
k this deck
57
An important characteristic in the proper operation of ignition keys for automobiles is the groove width of the key.In a large manufacturing plant that produces thousands of keys,control charts have been established to monitor the process of cutting the groove.It is believed that the measurement (in inches)of the groove width is Normally distributed.Over a period of time,20 samples,each of size n = 5,were selected in order to establish 3-sigma and s charts.From these samples the following were determined: = 0.15932 and
= 0.0193438.Examination of the chart and the s chart for the samples led to the conclusion that the process was in control at this time.What,then,are the estimates of the process mean,,and process standard deviation,?
A)
= 0.00797;
= 0.000967
B)
= 0.00797;
= 0.019344
C)
= 0.15932;
= 0.020578
D)
= 0.15932;
= 0.001029
E)
= 0.00797;
= 0.001029
and s charts.From these samples the following were determined: = 0.15932 and = 0.0193438.Examination of the
chart and the s chart for the samples led to the conclusion that the process was in control at this time.What,then,are the estimates of the process mean,,and process standard deviation,?A)
= 0.00797;
= 0.000967
B)
= 0.00797;
= 0.019344
C)
= 0.15932;
= 0.020578
D)
= 0.15932;
= 0.001029
E)
= 0.00797;
= 0.001029
Unlock Deck
Unlock for access to all 86 flashcards in this deck.
Unlock Deck
k this deck
58
The 68-95-99.7 rule tells us that if a process with mean and standard deviation varies according to a Normal distribution,then almost all measurements on individual products will lie in the range ± 3.What do we call the values - 3 and + 3?
A)The control limits
B)The confidence limits
C)The natural tolerances
D)The capability limits
A)The control limits
B)The confidence limits
C)The natural tolerances
D)The capability limits
Unlock Deck
Unlock for access to all 86 flashcards in this deck.
Unlock Deck
k this deck
59
Piston rings for an automotive engine are produced by a forging process.We monitor the inside diameter of the rings manufactured by this process using an and an s control chart.Samples of size 4 are taken at regular intervals,and the sample means and standard deviations are computed and plotted on the charts in time order.The overall mean of the sample means is 73.812 millimeters,and the mean of the sample standard deviations is 0.022 millimeters.The control chart constants are (partially)reproduced below. What is the lower control limit for the s chart?
A)-0.066 millimeters
B)0 millimeters
C)0.020 millimeters
D)0.022 millimeters
and an s control chart.Samples of size 4 are taken at regular intervals,and the sample means and standard deviations are computed and plotted on the charts in time order.The overall mean of the sample means is 73.812 millimeters,and the mean of the sample standard deviations is 0.022 millimeters.The control chart constants are (partially)reproduced below. What is the lower control limit for the s chart?A)-0.066 millimeters
B)0 millimeters
C)0.020 millimeters
D)0.022 millimeters
Unlock Deck
Unlock for access to all 86 flashcards in this deck.
Unlock Deck
k this deck
60
What is the definition of rational subgroups?
A)They are those parts of a process that are identified as most likely to be special causes.
B)They are samples chosen to reflect only item-to-item variation in a process.
C)They are those samples in an s chart that are in control.
D)They are the specific groups of charts that we use to monitor a process.
Unlock Deck
Unlock for access to all 86 flashcards in this deck.
Unlock Deck
k this deck
61
A p chart is a control chart based on plotting ____________.
A)sample means
B)sample proportions
C)sample ranges
D)None of the above
A)sample means
B)sample proportions
C)sample ranges
D)None of the above
Unlock Deck
Unlock for access to all 86 flashcards in this deck.
Unlock Deck
k this deck
62
Suppose you are the owner of a new boutique hotel.It generally takes your staff 4 minutes with a standard deviation of 0.5 minute to check guests into their rooms.Currently the process is stable;however it is your goal to be able to check guests in within 3 minutes of their arrival.What is the value of Cpk?
A)0
B)1
C)This cannot be determined from the information given.
D)None of the above
A)0
B)1
C)This cannot be determined from the information given.
D)None of the above
Unlock Deck
Unlock for access to all 86 flashcards in this deck.
Unlock Deck
k this deck
63
At the start of the semester,a professor wants to monitor students who miss class.The professor implements a new attendance policy geared toward encouraging students to attend class every day.There are currently 150 registered students in the class,and each day the class takes a quiz that is just used to measure attendance.The number of quizzes that are turned in will serve as the measure of attendance.The quizzes are given at every class period and the class meets four times per week over a 15-week semester.What is the value of the UCL?
A)Less than .5
B)Between .5 and .8
C)Greater than .8
D)None of the above
A)Less than .5
B)Between .5 and .8
C)Greater than .8
D)None of the above
Unlock Deck
Unlock for access to all 86 flashcards in this deck.
Unlock Deck
k this deck
64
At the start of the semester,a professor wants to monitor students who miss class.The professor implements a new attendance policy geared toward encouraging students to attend class every day.There are currently 150 registered students in the class,and each day the class takes a quiz that is just used to measure attendance.The number of quizzes that are turned in will serve as the measure of attendance.The quizzes are given at every class period and the class meets four times per week over a 15-week semester.How many person-days are there for this process?
A)150 × 4
B)150 × 15
C)150 × 4 × 15
D)None of the above
A)150 × 4
B)150 × 15
C)150 × 4 × 15
D)None of the above
Unlock Deck
Unlock for access to all 86 flashcards in this deck.
Unlock Deck
k this deck
65
Piston rings for an automotive engine are produced by a forging process.We monitor the inside diameter of the rings manufactured by this process using an and an s control chart.Samples of size 4 are taken at regular intervals,and the sample means and standard deviations are computed and plotted on the charts in time order.The overall mean of the sample means is = 73.97 millimeters,and the sample standard deviation of all measurements is s = 0.03 millimeters.Specifications call for the inside diameter of the rings to be 74.00 ± 0.10 millimeters.The control chart constants are (partially)reproduced below. What is the value of an estimate of the capability index Cpk?
A)0.72
B)0.78
C)1.02
D)1.11
and an s control chart.Samples of size 4 are taken at regular intervals,and the sample means and standard deviations are computed and plotted on the charts in time order.The overall mean of the sample means is = 73.97 millimeters,and the sample standard deviation of all measurements is s = 0.03 millimeters.Specifications call for the inside diameter of the rings to be 74.00 ± 0.10 millimeters.The control chart constants are (partially)reproduced below. What is the value of an estimate of the capability index Cpk?A)0.72
B)0.78
C)1.02
D)1.11
Unlock Deck
Unlock for access to all 86 flashcards in this deck.
Unlock Deck
k this deck
66
At the start of the semester,a professor wants to monitor students who miss class.The professor implements a new attendance policy geared toward encouraging students to attend class every day.There are currently 150 registered students in the class,and each day the class takes a quiz that is just used to measure attendance.The number of quizzes that are turned in will serve as the measure of attendance.The quizzes are given at every class period and the class meets four times per week over a 15-week semester.Suppose there were a total of 510 absences throughout this process.What is the average daily proportion absent?
A).06
B).85
C).23
D)None of the above
A).06
B).85
C).23
D)None of the above
Unlock Deck
Unlock for access to all 86 flashcards in this deck.
Unlock Deck
k this deck
67
A control chart on a process characteristic has been shown to be in control.It has been determined that the process characteristic is approximately Normally distributed with an estimated mean = 36.5 and standard deviation
= 1.25.The customer has indicated that the output from the process is acceptable if the measured characteristic is between a lower specification limit of 30 and an upper specification limit of 40.What are the estimated values of and ,respectively,for this process output?
A)
= 1.33 and
= 1.73
B)
= 1.33 and
= 0.93
C)
= 1.33 and
= 1.33
D)
= 0.87 and
= 0.93
E)
= 0.87 and
= 1.73
= 36.5 and standard deviation = 1.25.The customer has indicated that the output from the process is acceptable if the measured characteristic is between a lower specification limit of 30 and an upper specification limit of 40.What are the estimated values of
and ,respectively,for this process output?A)
= 1.33 and
= 1.73
B)
= 1.33 and
= 0.93
C)
= 1.33 and
= 1.33
D)
= 0.87 and
= 0.93
E)
= 0.87 and
= 1.73
Unlock Deck
Unlock for access to all 86 flashcards in this deck.
Unlock Deck
k this deck
68
Cp and Cpk are very useful whether or not the measurements on the process outputs come from an approximately Normal distribution.
Unlock Deck
Unlock for access to all 86 flashcards in this deck.
Unlock Deck
k this deck
69
Parts manufactured by an injection molding process are subjected to a compressive strength test.We monitor the compressive strength of the parts manufactured by this process using an and an s control chart.Samples of size 9 are taken at regular intervals,and their mean compressive strength (in psi = pounds per square inch)and standard deviation are plotted on the charts in time order.The overall mean of the sample means is = 81.2 psi,and the sample standard deviation of all measurements is s = 3.0 psi.Specifications call for the compressive strength of parts to be 80 ± 2.5 psi.The control chart constants are (partially)reproduced below. What is the value of an estimate of the capability index Cp?
A)0.140
B)0.144
C)0.269
D)0.278
and an s control chart.Samples of size 9 are taken at regular intervals,and their mean compressive strength (in psi = pounds per square inch)and standard deviation are plotted on the charts in time order.The overall mean of the sample means is = 81.2 psi,and the sample standard deviation of all measurements is s = 3.0 psi.Specifications call for the compressive strength of parts to be 80 ± 2.5 psi.The control chart constants are (partially)reproduced below. What is the value of an estimate of the capability index Cp?A)0.140
B)0.144
C)0.269
D)0.278
Unlock Deck
Unlock for access to all 86 flashcards in this deck.
Unlock Deck
k this deck
70
Which of the following is TRUE of the capability index Cpk?
A)It is very robust to departures from Normality.
B)It is not affected by how we estimate the process standard deviation.
C)It is subject to virtually no sampling variability.
D)None of the above
A)It is very robust to departures from Normality.
B)It is not affected by how we estimate the process standard deviation.
C)It is subject to virtually no sampling variability.
D)None of the above
Unlock Deck
Unlock for access to all 86 flashcards in this deck.
Unlock Deck
k this deck
71
At the start of the semester,a professor wants to monitor students who miss class.The professor implements a new attendance policy geared toward encouraging students to attend class every day.There are currently 150 registered students in the class,and each day the class takes a quiz that is just used to measure attendance.The number of quizzes that are turned in will serve as the measure of attendance.The quizzes are given at every class period and the class meets four times per week over a 15-week semester.What is the value of the LCL?
A)Less than .5
B)Between .5 and .8
C)Greater than .8
D)None of the above
A)Less than .5
B)Between .5 and .8
C)Greater than .8
D)None of the above
Unlock Deck
Unlock for access to all 86 flashcards in this deck.
Unlock Deck
k this deck
72
Parts manufactured by an injection molding process are subjected to a compressive strength test.We monitor the compressive strength of the parts manufactured by this process using an and an s control chart.Samples of size 9 are taken at regular intervals,and their mean compressive strength (in psi = pounds per square inch)and standard deviation are plotted on the charts in time order.The overall mean of the sample means is = 81.2 psi,and the sample standard deviation of all measurements is s = 3.0 psi.Specifications call for the compressive strength of parts to be 80 ± 2.5 psi.The control chart constants are (partially)reproduced below. What is the value of an estimate of the capability index Cpk?
A)0.140
B)0.144
C)0.269
D)0.278
and an s control chart.Samples of size 9 are taken at regular intervals,and their mean compressive strength (in psi = pounds per square inch)and standard deviation are plotted on the charts in time order.The overall mean of the sample means is = 81.2 psi,and the sample standard deviation of all measurements is s = 3.0 psi.Specifications call for the compressive strength of parts to be 80 ± 2.5 psi.The control chart constants are (partially)reproduced below. What is the value of an estimate of the capability index Cpk?A)0.140
B)0.144
C)0.269
D)0.278
Unlock Deck
Unlock for access to all 86 flashcards in this deck.
Unlock Deck
k this deck
73
The _______ the value of Cp or Cpk,the more _____ the process.
A)larger;capable
B)smaller;in control
C)smaller;capable
D)larger;out of control
A)larger;capable
B)smaller;in control
C)smaller;capable
D)larger;out of control
Unlock Deck
Unlock for access to all 86 flashcards in this deck.
Unlock Deck
k this deck
74
Cpk should be based on at least how many measurements?
A)1
B)10
C)50
D)100
A)1
B)10
C)50
D)100
Unlock Deck
Unlock for access to all 86 flashcards in this deck.
Unlock Deck
k this deck
75
Piston rings for an automotive engine are produced by a forging process.We monitor the inside diameter of the rings manufactured by this process using an and an s control chart.Samples of size 4 are taken at regular intervals,and the sample means and standard deviations are computed and plotted on the charts in time order.The overall mean of the sample means is
= 73.97 millimeters,and the sample standard deviation of all measurements is s = 0.03 millimeters.Specifications call for the inside diameter of the rings to be 74.00 ± 0.10 millimeters.The control chart constants are (partially)reproduced below. What is the value of an estimate of the capability index Cp?
A)0.72
B)0.78
C)1.02
D)1.11
and an s control chart.Samples of size 4 are taken at regular intervals,and the sample means and standard deviations are computed and plotted on the charts in time order.The overall mean of the sample means is = 73.97 millimeters,and the sample standard deviation of all measurements is s = 0.03 millimeters.Specifications call for the inside diameter of the rings to be 74.00 ± 0.10 millimeters.The control chart constants are (partially)reproduced below.
What is the value of an estimate of the capability index Cp?A)0.72
B)0.78
C)1.02
D)1.11
Unlock Deck
Unlock for access to all 86 flashcards in this deck.
Unlock Deck
k this deck
76
Under what circumstances will the process capability indexes and be equal?
A)They will be equal when the process is in control.
B)They will be equal when the natural tolerance limits of the process are inside the specification limits.
C)They will be equal if the process mean is outside the specification limits.
D)They will be equal if the process mean is centered midway between the lower specification limit (LSL)and the upper specification limit (USL).
E)They will be never be equal because has 3 in the denominator but
has 6.
and be equal?A)They will be equal when the process is in control.
B)They will be equal when the natural tolerance limits of the process are inside the specification limits.
C)They will be equal if the process mean is outside the specification limits.
D)They will be equal if the process mean is centered midway between the lower specification limit (LSL)and the upper specification limit (USL).
E)They will be never be equal because
has 3 in the denominator but has 6. Unlock Deck
Unlock for access to all 86 flashcards in this deck.
Unlock Deck
k this deck
77
Suppose you want to determine if offering students free flu shots has been useful in cutting down on the number students missing class due to illness.Each week during flu season you count the number of students out of the entire student body who report to the campus clinic with flu symptoms.Which chart would be useful in helping you monitor this process?
A)p chart
B) chart
C)R chart
D)None of the above
A)p chart
B)
chartC)R chart
D)None of the above
Unlock Deck
Unlock for access to all 86 flashcards in this deck.
Unlock Deck
k this deck
78
The capability index
can be very informative and useful even if the sample size is small.
can be very informative and useful even if the sample size is small.
Unlock Deck
Unlock for access to all 86 flashcards in this deck.
Unlock Deck
k this deck
79
Suppose you are the owner of a new boutique hotel.It generally takes your staff 4 minutes with a standard deviation of 0.5 minute to check guests into their rooms.Currently the process is stable;however it is your goal to be able to check guests in within 3 minutes of their arrival.What is the estimated value of Cp?
A)Less than 1
B)Greater than or equal to 1
C)This cannot be determined from the information given.
D)None of the above
A)Less than 1
B)Greater than or equal to 1
C)This cannot be determined from the information given.
D)None of the above
Unlock Deck
Unlock for access to all 86 flashcards in this deck.
Unlock Deck
k this deck
80
At the start of the semester,a professor wants to monitor students who miss class.The professor implements a new attendance policy geared toward encouraging students to attend class every day.There are currently 150 registered students in the class,and each day the class takes a quiz that is just used to measure attendance.The number of quizzes that are turned in will serve as the measure of attendance.The quizzes are given at every class period and the class meets four times per week over a 15-week semester.Would creating a single p chart be useful for this situation with all students and the number of days missed on the same chart?
A)Yes,the number of students registered in the course will remain the same from day to day and the students are taking the course from the same professor.
B)No,it may be better to divide students up by the TA who is assigned to assist with the grading of the quizzes and make separate control charts for each TA's group of students.
C)No,separate charts should be made for the male and female students.
D)None of the above are appropriate reasons.
Unlock Deck
Unlock for access to all 86 flashcards in this deck.
Unlock Deck
k this deck
Unlock Deck
Unlock for access to all 86 flashcards in this deck.


