Exam 17: Statistics for Quality: Control and Capability
Exam 1: Looking at Datadistributions127 Questions
Exam 2: Looking at Datarelationships48 Questions
Exam 3: Producing Data70 Questions
Exam 4: Probability: the Study of Randomness93 Questions
Exam 5: Sampling Distributions77 Questions
Exam 6: Introduction to Inference89 Questions
Exam 7: Inference for Means103 Questions
Exam 8: Inference for Proportions101 Questions
Exam 9: Inference for Categorical Data122 Questions
Exam 10: Inference for Regression91 Questions
Exam 11: Multiple Regression95 Questions
Exam 12: One-Way Analysis of Variance74 Questions
Exam 13: Two-Way Analysis of Variance53 Questions
Exam 14: Logistic Regression53 Questions
Exam 15: Nonparametric Tests57 Questions
Exam 16: Bootstrap Methods and Permutation Tests42 Questions
Exam 17: Statistics for Quality: Control and Capability86 Questions
Select questions type
An important characteristic in the proper operation of ignition keys for automobiles is the groove width of the key.In a large manufacturing plant that produces thousands of keys,control charts have been established to monitor the process of cutting the groove.It is believed that the measurement (in inches)of the groove width is Normally distributed.Over a period of time,20 samples,each of size n = 5,were selected in order to establish 3-sigma  and s charts.From these samples the following were determined:
  = 0.15932 and
  = 0.0193438.Examination of the
  chart and the s chart for the samples led to the conclusion that the process was in control at this time.Because this process is in a state of statistical control,we are able to predict what to expect in the finished product.What will be the natural tolerances for the grooves in the ignition keys?
Free
(Multiple Choice)
4.7/5  (34)
(34)
Correct Answer: Verified
B
Piston rings for an automotive engine are produced by a forging process.We monitor the inside diameter of the rings manufactured by this process using an  and an s control chart.Samples of size 4 are taken at regular intervals,and the sample means and standard deviations are computed and plotted on the charts in time order.The overall mean of the sample means is
  = 73.97 millimeters,and the sample standard deviation of all measurements is s = 0.03 millimeters.Specifications call for the inside diameter of the rings to be 74.00 ± 0.10 millimeters.The control chart constants are (partially)reproduced below.
 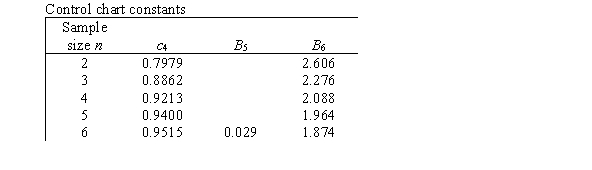 What is the value of an estimate of the capability index Cpk?
Free
(Multiple Choice)
4.9/5 (45)
Correct Answer:Verified
B
An automobile dealer checks on the quality of the service department by keeping a log of customer complaints and incidents of repeat service.Regular samples of 25 customers are taken,and based on these data the process proportion of customer complaints and incidences of repeat service is estimated to be  = 0.072.What would be the value of the center line for a p chart of future samples of size 25?
(Multiple Choice)
4.9/5 (41)
Piston rings for an automotive engine are produced by a forging process.We wish to monitor the inside diameter of the rings manufactured by this process using an  and an s control chart.Samples of size 4 are to be taken at regular intervals,and the sample means and standard deviations are computed and plotted on the charts in time order.The target values for the inside diameter are a mean of = 75 millimeters and a standard deviation of = 0.02 millimeters.The control chart constants are (partially)reproduced below.
  What is the lower control limit for the s chart?
(Multiple Choice)
4.9/5 (32)
Suppose you want to determine if offering students free flu shots has been useful in cutting down on the number students missing class due to illness.Each week during flu season you count the number of students out of the entire student body who report to the campus clinic with flu symptoms.Which chart would be useful in helping you monitor this process?
(Multiple Choice)
4.9/5 (37)
Which of the following is an example of a process that is in control but does not have capability?
(Multiple Choice)
4.9/5 (36)
When a process variable is Normally distributed,there are two important process characteristics that need to be monitored: the mean,,and the standard deviation,.Which control chart would be used to monitor the process spread?
(Multiple Choice)
4.7/5 (37)
Parts manufactured by an injection molding process are subjected to a compressive strength test.We wish to monitor the compressive strength of the parts manufactured by this process using both  and s charts.Samples of size 9 are to be taken at regular intervals,and their mean compressive strength (in psi = pounds per square inch)and standard deviation are plotted on the charts in time order.The target values for the compressive strengths are a mean of = 80 psi and a standard deviation of = 3 psi.The control chart constants are (partially)reproduced below.
 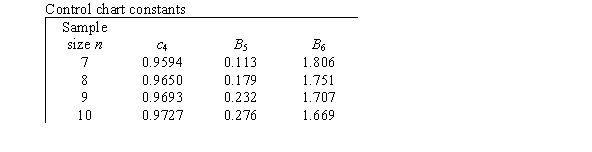 What is the lower control limit for the
  Chart?
(Multiple Choice)
4.9/5 (32)
The data below represent the means from 15 sample control charts for the amount of time in minutes it takes students to complete a quiz in a basic statistics course.The same quiz was given to 15 different sections of a basic statistics course.Five students were sampled from each class and each mean is shown below. 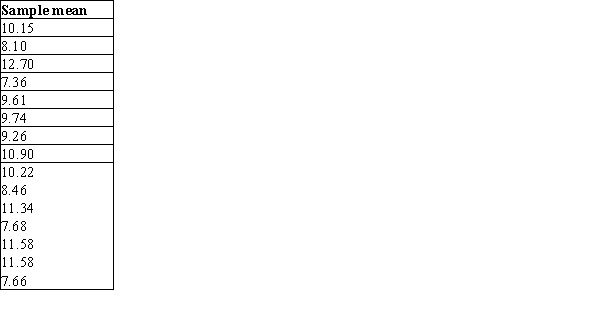 What is the approximate value of the center line for the correct control chart?
(Multiple Choice)
4.9/5 (32)
Parts manufactured by an injection molding process are subjected to a compressive strength test.We wish to monitor the compressive strength of the parts manufactured by this process using both  and s charts.Samples of size 9 are to be taken at regular intervals,and their mean compressive strength (in psi = pounds per square inch)and standard deviation are plotted on the charts in time order.The target values for the compressive strengths are a mean of = 80 psi and a standard deviation of = 3 psi.The control chart constants are (partially)reproduced below.
  What is the center line for the
  Chart?
(Multiple Choice)
4.9/5 (33)
Which of the following statements about special causes of variation is/are FALSE?
(Multiple Choice)
4.9/5 (36)
Piston rings for an automotive engine are produced by a forging process.We monitor the inside diameter of the rings manufactured by this process using an  and an s control chart.Samples of size 4 are taken at regular intervals,and the sample means and standard deviations are computed and plotted on the charts in time order.The overall mean of the sample means is 73.812 millimeters,and the mean of the sample standard deviations is 0.022 millimeters.The control chart constants are (partially)reproduced below.
  What value would we use for the center line of the
  chart?
(Multiple Choice)
4.8/5 (34)
Statistical stability means there is no variation in the variable measured.
(True/False)
4.9/5 (34)
Which rule will typically signal an out-of-control signal faster?
(Multiple Choice)
4.8/5 (35)
In an electronics company that produces transistors,1000 transistors are inspected at regular intervals.The proportion of nonconforming transistors produced by the process,estimated from data collected in a 1-month period,is  = 0.0026.What would be the value of the lower control limit for a p chart of future samples of size 1000?
(Multiple Choice)
4.8/5 (28)
Suppose you are the owner of a new boutique hotel.It generally takes your staff 4 minutes with a standard deviation of 0.5 minute to check guests into their rooms.Currently the process is stable;however it is your goal to be able to check guests in within 3 minutes of their arrival.What is the estimated value of Cp?
(Multiple Choice)
4.9/5 (28)
You drive to school every day.This can be viewed as a process.It takes you approximately 15 minutes to get from your apartment to school,but the exact time varies from day to day.Which of the following would be considered special cause variation?
(Multiple Choice)
4.9/5 (37)
Filters
- Essay(0)
- Multiple Choice(0)
- Short Answer(0)
- True False(0)
- Matching(0)