Deck 13: Two-Way Analysis of Variance
Full screen (f)
Question
A study was done to determine whether gender and type of student (graduate students or undergraduate)performed differently on a final exam in a statistics course.The mean scores of each group are shown below.  Create a profile plot.Does there appear to be any interactions?
A)Yes
B)No
Create a profile plot.Does there appear to be any interactions?A)Yes
B)No
Question
Question
Question
Which of the following are statements about a two-way ANOVA involving Factor A at I levels and Factor B at J levels is/are FALSE?
A)From each of the I × J populations we require independent SRSs of size .
.
B)The I × J population means differ,as do the variances,
 .
.
C)The variable measured in the I × J populations is Normally distributed.
D)The parameters of the two-way ANOVA model are the and.
and.
E)The statistical model for the two-way ANOVA is for i = 1,…,I,j = 1,…,J,and k = 1,…,
 .
.
A)From each of the I × J populations we require independent SRSs of size
.B)The I × J population means
differ,as do the variances, .C)The variable measured in the I × J populations is Normally distributed.
D)The parameters of the two-way ANOVA model are the
and.E)The statistical model for the two-way ANOVA is
for i = 1,…,I,j = 1,…,J,and k = 1,…, . Question
Question
Question
A study compares the average number of accidents by gender for three different age groups.The profile plot of the group means is shown below.  Based on this plot,does there seem to be a main effect for gender?
A)Yes
B)No
C)This cannot be determined from the information given.
Based on this plot,does there seem to be a main effect for gender?A)Yes
B)No
C)This cannot be determined from the information given.
Question
A study compares the average number of accidents by gender for three different age groups.The profile plot of the group means is shown below. 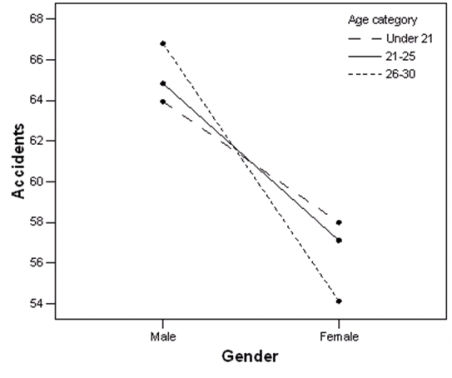 Based on this plot,does there seem to be an interaction effect between gender and age group?
A)Yes
B)No
C)This cannot be determined from the information given.
Based on this plot,does there seem to be an interaction effect between gender and age group?A)Yes
B)No
C)This cannot be determined from the information given.
Question
Question
A study compares the strength of a product between two different materials used to make the product and five different labs that created these products.The profile plot of the group means is shown below. 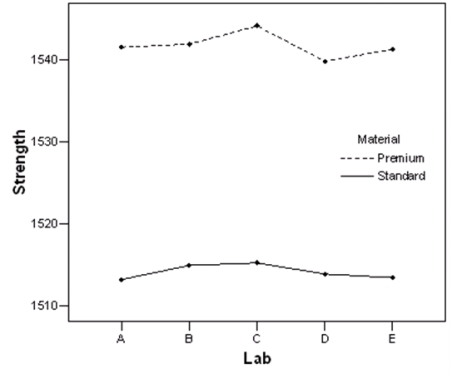 Based on this plot,does there seem to be an interaction effect between material and lab?
A)Yes
B)No
C)This cannot be determined from the information given.
Based on this plot,does there seem to be an interaction effect between material and lab?A)Yes
B)No
C)This cannot be determined from the information given.
Question
Question
Question
Question
Question
Question
Question
A study compares the strength of a product between two different materials used to make the product and five different labs that created these products.The profile plot of the group means is shown below.  Based on this plot,does there seem to be a main effect for material?
A)Yes
B)No
C)This cannot be determined from the information given.
Based on this plot,does there seem to be a main effect for material?A)Yes
B)No
C)This cannot be determined from the information given.
Question
Which of the plots below show a possible interaction?
A)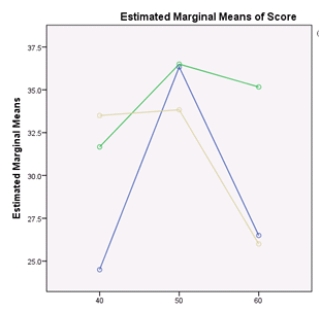
B)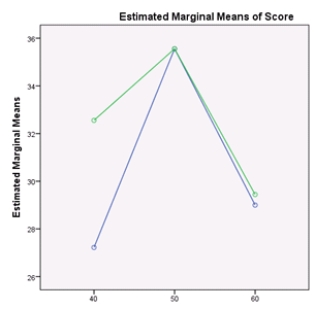
C)
D)All of the above
A)
B)
C)
D)All of the above
Question
A research project studied the physical properties of wood materials constructed by bonding together small flakes of wood.The two factors considered were the size of the flakes and species of tree.The sizes of the flakes were S1: 0.15 inches by 2 inches and S2: 0.25 inches by 2 inches,and the species of tree used were aspen,birch,and maple.For each combination of flake size and tree species,three samples of wood material were constructed.For each sample,the physical property measured was the tension modulus of elasticity in the direction perpendicular to the alignment of the flakes,in pounds per square inch (psi).The table below gives the means for the different size-species groups.  What are the marginal means for species?
A)387.33,292.67,and 323.33
B)335.67,455.33,and 293.67
C)723,748,and 617
D)361.50,374.00,and 308.50
What are the marginal means for species?A)387.33,292.67,and 323.33
B)335.67,455.33,and 293.67
C)723,748,and 617
D)361.50,374.00,and 308.50
Question
A study was done to determine whether gender and type of student (graduate students or undergraduate)performed differently on a final exam in a statistics course.The mean scores of each group are shown below.  What is the name of the two-way ANOVA needed for the analysis?
A)2 × 2 ANOVA
B)4 × 4 ANOVA
C)4 × 2 ANOVA
D)2 × 4 ANOVA
What is the name of the two-way ANOVA needed for the analysis?A)2 × 2 ANOVA
B)4 × 4 ANOVA
C)4 × 2 ANOVA
D)2 × 4 ANOVA
Question
A research project studied the physical properties of wood materials constructed by bonding together small flakes of wood.The two factors considered were the size of the flakes and species of tree.The sizes of the flakes were S1: 0.15 inches by 2 inches and S2: 0.25 inches by 2 inches,and the species of tree used were aspen,birch,and maple.For each combination of flake size and tree species,three samples of wood material were constructed.For each sample,the physical property measured was the tension modulus of elasticity in the direction perpendicular to the alignment of the flakes,in pounds per square inch (psi). The table below gives the means for the different size-species groups:  For these data,a two-way ANOVA was run and the partial ANOVA table is given below.
  What is the value of the F statistic for testing interaction?
A)0.59
B)1.70
C)3.40
D)202.33
For these data,a two-way ANOVA was run and the partial ANOVA table is given below. What is the value of the F statistic for testing interaction?A)0.59
B)1.70
C)3.40
D)202.33
Question
A researcher wished to compare the effect of the different rates of stepping on volunteers' heart rates in a step-aerobics workout.A collection of thirty adult volunteers,fifteen women and fifteen men,were selected from a local gym.The men were randomly divided into three groups of five subjects each.Each group did a standard step-aerobics workout,with Group 1 at a low rate of stepping,Group 2 at a medium rate of stepping,and Group 3 at a rapid rate.The women were also randomly divided into three groups of five subjects each.As with the men,each group did a standard step-aerobics workout,with Group 1 at a low rate of stepping,Group 2 at a medium rate of stepping,and Group 3 at a rapid rate.The mean heart rate at the end of the workout for all the subjects was determined in beats per minute. A partial ANOVA table for these data is given below.  If the data were analyzed as a one-way ANOVA with six "treatments" corresponding to the six combinations of stepping rate and gender,what would have been the sum of squares for error?
A)2623.9
B)2855.6
C)5762.0
D)8617.6
If the data were analyzed as a one-way ANOVA with six "treatments" corresponding to the six combinations of stepping rate and gender,what would have been the sum of squares for error?A)2623.9
B)2855.6
C)5762.0
D)8617.6
Question
Question
A researcher wished to compare the effect of the different rates of stepping on volunteers' heart rates in a step-aerobics workout.A collection of thirty adult volunteers,fifteen women and fifteen men,were selected from a local gym.The men were randomly divided into three groups of five subjects each.Each group did a standard step-aerobics workout,with Group 1 at a low rate of stepping,Group 2 at a medium rate of stepping,and Group 3 at a rapid rate.The women were also randomly divided into three groups of five subjects each.As with the men,each group did a standard step-aerobics workout,with Group 1 at a low rate of stepping,Group 2 at a medium rate of stepping,and Group 3 at a rapid rate.The mean heart rate at the end of the workout for all the subjects was determined in beats per minute. A partial ANOVA table for these data is given below.  What is the value of the degrees of freedom for interaction?
A)1
B)2
C)3
D)6
What is the value of the degrees of freedom for interaction?A)1
B)2
C)3
D)6
Question
A researcher wished to compare the effect of the different rates of stepping on volunteers' heart rates in a step-aerobics workout.A collection of thirty adult volunteers,fifteen women and fifteen men,were selected from a local gym.The men were randomly divided into three groups of five subjects each.Each group did a standard step-aerobics workout,with Group 1 at a low rate of stepping,Group 2 at a medium rate of stepping,and Group 3 at a rapid rate.The women were also randomly divided into three groups of five subjects each.As with the men,each group did a standard step-aerobics workout,with Group 1 at a low rate of stepping,Group 2 at a medium rate of stepping,and Group 3 at a rapid rate.The mean heart rate at the end of the workout for all the subjects was determined in beats per minute. A partial ANOVA table for these data is given below.  What are the factors in this experiment?
A)Rate of stepping and heart rate
B)Rate of stepping and gender
C)Heart rate and gender
D)Gym membership and gender
What are the factors in this experiment?A)Rate of stepping and heart rate
B)Rate of stepping and gender
C)Heart rate and gender
D)Gym membership and gender
Question
A study was done to determine how gender and stress level affect one's self-rated level of happiness on a scale of 1 to 10.The data are shown below. 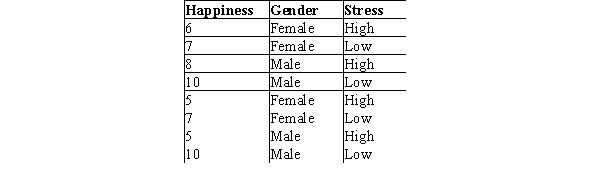 What is the P-value for the interaction effect? (Note: Assume all assumptions have been reasonably met. )
A)Less than or equal to .01
B)Between .02 and .05
C)Between .06 and .08
D)Greater than .09
What is the P-value for the interaction effect? (Note: Assume all assumptions have been reasonably met. )A)Less than or equal to .01
B)Between .02 and .05
C)Between .06 and .08
D)Greater than .09
Question
Question
A research project studied the physical properties of wood materials constructed by bonding together small flakes of wood.The two factors considered were the size of the flakes and species of tree.The sizes of the flakes were S1: 0.15 inches by 2 inches and S2: 0.25 inches by 2 inches,and the species of tree used were aspen,birch,and maple.For each combination of flake size and tree species,three samples of wood material were constructed.For each sample,the physical property measured was the tension modulus of elasticity in the direction perpendicular to the alignment of the flakes,in pounds per square inch (psi). The table below gives the means for the different size-species groups:  For these data,a two-way ANOVA was run and the partial ANOVA table is given below.
 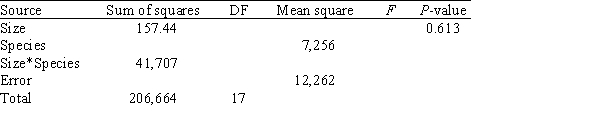 What is the value of the sum of squares for error,SSE?
A)1021.8
B)14,512.0
C)20,853.5
D)147,144.0
For these data,a two-way ANOVA was run and the partial ANOVA table is given below. What is the value of the sum of squares for error,SSE?A)1021.8
B)14,512.0
C)20,853.5
D)147,144.0
Question
A researcher wished to compare the effect of the different rates of stepping on volunteers' heart rates in a step-aerobics workout.A collection of thirty adult volunteers,fifteen women and fifteen men,were selected from a local gym.The men were randomly divided into three groups of five subjects each.Each group did a standard step-aerobics workout,with Group 1 at a low rate of stepping,Group 2 at a medium rate of stepping,and Group 3 at a rapid rate.The women were also randomly divided into three groups of five subjects each.As with the men,each group did a standard step-aerobics workout,with Group 1 at a low rate of stepping,Group 2 at a medium rate of stepping,and Group 3 at a rapid rate.The mean heart rate at the end of the workout for all the subjects was determined in beats per minute. A partial ANOVA table for these data is given below.  What is the value of the F statistic for testing the main effect of gender?
A)0.01
B)0.29
C)5.32
D)81.49
What is the value of the F statistic for testing the main effect of gender?A)0.01
B)0.29
C)5.32
D)81.49
Question
Question
Question
A study was done to determine how gender and stress level affect one's self-rated level of happiness on a scale of 1 to 10.The data are shown below.  What is the P-value for the main effect for stress? (Note: Include the interaction in your ANOVA model and assume all assumptions have been reasonably met. )
A)Less than or equal to .01
B)Between .02 and .05
C)Between .06 and .08
D)Greater than .09
What is the P-value for the main effect for stress? (Note: Include the interaction in your ANOVA model and assume all assumptions have been reasonably met. )A)Less than or equal to .01
B)Between .02 and .05
C)Between .06 and .08
D)Greater than .09
Question
Question
A researcher wished to compare the effect of the different rates of stepping on volunteers' heart rates in a step-aerobics workout.A collection of thirty adult volunteers,fifteen women and fifteen men,were selected from a local gym.The men were randomly divided into three groups of five subjects each.Each group did a standard step-aerobics workout,with Group 1 at a low rate of stepping,Group 2 at a medium rate of stepping,and Group 3 at a rapid rate.The women were also randomly divided into three groups of five subjects each.As with the men,each group did a standard step-aerobics workout,with Group 1 at a low rate of stepping,Group 2 at a medium rate of stepping,and Group 3 at a rapid rate.The mean heart rate at the end of the workout for all the subjects was determined in beats per minute. A partial ANOVA table for these data is given below.  What can we say about the P-value for the main effect of the stepping rate group?
A)P-value < 0.01
B)0.01C)0.05 D)P-value > 0.10
What can we say about the P-value for the main effect of the stepping rate group?A)P-value < 0.01
B)0.01
Question
A research project studied the physical properties of wood materials constructed by bonding together small flakes of wood.The two factors considered were the size of the flakes and species of tree.The sizes of the flakes were S1: 0.15 inches by 2 inches and S2: 0.25 inches by 2 inches,and the species of tree used were aspen,birch,and maple.For each combination of flake size and tree species,three samples of wood material were constructed.For each sample,the physical property measured was the tension modulus of elasticity in the direction perpendicular to the alignment of the flakes,in pounds per square inch (psi). The table below gives the means for the different size-species groups:  For these data,a two-way ANOVA was run and the partial ANOVA table is given below.
  In the ANOVA table,the test for the main effect of size has a P-value of 0.613.What does this indicate?
A)The effect of particle size probably varies considerably for the different species.
B)For about 61.3% of the samples,there was a difference in the effect of particle size.
C)For about 61.3% of the samples,there was no difference in the effect of particle size.
D)None of the above
For these data,a two-way ANOVA was run and the partial ANOVA table is given below. In the ANOVA table,the test for the main effect of size has a P-value of 0.613.What does this indicate?A)The effect of particle size probably varies considerably for the different species.
B)For about 61.3% of the samples,there was a difference in the effect of particle size.
C)For about 61.3% of the samples,there was no difference in the effect of particle size.
D)None of the above
Question
A study was done to determine how gender and stress level affect one's self-rated level of happiness on a scale of 1 to 10.The data are shown below.  What is the P-value for the main effect for gender? (Note: Include the interaction in your ANOVA model and assume all assumptions have been reasonably met. )
A)Less than or equal to .01
B)Between .02 and .05
C)Between .06 and .08
D)Greater than .09
What is the P-value for the main effect for gender? (Note: Include the interaction in your ANOVA model and assume all assumptions have been reasonably met. )A)Less than or equal to .01
B)Between .02 and .05
C)Between .06 and .08
D)Greater than .09
Question
A research project studied the physical properties of wood materials constructed by bonding together small flakes of wood.The two factors considered were the size of the flakes and species of tree.The sizes of the flakes were S1: 0.15 inches by 2 inches and S2: 0.25 inches by 2 inches,and the species of tree used were aspen,birch,and maple.For each combination of flake size and tree species,three samples of wood material were constructed.For each sample,the physical property measured was the tension modulus of elasticity in the direction perpendicular to the alignment of the flakes,in pounds per square inch (psi). The table below gives the means for the different size-species groups:  For these data,a two-way ANOVA was run and the partial ANOVA table is given below.
  What is the value of the degrees of freedom for the model,DFM?
A)1
B)2
C)5
D)6
For these data,a two-way ANOVA was run and the partial ANOVA table is given below. What is the value of the degrees of freedom for the model,DFM?A)1
B)2
C)5
D)6
Question
A researcher wished to compare the effect of the different rates of stepping on volunteers' heart rates in a step-aerobics workout.A collection of thirty adult volunteers,fifteen women and fifteen men,were selected from a local gym.The men were randomly divided into three groups of five subjects each.Each group did a standard step-aerobics workout,with Group 1 at a low rate of stepping,Group 2 at a medium rate of stepping,and Group 3 at a rapid rate.The women were also randomly divided into three groups of five subjects each.As with the men,each group did a standard step-aerobics workout,with Group 1 at a low rate of stepping,Group 2 at a medium rate of stepping,and Group 3 at a rapid rate.The mean heart rate at the end of the workout for all the subjects was determined in beats per minute. A partial ANOVA table for these data is given below.  What is the value of the degrees of freedom for error?
A)5
B)11
C)24
D)29
What is the value of the degrees of freedom for error?A)5
B)11
C)24
D)29
Question
A study was done to determine whether gender and type of student (graduate students or undergraduate)performed differently on a final exam in a statistics course.The mean scores of each group are shown below.  Create a profile plot.Based on the profile plot,which main effect appears to be the largest?
A)Gender
B)Student
Create a profile plot.Based on the profile plot,which main effect appears to be the largest?A)Gender
B)Student
Question
A researcher wished to compare the effect of the different rates of stepping on volunteers' heart rates in a step-aerobics workout.A collection of thirty adult volunteers,fifteen women and fifteen men,were selected from a local gym.The men were randomly divided into three groups of five subjects each.Each group did a standard step-aerobics workout,with Group 1 at a low rate of stepping,Group 2 at a medium rate of stepping,and Group 3 at a rapid rate.The women were also randomly divided into three groups of five subjects each.As with the men,each group did a standard step-aerobics workout,with Group 1 at a low rate of stepping,Group 2 at a medium rate of stepping,and Group 3 at a rapid rate.The mean heart rate at the end of the workout for all the subjects was determined in beats per minute. A partial ANOVA table for these data is given below.  What are the advantages of studying the two factors simultaneously in the same experiment?
A)It is more efficient to study two factors simultaneously rather than separately.
B)We can reduce the residual variation in a model by including a second factor thought to influence the response.
C)We can investigate the interaction between factors.
D)All of the above
What are the advantages of studying the two factors simultaneously in the same experiment?A)It is more efficient to study two factors simultaneously rather than separately.
B)We can reduce the residual variation in a model by including a second factor thought to influence the response.
C)We can investigate the interaction between factors.
D)All of the above
Question
Question
Question
Question
Question
Consider the following graphic results from a two-way ANOVA.These results show _________. 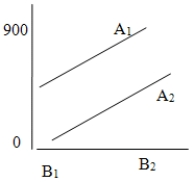
A)no significant main effects or interaction effects.
B)a possible significant main effect for factor A and factor B.
C)a significant interaction effect but no other significant effects.
D)a possible significant main effect for factor A but no other significant effects.
E)a possible significant main effect for factor B but no other significant effects.
Question
Consider a two-way ANOVA in which Factor A is at four levels,Factor B has three levels,and there are four observations in each cell.Which of the following are TRUE statements about the ANOVA in this situation?
A)The A × B interaction has 6 degrees of freedom.
B)The ANOVA total sum of squares has 47 degrees of freedom.
C)The mean square for error is given by .
.
D)To test the A × B interaction,you would use the F statistic,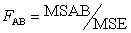 .
.
E)With the exception of B,all of the above are true statements.
A)The A × B interaction has 6 degrees of freedom.
B)The ANOVA total sum of squares has 47 degrees of freedom.
C)The mean square for error is given by
.D)To test the A × B interaction,you would use the F statistic,
.E)With the exception of B,all of the above are true statements.
Question
Question
Question
Consider the following graphic results from a two-way ANOVA.These results show __________. 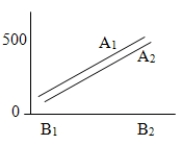
A)no significant main effects or interaction effects.
B)a possible significant main effect for factor A and no other significant effects.
C)a possible significant main effect for factor B and no other significant effects.
D)a significant interaction effect and no other significant effects.
A)no significant main effects or interaction effects.
B)a possible significant main effect for factor A and no other significant effects.
C)a possible significant main effect for factor B and no other significant effects.
D)a significant interaction effect and no other significant effects.
Question
Question
Question
Question
A researcher wished to compare the effect of the different rates of stepping on volunteers' heart rates in a step-aerobics workout.A collection of thirty adult volunteers,fifteen women and fifteen men,were selected from a local gym.The men were randomly divided into three groups of five subjects each.Each group did a standard step-aerobics workout,with Group 1 at a low rate of stepping,Group 2 at a medium rate of stepping,and Group 3 at a rapid rate.The women were also randomly divided into three groups of five subjects each.As with the men,each group did a standard step-aerobics workout,with Group 1 at a low rate of stepping,Group 2 at a medium rate of stepping,and Group 3 at a rapid rate.The mean heart rate at the end of the workout for all the subjects was determined in beats per minute. A partial ANOVA table for these data is given below.  The profile plot and the P-value for the test for interaction show little evidence of interaction.What can we conclude?
A)There is little difference in the heart rates of men and women.
B)The change in heart rate due to different stepping rates is similar for men and women.
C)Changes in stepping rate are positively associated with heart rate.
D)Step exercise is equally beneficial to men and women.
The profile plot and the P-value for the test for interaction show little evidence of interaction.What can we conclude?A)There is little difference in the heart rates of men and women.
B)The change in heart rate due to different stepping rates is similar for men and women.
C)Changes in stepping rate are positively associated with heart rate.
D)Step exercise is equally beneficial to men and women.

Unlock Deck
Sign up to unlock the cards in this deck!
Unlock Deck
Unlock Deck
1/53
Play
Full screen (f)
Deck 13: Two-Way Analysis of Variance
1
A study was done to determine whether gender and type of student (graduate students or undergraduate)performed differently on a final exam in a statistics course.The mean scores of each group are shown below. Create a profile plot.Does there appear to be any interactions?
A)Yes
B)No
Create a profile plot.Does there appear to be any interactions?A)Yes
B)No
Yes
2
Which of the following statements about a two-way analysis of variance model is/are TRUE?
A)The population of interest is classified according to two categorical variables,or factors.
B)An experiment involving the simultaneous use of two factors offers advantages over two one-way experiments with respect to such matters as efficiency and reduction of residual variation.
C)The two-way type of experiment requires twice as many experimental observations as would be required in two one-way experiments of the same factors.
D)An experiment involving the simultaneous study of two factors allows for the investigation of interactions between the factors.
E)Only A,B,and D are true.
Only A,B,and D are true.
3
In a two-way ANOVA,both factors must have the same number of levels.
False
4
Which of the following are statements about a two-way ANOVA involving Factor A at I levels and Factor B at J levels is/are FALSE?
A)From each of the I × J populations we require independent SRSs of size .
B)The I × J population means differ,as do the variances,
.
C)The variable measured in the I × J populations is Normally distributed.
D)The parameters of the two-way ANOVA model are the and.
E)The statistical model for the two-way ANOVA is for i = 1,…,I,j = 1,…,J,and k = 1,…,
.
A)From each of the I × J populations we require independent SRSs of size
.B)The I × J population means
differ,as do the variances, .C)The variable measured in the I × J populations is Normally distributed.
D)The parameters of the two-way ANOVA model are the
and.E)The statistical model for the two-way ANOVA is
for i = 1,…,I,j = 1,…,J,and k = 1,…, . Unlock Deck
Unlock for access to all 53 flashcards in this deck.
Unlock Deck
k this deck
5
In a study comparing four levels of Factor A and two levels of Factor B,with six observations in each cell,the SSE = 3456 and the SSA = 364.What is the value of the F statistic that is used to test for the main effect of Factor A?
A)1.05
B)1.26
C)1.40
D)4.21
A)1.05
B)1.26
C)1.40
D)4.21
Unlock Deck
Unlock for access to all 53 flashcards in this deck.
Unlock Deck
k this deck
6
Which of the following statements about the two-way ANOVA is/are FALSE?
A)A two-wayANOVA is used when there are two outcome variables.
B)In a 3 × 3 ANOVA each level of Factor A appears with only two levels of Factor B.
C)The two-way ANOVA can only be used when the samples sizes are the same in all cells.
D)The presence of interactions always tells us that the main effects are uninformative.
E)All of the above are false.
Unlock Deck
Unlock for access to all 53 flashcards in this deck.
Unlock Deck
k this deck
7
A study compares the average number of accidents by gender for three different age groups.The profile plot of the group means is shown below. Based on this plot,does there seem to be a main effect for gender?
A)Yes
B)No
C)This cannot be determined from the information given.
Based on this plot,does there seem to be a main effect for gender?A)Yes
B)No
C)This cannot be determined from the information given.
Unlock Deck
Unlock for access to all 53 flashcards in this deck.
Unlock Deck
k this deck
8
A study compares the average number of accidents by gender for three different age groups.The profile plot of the group means is shown below. Based on this plot,does there seem to be an interaction effect between gender and age group?
A)Yes
B)No
C)This cannot be determined from the information given.
Based on this plot,does there seem to be an interaction effect between gender and age group?A)Yes
B)No
C)This cannot be determined from the information given.
Unlock Deck
Unlock for access to all 53 flashcards in this deck.
Unlock Deck
k this deck
9
Plots that show graphs of the marginal means of each factor at every level are called _______.
A)profile plots
B)box plots
C)contour plots
D)factor plots
A)profile plots
B)box plots
C)contour plots
D)factor plots
Unlock Deck
Unlock for access to all 53 flashcards in this deck.
Unlock Deck
k this deck
10
A study compares the strength of a product between two different materials used to make the product and five different labs that created these products.The profile plot of the group means is shown below. Based on this plot,does there seem to be an interaction effect between material and lab?
A)Yes
B)No
C)This cannot be determined from the information given.
Based on this plot,does there seem to be an interaction effect between material and lab?A)Yes
B)No
C)This cannot be determined from the information given.
Unlock Deck
Unlock for access to all 53 flashcards in this deck.
Unlock Deck
k this deck
11
A study compares three levels of Factor A and four levels of Factor B,with seven observations in each cell.What are the degrees of freedom for the F statistic that is used to test for the main effect of Factor B?
A)3 and 36
B)3 and 72
C)4 and 72
D)4 and 84
A)3 and 36
B)3 and 72
C)4 and 72
D)4 and 84
Unlock Deck
Unlock for access to all 53 flashcards in this deck.
Unlock Deck
k this deck
12
A study compares three levels of Factor A and four levels of Factor B,with three observations in each group.An F statistic of 5.113 is reported for the main effect of Factor A.What can we say about the P-value for this F test?
A)P-value < 0.01
B)0.01C)0.025 D)P-value > 0.05
A)P-value < 0.01
B)0.01
Unlock Deck
Unlock for access to all 53 flashcards in this deck.
Unlock Deck
k this deck
13
With which of the following research questions could you use a two-way ANOVA model for the analysis?
A)Is your score on the midterm exam a good predictor of your score on the final exam?
B)Do your level of stress (high or low)and level of close friendships (several close friends or few close friends)effect the number of days you are sick each year?
C)Does the number of days you exercise per week effect your weight lose?
D)Do your favorite color (red,green,blue,or pink)and your weight (overweight,underweight,or appropriate weight)determine whether your first child will be a boy or girl?
Unlock Deck
Unlock for access to all 53 flashcards in this deck.
Unlock Deck
k this deck
14
A study compares three levels of Factor A and two levels of Factor B,with five observations in each cell.What are the degrees of freedom for the F statistic that is used to test for interaction?
A)2 and 24
B)3 and 30
C)5 and 6
D)6 and 24
A)2 and 24
B)3 and 30
C)5 and 6
D)6 and 24
Unlock Deck
Unlock for access to all 53 flashcards in this deck.
Unlock Deck
k this deck
15
A research project studied the physical properties of wood materials constructed by bonding together small flakes of wood.The two factors considered were the size of the flakes and species of tree.The sizes of the flakes were S1: 0.15 inches by 2 inches and S2: 0.25 inches by 2 inches,and the species of tree used were aspen,birch,and maple.For each combination of flake size and tree species,three samples of wood material were constructed.For each sample,the physical property measured was the tension modulus of elasticity in the direction perpendicular to the alignment of the flakes,in pounds per square inch (psi).Which statement best describes the type of experiment being run?
A)This is a two-factor experiment.Each factor is at three levels.
B)This is a six-level experiment.Each level has three observations.
C)This is a two-factor experiment.One factor is at two levels,and the other factor is at three levels.
D)None of the above
A)This is a two-factor experiment.Each factor is at three levels.
B)This is a six-level experiment.Each level has three observations.
C)This is a two-factor experiment.One factor is at two levels,and the other factor is at three levels.
D)None of the above
Unlock Deck
Unlock for access to all 53 flashcards in this deck.
Unlock Deck
k this deck
16
A study compares two levels of Factor A and four levels of Factor B,with four observations in each cell.How large does the F statistic need to be for rejecting the null hypothesis that no interaction is present between the two factors at the 5% significance level?
A)2.33
B)2.78
C)2.92
D)3.01
A)2.33
B)2.78
C)2.92
D)3.01
Unlock Deck
Unlock for access to all 53 flashcards in this deck.
Unlock Deck
k this deck
17
A study compares the strength of a product between two different materials used to make the product and five different labs that created these products.The profile plot of the group means is shown below. Based on this plot,does there seem to be a main effect for material?
A)Yes
B)No
C)This cannot be determined from the information given.
Based on this plot,does there seem to be a main effect for material?A)Yes
B)No
C)This cannot be determined from the information given.
Unlock Deck
Unlock for access to all 53 flashcards in this deck.
Unlock Deck
k this deck
18
Which of the plots below show a possible interaction?
A)
B)
C)
D)All of the above
A)
B)
C)
D)All of the above
Unlock Deck
Unlock for access to all 53 flashcards in this deck.
Unlock Deck
k this deck
19
A research project studied the physical properties of wood materials constructed by bonding together small flakes of wood.The two factors considered were the size of the flakes and species of tree.The sizes of the flakes were S1: 0.15 inches by 2 inches and S2: 0.25 inches by 2 inches,and the species of tree used were aspen,birch,and maple.For each combination of flake size and tree species,three samples of wood material were constructed.For each sample,the physical property measured was the tension modulus of elasticity in the direction perpendicular to the alignment of the flakes,in pounds per square inch (psi).The table below gives the means for the different size-species groups. What are the marginal means for species?
A)387.33,292.67,and 323.33
B)335.67,455.33,and 293.67
C)723,748,and 617
D)361.50,374.00,and 308.50
What are the marginal means for species?A)387.33,292.67,and 323.33
B)335.67,455.33,and 293.67
C)723,748,and 617
D)361.50,374.00,and 308.50
Unlock Deck
Unlock for access to all 53 flashcards in this deck.
Unlock Deck
k this deck
20
A study was done to determine whether gender and type of student (graduate students or undergraduate)performed differently on a final exam in a statistics course.The mean scores of each group are shown below. What is the name of the two-way ANOVA needed for the analysis?
A)2 × 2 ANOVA
B)4 × 4 ANOVA
C)4 × 2 ANOVA
D)2 × 4 ANOVA
What is the name of the two-way ANOVA needed for the analysis?A)2 × 2 ANOVA
B)4 × 4 ANOVA
C)4 × 2 ANOVA
D)2 × 4 ANOVA
Unlock Deck
Unlock for access to all 53 flashcards in this deck.
Unlock Deck
k this deck
21
A research project studied the physical properties of wood materials constructed by bonding together small flakes of wood.The two factors considered were the size of the flakes and species of tree.The sizes of the flakes were S1: 0.15 inches by 2 inches and S2: 0.25 inches by 2 inches,and the species of tree used were aspen,birch,and maple.For each combination of flake size and tree species,three samples of wood material were constructed.For each sample,the physical property measured was the tension modulus of elasticity in the direction perpendicular to the alignment of the flakes,in pounds per square inch (psi). The table below gives the means for the different size-species groups: For these data,a two-way ANOVA was run and the partial ANOVA table is given below. What is the value of the F statistic for testing interaction?
A)0.59
B)1.70
C)3.40
D)202.33
For these data,a two-way ANOVA was run and the partial ANOVA table is given below. What is the value of the F statistic for testing interaction?A)0.59
B)1.70
C)3.40
D)202.33
Unlock Deck
Unlock for access to all 53 flashcards in this deck.
Unlock Deck
k this deck
22
A researcher wished to compare the effect of the different rates of stepping on volunteers' heart rates in a step-aerobics workout.A collection of thirty adult volunteers,fifteen women and fifteen men,were selected from a local gym.The men were randomly divided into three groups of five subjects each.Each group did a standard step-aerobics workout,with Group 1 at a low rate of stepping,Group 2 at a medium rate of stepping,and Group 3 at a rapid rate.The women were also randomly divided into three groups of five subjects each.As with the men,each group did a standard step-aerobics workout,with Group 1 at a low rate of stepping,Group 2 at a medium rate of stepping,and Group 3 at a rapid rate.The mean heart rate at the end of the workout for all the subjects was determined in beats per minute. A partial ANOVA table for these data is given below. If the data were analyzed as a one-way ANOVA with six "treatments" corresponding to the six combinations of stepping rate and gender,what would have been the sum of squares for error?
A)2623.9
B)2855.6
C)5762.0
D)8617.6
If the data were analyzed as a one-way ANOVA with six "treatments" corresponding to the six combinations of stepping rate and gender,what would have been the sum of squares for error?A)2623.9
B)2855.6
C)5762.0
D)8617.6
Unlock Deck
Unlock for access to all 53 flashcards in this deck.
Unlock Deck
k this deck
23
An experiment is done as a 3 × 5 ANOVA and the experiment is replicated twice. What is the total number of observations in this experiment?
A)30
B)15
C)It cannot be determined from the given information.
D)None of the above
A)30
B)15
C)It cannot be determined from the given information.
D)None of the above
Unlock Deck
Unlock for access to all 53 flashcards in this deck.
Unlock Deck
k this deck
24
A researcher wished to compare the effect of the different rates of stepping on volunteers' heart rates in a step-aerobics workout.A collection of thirty adult volunteers,fifteen women and fifteen men,were selected from a local gym.The men were randomly divided into three groups of five subjects each.Each group did a standard step-aerobics workout,with Group 1 at a low rate of stepping,Group 2 at a medium rate of stepping,and Group 3 at a rapid rate.The women were also randomly divided into three groups of five subjects each.As with the men,each group did a standard step-aerobics workout,with Group 1 at a low rate of stepping,Group 2 at a medium rate of stepping,and Group 3 at a rapid rate.The mean heart rate at the end of the workout for all the subjects was determined in beats per minute. A partial ANOVA table for these data is given below. What is the value of the degrees of freedom for interaction?
A)1
B)2
C)3
D)6
What is the value of the degrees of freedom for interaction?A)1
B)2
C)3
D)6
Unlock Deck
Unlock for access to all 53 flashcards in this deck.
Unlock Deck
k this deck
25
A researcher wished to compare the effect of the different rates of stepping on volunteers' heart rates in a step-aerobics workout.A collection of thirty adult volunteers,fifteen women and fifteen men,were selected from a local gym.The men were randomly divided into three groups of five subjects each.Each group did a standard step-aerobics workout,with Group 1 at a low rate of stepping,Group 2 at a medium rate of stepping,and Group 3 at a rapid rate.The women were also randomly divided into three groups of five subjects each.As with the men,each group did a standard step-aerobics workout,with Group 1 at a low rate of stepping,Group 2 at a medium rate of stepping,and Group 3 at a rapid rate.The mean heart rate at the end of the workout for all the subjects was determined in beats per minute. A partial ANOVA table for these data is given below. What are the factors in this experiment?
A)Rate of stepping and heart rate
B)Rate of stepping and gender
C)Heart rate and gender
D)Gym membership and gender
What are the factors in this experiment?A)Rate of stepping and heart rate
B)Rate of stepping and gender
C)Heart rate and gender
D)Gym membership and gender
Unlock Deck
Unlock for access to all 53 flashcards in this deck.
Unlock Deck
k this deck
26
A study was done to determine how gender and stress level affect one's self-rated level of happiness on a scale of 1 to 10.The data are shown below. What is the P-value for the interaction effect? (Note: Assume all assumptions have been reasonably met. )
A)Less than or equal to .01
B)Between .02 and .05
C)Between .06 and .08
D)Greater than .09
What is the P-value for the interaction effect? (Note: Assume all assumptions have been reasonably met. )A)Less than or equal to .01
B)Between .02 and .05
C)Between .06 and .08
D)Greater than .09
Unlock Deck
Unlock for access to all 53 flashcards in this deck.
Unlock Deck
k this deck
27
An experiment is done as a 3 × 5 ANOVA and the experiment is replicated twice. How large should the F statistic be to reject the null hypothesis for the interaction at the .05 level?
A)1
B)3.22
C)2.64
D)None of the above
A)1
B)3.22
C)2.64
D)None of the above
Unlock Deck
Unlock for access to all 53 flashcards in this deck.
Unlock Deck
k this deck
28
A research project studied the physical properties of wood materials constructed by bonding together small flakes of wood.The two factors considered were the size of the flakes and species of tree.The sizes of the flakes were S1: 0.15 inches by 2 inches and S2: 0.25 inches by 2 inches,and the species of tree used were aspen,birch,and maple.For each combination of flake size and tree species,three samples of wood material were constructed.For each sample,the physical property measured was the tension modulus of elasticity in the direction perpendicular to the alignment of the flakes,in pounds per square inch (psi). The table below gives the means for the different size-species groups: For these data,a two-way ANOVA was run and the partial ANOVA table is given below. What is the value of the sum of squares for error,SSE?
A)1021.8
B)14,512.0
C)20,853.5
D)147,144.0
For these data,a two-way ANOVA was run and the partial ANOVA table is given below. What is the value of the sum of squares for error,SSE?A)1021.8
B)14,512.0
C)20,853.5
D)147,144.0
Unlock Deck
Unlock for access to all 53 flashcards in this deck.
Unlock Deck
k this deck
29
A researcher wished to compare the effect of the different rates of stepping on volunteers' heart rates in a step-aerobics workout.A collection of thirty adult volunteers,fifteen women and fifteen men,were selected from a local gym.The men were randomly divided into three groups of five subjects each.Each group did a standard step-aerobics workout,with Group 1 at a low rate of stepping,Group 2 at a medium rate of stepping,and Group 3 at a rapid rate.The women were also randomly divided into three groups of five subjects each.As with the men,each group did a standard step-aerobics workout,with Group 1 at a low rate of stepping,Group 2 at a medium rate of stepping,and Group 3 at a rapid rate.The mean heart rate at the end of the workout for all the subjects was determined in beats per minute. A partial ANOVA table for these data is given below. What is the value of the F statistic for testing the main effect of gender?
A)0.01
B)0.29
C)5.32
D)81.49
What is the value of the F statistic for testing the main effect of gender?A)0.01
B)0.29
C)5.32
D)81.49
Unlock Deck
Unlock for access to all 53 flashcards in this deck.
Unlock Deck
k this deck
30
An experiment is done as a 3 × 5 ANOVA and the experiment is replicated twice. What are the degrees of freedom of the F statistic associated with the second main effect?
A)4 and 15
B)3 and 5
C)4 and 29
D)None of the above
A)4 and 15
B)3 and 5
C)4 and 29
D)None of the above
Unlock Deck
Unlock for access to all 53 flashcards in this deck.
Unlock Deck
k this deck
31
An experiment is done as a 3 × 5 ANOVA and the experiment is replicated twice. What are the degrees of freedom of the F statistic associated with the interaction effect?
A)8 and 15
B)15 and 30
C)6 and 30
D)None of the above
A)8 and 15
B)15 and 30
C)6 and 30
D)None of the above
Unlock Deck
Unlock for access to all 53 flashcards in this deck.
Unlock Deck
k this deck
32
A study was done to determine how gender and stress level affect one's self-rated level of happiness on a scale of 1 to 10.The data are shown below. What is the P-value for the main effect for stress? (Note: Include the interaction in your ANOVA model and assume all assumptions have been reasonably met. )
A)Less than or equal to .01
B)Between .02 and .05
C)Between .06 and .08
D)Greater than .09
What is the P-value for the main effect for stress? (Note: Include the interaction in your ANOVA model and assume all assumptions have been reasonably met. )A)Less than or equal to .01
B)Between .02 and .05
C)Between .06 and .08
D)Greater than .09
Unlock Deck
Unlock for access to all 53 flashcards in this deck.
Unlock Deck
k this deck
33
An experiment is done as a 3 × 5 ANOVA and the experiment is replicated twice. How large should the F statistic be to reject the null hypothesis for the first main effect at the .05 level?
A)3.68
B)19.43
C)15
D)None of the above
A)3.68
B)19.43
C)15
D)None of the above
Unlock Deck
Unlock for access to all 53 flashcards in this deck.
Unlock Deck
k this deck
34
A researcher wished to compare the effect of the different rates of stepping on volunteers' heart rates in a step-aerobics workout.A collection of thirty adult volunteers,fifteen women and fifteen men,were selected from a local gym.The men were randomly divided into three groups of five subjects each.Each group did a standard step-aerobics workout,with Group 1 at a low rate of stepping,Group 2 at a medium rate of stepping,and Group 3 at a rapid rate.The women were also randomly divided into three groups of five subjects each.As with the men,each group did a standard step-aerobics workout,with Group 1 at a low rate of stepping,Group 2 at a medium rate of stepping,and Group 3 at a rapid rate.The mean heart rate at the end of the workout for all the subjects was determined in beats per minute. A partial ANOVA table for these data is given below. What can we say about the P-value for the main effect of the stepping rate group?
A)P-value < 0.01
B)0.01C)0.05 D)P-value > 0.10
What can we say about the P-value for the main effect of the stepping rate group?A)P-value < 0.01
B)0.01
Unlock Deck
Unlock for access to all 53 flashcards in this deck.
Unlock Deck
k this deck
35
A research project studied the physical properties of wood materials constructed by bonding together small flakes of wood.The two factors considered were the size of the flakes and species of tree.The sizes of the flakes were S1: 0.15 inches by 2 inches and S2: 0.25 inches by 2 inches,and the species of tree used were aspen,birch,and maple.For each combination of flake size and tree species,three samples of wood material were constructed.For each sample,the physical property measured was the tension modulus of elasticity in the direction perpendicular to the alignment of the flakes,in pounds per square inch (psi). The table below gives the means for the different size-species groups: For these data,a two-way ANOVA was run and the partial ANOVA table is given below. In the ANOVA table,the test for the main effect of size has a P-value of 0.613.What does this indicate?
A)The effect of particle size probably varies considerably for the different species.
B)For about 61.3% of the samples,there was a difference in the effect of particle size.
C)For about 61.3% of the samples,there was no difference in the effect of particle size.
D)None of the above
For these data,a two-way ANOVA was run and the partial ANOVA table is given below. In the ANOVA table,the test for the main effect of size has a P-value of 0.613.What does this indicate?A)The effect of particle size probably varies considerably for the different species.
B)For about 61.3% of the samples,there was a difference in the effect of particle size.
C)For about 61.3% of the samples,there was no difference in the effect of particle size.
D)None of the above
Unlock Deck
Unlock for access to all 53 flashcards in this deck.
Unlock Deck
k this deck
36
A study was done to determine how gender and stress level affect one's self-rated level of happiness on a scale of 1 to 10.The data are shown below. What is the P-value for the main effect for gender? (Note: Include the interaction in your ANOVA model and assume all assumptions have been reasonably met. )
A)Less than or equal to .01
B)Between .02 and .05
C)Between .06 and .08
D)Greater than .09
What is the P-value for the main effect for gender? (Note: Include the interaction in your ANOVA model and assume all assumptions have been reasonably met. )A)Less than or equal to .01
B)Between .02 and .05
C)Between .06 and .08
D)Greater than .09
Unlock Deck
Unlock for access to all 53 flashcards in this deck.
Unlock Deck
k this deck
37
A research project studied the physical properties of wood materials constructed by bonding together small flakes of wood.The two factors considered were the size of the flakes and species of tree.The sizes of the flakes were S1: 0.15 inches by 2 inches and S2: 0.25 inches by 2 inches,and the species of tree used were aspen,birch,and maple.For each combination of flake size and tree species,three samples of wood material were constructed.For each sample,the physical property measured was the tension modulus of elasticity in the direction perpendicular to the alignment of the flakes,in pounds per square inch (psi). The table below gives the means for the different size-species groups: For these data,a two-way ANOVA was run and the partial ANOVA table is given below. What is the value of the degrees of freedom for the model,DFM?
A)1
B)2
C)5
D)6
For these data,a two-way ANOVA was run and the partial ANOVA table is given below. What is the value of the degrees of freedom for the model,DFM?A)1
B)2
C)5
D)6
Unlock Deck
Unlock for access to all 53 flashcards in this deck.
Unlock Deck
k this deck
38
A researcher wished to compare the effect of the different rates of stepping on volunteers' heart rates in a step-aerobics workout.A collection of thirty adult volunteers,fifteen women and fifteen men,were selected from a local gym.The men were randomly divided into three groups of five subjects each.Each group did a standard step-aerobics workout,with Group 1 at a low rate of stepping,Group 2 at a medium rate of stepping,and Group 3 at a rapid rate.The women were also randomly divided into three groups of five subjects each.As with the men,each group did a standard step-aerobics workout,with Group 1 at a low rate of stepping,Group 2 at a medium rate of stepping,and Group 3 at a rapid rate.The mean heart rate at the end of the workout for all the subjects was determined in beats per minute. A partial ANOVA table for these data is given below. What is the value of the degrees of freedom for error?
A)5
B)11
C)24
D)29
What is the value of the degrees of freedom for error?A)5
B)11
C)24
D)29
Unlock Deck
Unlock for access to all 53 flashcards in this deck.
Unlock Deck
k this deck
39
A study was done to determine whether gender and type of student (graduate students or undergraduate)performed differently on a final exam in a statistics course.The mean scores of each group are shown below. Create a profile plot.Based on the profile plot,which main effect appears to be the largest?
A)Gender
B)Student
Create a profile plot.Based on the profile plot,which main effect appears to be the largest?A)Gender
B)Student
Unlock Deck
Unlock for access to all 53 flashcards in this deck.
Unlock Deck
k this deck
40
A researcher wished to compare the effect of the different rates of stepping on volunteers' heart rates in a step-aerobics workout.A collection of thirty adult volunteers,fifteen women and fifteen men,were selected from a local gym.The men were randomly divided into three groups of five subjects each.Each group did a standard step-aerobics workout,with Group 1 at a low rate of stepping,Group 2 at a medium rate of stepping,and Group 3 at a rapid rate.The women were also randomly divided into three groups of five subjects each.As with the men,each group did a standard step-aerobics workout,with Group 1 at a low rate of stepping,Group 2 at a medium rate of stepping,and Group 3 at a rapid rate.The mean heart rate at the end of the workout for all the subjects was determined in beats per minute. A partial ANOVA table for these data is given below. What are the advantages of studying the two factors simultaneously in the same experiment?
A)It is more efficient to study two factors simultaneously rather than separately.
B)We can reduce the residual variation in a model by including a second factor thought to influence the response.
C)We can investigate the interaction between factors.
D)All of the above
What are the advantages of studying the two factors simultaneously in the same experiment?A)It is more efficient to study two factors simultaneously rather than separately.
B)We can reduce the residual variation in a model by including a second factor thought to influence the response.
C)We can investigate the interaction between factors.
D)All of the above
Unlock Deck
Unlock for access to all 53 flashcards in this deck.
Unlock Deck
k this deck
41
In a two-way ANOVA,the total sum of squares (SST)can be broken down into which terms?
A)Sum of squares for factor A (SSA)+ sum of squares for factor B (SSB)
B)Sum of squares for factor A (SSA)+ sum of squares for factor B (SSB)+ sum of squares for error (SSE)
C)Model sum of squares (SSM)+ sum of squares for error (SSE)
D)Sum of squares for factor A (SSA)+ sum of squares for factor B (SSB)+ sum of squares of the interaction of factor A and B (SSAB)
Unlock Deck
Unlock for access to all 53 flashcards in this deck.
Unlock Deck
k this deck
42
What is the benefit of doing a two-way ANOVA rather than a one-way ANOVA on two factors separately?
A)We can detect interactions between the two factors.
B)By including a second factor,we may reduce the residual variance.
C)The two-way ANOVA is more efficient than a one-way ANOVA on two factors separately.
D)All of the above
A)We can detect interactions between the two factors.
B)By including a second factor,we may reduce the residual variance.
C)The two-way ANOVA is more efficient than a one-way ANOVA on two factors separately.
D)All of the above
Unlock Deck
Unlock for access to all 53 flashcards in this deck.
Unlock Deck
k this deck
43
What are the null hypotheses being tested in a two-way ANOVA?
A)Main effect of factor A and main effect of factor B
B)The AB interaction effect
C)Main effect of factor A,main effect of factor B,and the AB interaction effect
A)Main effect of factor A and main effect of factor B
B)The AB interaction effect
C)Main effect of factor A,main effect of factor B,and the AB interaction effect
Unlock Deck
Unlock for access to all 53 flashcards in this deck.
Unlock Deck
k this deck
44
In a two-way ANOVA,it is possible that all,none,or any combination of the hypotheses being tested are significant.
Unlock Deck
Unlock for access to all 53 flashcards in this deck.
Unlock Deck
k this deck
45
Consider the following graphic results from a two-way ANOVA.These results show _________.
A)no significant main effects or interaction effects.
B)a possible significant main effect for factor A and factor B.
C)a significant interaction effect but no other significant effects.
D)a possible significant main effect for factor A but no other significant effects.
E)a possible significant main effect for factor B but no other significant effects.
Unlock Deck
Unlock for access to all 53 flashcards in this deck.
Unlock Deck
k this deck
46
Consider a two-way ANOVA in which Factor A is at four levels,Factor B has three levels,and there are four observations in each cell.Which of the following are TRUE statements about the ANOVA in this situation?
A)The A × B interaction has 6 degrees of freedom.
B)The ANOVA total sum of squares has 47 degrees of freedom.
C)The mean square for error is given by .
D)To test the A × B interaction,you would use the F statistic, .
E)With the exception of B,all of the above are true statements.
A)The A × B interaction has 6 degrees of freedom.
B)The ANOVA total sum of squares has 47 degrees of freedom.
C)The mean square for error is given by
.D)To test the A × B interaction,you would use the F statistic,
.E)With the exception of B,all of the above are true statements.
Unlock Deck
Unlock for access to all 53 flashcards in this deck.
Unlock Deck
k this deck
47
It is not possible to have an interaction effect in a two-way ANOVA unless one of the factors has a main effect.
Unlock Deck
Unlock for access to all 53 flashcards in this deck.
Unlock Deck
k this deck
48
In a two-way ANOVA,the model sum of squares (SSM)can be broken down into which terms?
A)Sum of squares for factor A (SSA)+ sum of squares for factor B (SSB)+ sum of squares error (SSE)
B)Sum of squares for factor A (SSA)+ sum of squares for factor B (SSB)+ sum of squares total (SST)
C)Sum of squares for factor A (SSA)+ sum of squares for factor B (SSB)+ sum of squares of the interaction of factor A and B (SSAB)
D)Sum of squares for factor A (SSA)+ sum of squares for factor B (SSB)
Unlock Deck
Unlock for access to all 53 flashcards in this deck.
Unlock Deck
k this deck
49
Consider the following graphic results from a two-way ANOVA.These results show __________.
A)no significant main effects or interaction effects.
B)a possible significant main effect for factor A and no other significant effects.
C)a possible significant main effect for factor B and no other significant effects.
D)a significant interaction effect and no other significant effects.
A)no significant main effects or interaction effects.
B)a possible significant main effect for factor A and no other significant effects.
C)a possible significant main effect for factor B and no other significant effects.
D)a significant interaction effect and no other significant effects.
Unlock Deck
Unlock for access to all 53 flashcards in this deck.
Unlock Deck
k this deck
50
In a two-way ANOVA,how many F tests are possible?
A)Zero
B)One
C)Two
D)Three
A)Zero
B)One
C)Two
D)Three
Unlock Deck
Unlock for access to all 53 flashcards in this deck.
Unlock Deck
k this deck
51
If the interaction effect is significant in a two-way ANOVA,then it is best to examine main effects by looking at _____.
A)profile plots of the group means
B)plots of the standard deviations
C)histograms of the dependent variable
D)Q-Q plots of the group means
A)profile plots of the group means
B)plots of the standard deviations
C)histograms of the dependent variable
D)Q-Q plots of the group means
Unlock Deck
Unlock for access to all 53 flashcards in this deck.
Unlock Deck
k this deck
52
The assumptions underlying a two-way ANOVA and a one-way ANOVA are different.
Unlock Deck
Unlock for access to all 53 flashcards in this deck.
Unlock Deck
k this deck
53
A researcher wished to compare the effect of the different rates of stepping on volunteers' heart rates in a step-aerobics workout.A collection of thirty adult volunteers,fifteen women and fifteen men,were selected from a local gym.The men were randomly divided into three groups of five subjects each.Each group did a standard step-aerobics workout,with Group 1 at a low rate of stepping,Group 2 at a medium rate of stepping,and Group 3 at a rapid rate.The women were also randomly divided into three groups of five subjects each.As with the men,each group did a standard step-aerobics workout,with Group 1 at a low rate of stepping,Group 2 at a medium rate of stepping,and Group 3 at a rapid rate.The mean heart rate at the end of the workout for all the subjects was determined in beats per minute. A partial ANOVA table for these data is given below. The profile plot and the P-value for the test for interaction show little evidence of interaction.What can we conclude?
A)There is little difference in the heart rates of men and women.
B)The change in heart rate due to different stepping rates is similar for men and women.
C)Changes in stepping rate are positively associated with heart rate.
D)Step exercise is equally beneficial to men and women.
The profile plot and the P-value for the test for interaction show little evidence of interaction.What can we conclude?A)There is little difference in the heart rates of men and women.
B)The change in heart rate due to different stepping rates is similar for men and women.
C)Changes in stepping rate are positively associated with heart rate.
D)Step exercise is equally beneficial to men and women.
Unlock Deck
Unlock for access to all 53 flashcards in this deck.
Unlock Deck
k this deck
Unlock Deck
Unlock for access to all 53 flashcards in this deck.


