Exam 13: Two-Way Analysis of Variance
Exam 1: Looking at Datadistributions127 Questions
Exam 2: Looking at Datarelationships48 Questions
Exam 3: Producing Data70 Questions
Exam 4: Probability: the Study of Randomness93 Questions
Exam 5: Sampling Distributions77 Questions
Exam 6: Introduction to Inference89 Questions
Exam 7: Inference for Means103 Questions
Exam 8: Inference for Proportions101 Questions
Exam 9: Inference for Categorical Data122 Questions
Exam 10: Inference for Regression91 Questions
Exam 11: Multiple Regression95 Questions
Exam 12: One-Way Analysis of Variance74 Questions
Exam 13: Two-Way Analysis of Variance53 Questions
Exam 14: Logistic Regression53 Questions
Exam 15: Nonparametric Tests57 Questions
Exam 16: Bootstrap Methods and Permutation Tests42 Questions
Exam 17: Statistics for Quality: Control and Capability86 Questions
Select questions type
Consider the following graphic results from a two-way ANOVA.These results show __________. 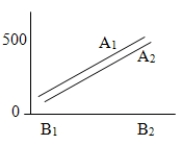
Free
(Multiple Choice)
4.8/5  (31)
(31)
Correct Answer: Verified
C
An experiment is done as a 3 × 5 ANOVA and the experiment is replicated twice. What are the degrees of freedom of the F statistic associated with the second main effect?
Free
(Multiple Choice)
4.9/5 (39)
Correct Answer:Verified
A
With which of the following research questions could you use a two-way ANOVA model for the analysis?
Free
(Multiple Choice)
4.9/5 (39)
Correct Answer:Verified
B
An experiment is done as a 3 × 5 ANOVA and the experiment is replicated twice. What are the degrees of freedom of the F statistic associated with the interaction effect?
(Multiple Choice)
4.8/5 (38)
Consider the following graphic results from a two-way ANOVA.These results show _________. 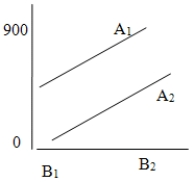
(Multiple Choice)
4.9/5 (38)
A study compares three levels of Factor A and four levels of Factor B,with seven observations in each cell.What are the degrees of freedom for the F statistic that is used to test for the main effect of Factor B?
(Multiple Choice)
4.8/5 (34)
Which of the following are statements about a two-way ANOVA involving Factor A at I levels and Factor B at J levels is/are FALSE?
(Multiple Choice)
4.9/5 (42)
A researcher wished to compare the effect of the different rates of stepping on volunteers' heart rates in a step-aerobics workout.A collection of thirty adult volunteers,fifteen women and fifteen men,were selected from a local gym.The men were randomly divided into three groups of five subjects each.Each group did a standard step-aerobics workout,with Group 1 at a low rate of stepping,Group 2 at a medium rate of stepping,and Group 3 at a rapid rate.The women were also randomly divided into three groups of five subjects each.As with the men,each group did a standard step-aerobics workout,with Group 1 at a low rate of stepping,Group 2 at a medium rate of stepping,and Group 3 at a rapid rate.The mean heart rate at the end of the workout for all the subjects was determined in beats per minute. A partial ANOVA table for these data is given below.  What is the value of the F statistic for testing the main effect of gender?
(Multiple Choice)
4.8/5 (36)
In a study comparing four levels of Factor A and two levels of Factor B,with six observations in each cell,the SSE = 3456 and the SSA = 364.What is the value of the F statistic that is used to test for the main effect of Factor A?
(Multiple Choice)
4.8/5 (36)
Which of the following statements about the two-way ANOVA is/are FALSE?
(Multiple Choice)
4.8/5 (35)
A researcher wished to compare the effect of the different rates of stepping on volunteers' heart rates in a step-aerobics workout.A collection of thirty adult volunteers,fifteen women and fifteen men,were selected from a local gym.The men were randomly divided into three groups of five subjects each.Each group did a standard step-aerobics workout,with Group 1 at a low rate of stepping,Group 2 at a medium rate of stepping,and Group 3 at a rapid rate.The women were also randomly divided into three groups of five subjects each.As with the men,each group did a standard step-aerobics workout,with Group 1 at a low rate of stepping,Group 2 at a medium rate of stepping,and Group 3 at a rapid rate.The mean heart rate at the end of the workout for all the subjects was determined in beats per minute. A partial ANOVA table for these data is given below. 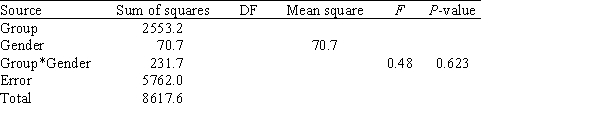 What are the factors in this experiment?
(Multiple Choice)
4.8/5 (42)
A study compares the strength of a product between two different materials used to make the product and five different labs that created these products.The profile plot of the group means is shown below. 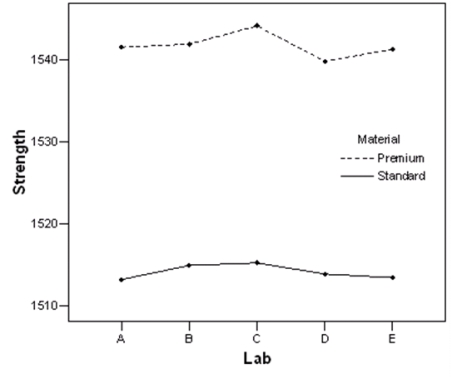 Based on this plot,does there seem to be a main effect for material?
(Multiple Choice)
5.0/5 (34)
A study compares three levels of Factor A and four levels of Factor B,with three observations in each group.An F statistic of 5.113 is reported for the main effect of Factor A.What can we say about the P-value for this F test?
(Multiple Choice)
4.8/5 (37)
A research project studied the physical properties of wood materials constructed by bonding together small flakes of wood.The two factors considered were the size of the flakes and species of tree.The sizes of the flakes were S1: 0.15 inches by 2 inches and S2: 0.25 inches by 2 inches,and the species of tree used were aspen,birch,and maple.For each combination of flake size and tree species,three samples of wood material were constructed.For each sample,the physical property measured was the tension modulus of elasticity in the direction perpendicular to the alignment of the flakes,in pounds per square inch (psi). The table below gives the means for the different size-species groups:  For these data,a two-way ANOVA was run and the partial ANOVA table is given below.
  In the ANOVA table,the test for the main effect of size has a P-value of 0.613.What does this indicate?
(Multiple Choice)
4.8/5 (42)
A study compares the average number of accidents by gender for three different age groups.The profile plot of the group means is shown below. 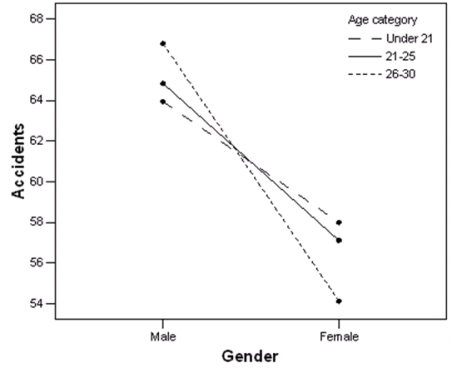 Based on this plot,does there seem to be a main effect for gender?
(Multiple Choice)
4.7/5 (31)
A research project studied the physical properties of wood materials constructed by bonding together small flakes of wood.The two factors considered were the size of the flakes and species of tree.The sizes of the flakes were S1: 0.15 inches by 2 inches and S2: 0.25 inches by 2 inches,and the species of tree used were aspen,birch,and maple.For each combination of flake size and tree species,three samples of wood material were constructed.For each sample,the physical property measured was the tension modulus of elasticity in the direction perpendicular to the alignment of the flakes,in pounds per square inch (psi).The table below gives the means for the different size-species groups. 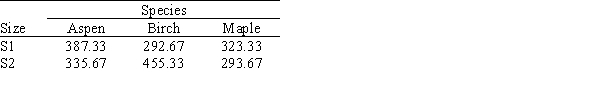 What are the marginal means for species?
(Multiple Choice)
4.7/5 (35)
In a two-way ANOVA,it is possible that all,none,or any combination of the hypotheses being tested are significant.
(True/False)
4.7/5 (44)
A study was done to determine how gender and stress level affect one's self-rated level of happiness on a scale of 1 to 10.The data are shown below. 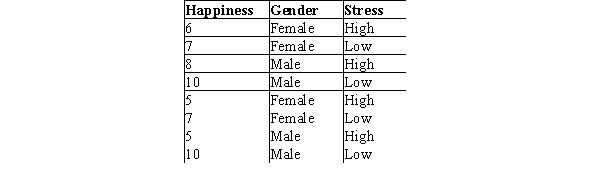 What is the P-value for the interaction effect? (Note: Assume all assumptions have been reasonably met. )
(Multiple Choice)
4.9/5 (45)
A research project studied the physical properties of wood materials constructed by bonding together small flakes of wood.The two factors considered were the size of the flakes and species of tree.The sizes of the flakes were S1: 0.15 inches by 2 inches and S2: 0.25 inches by 2 inches,and the species of tree used were aspen,birch,and maple.For each combination of flake size and tree species,three samples of wood material were constructed.For each sample,the physical property measured was the tension modulus of elasticity in the direction perpendicular to the alignment of the flakes,in pounds per square inch (psi). The table below gives the means for the different size-species groups:  For these data,a two-way ANOVA was run and the partial ANOVA table is given below.
 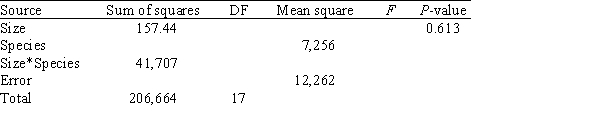 What is the value of the sum of squares for error,SSE?
(Multiple Choice)
4.9/5 (39)
Filters
- Essay(0)
- Multiple Choice(0)
- Short Answer(0)
- True False(0)
- Matching(0)