Exam 6: Appendix: Indifference Curves and Utility Maximization
Exam 1: The Art and Science of Economic Analysis162 Questions
Exam 1: Appendix: Understanding Graphs74 Questions
Exam 2: Economic Tools and Economics Systems211 Questions
Exam 3: Economic Decision Makers207 Questions
Exam 4: Demand, Supply, and Markets245 Questions
Exam 5: Elasticity of Demand and Supply247 Questions
Exam 5: Appendix: price Elasticity and Tax Incidence32 Questions
Exam 6: Consumer Choice and Demand174 Questions
Exam 6: Appendix: Indifference Curves and Utility Maximization108 Questions
Exam 7: Production and Cost in the Firm218 Questions
Exam 7: Appendix: a Closer Look at Production and Cost78 Questions
Exam 8: A: perfect Competition250 Questions
Exam 8: B: perfect Competition25 Questions
Exam 9: A: monopoly249 Questions
Exam 9: B: Monopoly18 Questions
Exam 10: Monopolistic Competition and Oligopoly233 Questions
Exam 11: Resource Markets223 Questions
Exam 12: Labor Markets and Labor Unions217 Questions
Exam 13: Capital, Interest, and Corporate Finance190 Questions
Exam 14: Transaction Costs, Imperfect Information, and Behavioral Economics188 Questions
Exam 15: Economic Regulation and Antitrust Policy179 Questions
Exam 16: Public Goods and Public Choice143 Questions
Exam 17: Externalities and the Environment201 Questions
Exam 18: Income Distribution and Poverty130 Questions
Exam 19: International Trade172 Questions
Exam 20: International Finance232 Questions
Exam 21: Economic Development97 Questions
Select questions type
Exhibit 6-29 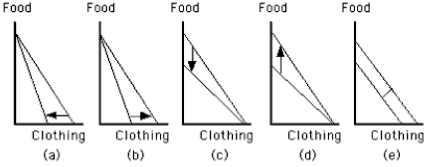 -Which graph in Exhibit 6-29 shows the effect of an increase in the price of clothing and a decrease in the price of food?
(Multiple Choice)
4.8/5  (40)
(40)
Exhibit 6-28 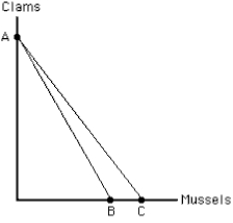 -The rotation of the budget line in Exhibit 6-28 from AC to AB represents a(n)
(Multiple Choice)
4.8/5 (33)
Exhibit 6-26 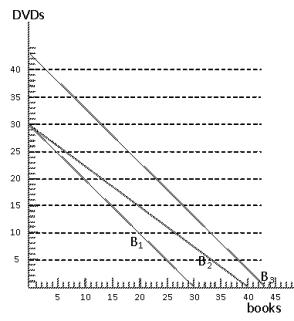 -Consider Exhibit 6-26. Three budget lines are shown. Which of the following statements is true about the budget lines?
(Multiple Choice)
4.8/5 (20)
Within the framework of indifference curve analysis, what prevents the individual from purchasing more of all goods?
(Multiple Choice)
4.8/5 (35)
Exhibit 6-31 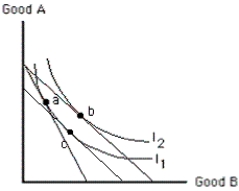 -Assume that a consumer is initially in equilibrium at point a in Exhibit 6-31. Then the price of good B falls. The movement from point c to point b represents
(Multiple Choice)
4.8/5 (38)
What would happen to the budget line if the price of orange juice increased and orange juice is measured on the vertical axis?
(Multiple Choice)
4.9/5 (35)
If two goods have the same price, a consumer will buy equal quantities of those two goods.
(True/False)
4.8/5 (33)
Filters
- Essay(0)
- Multiple Choice(0)
- Short Answer(0)
- True False(0)
- Matching(0)