Exam 1: Appendix: Understanding Graphs
Exam 1: The Art and Science of Economic Analysis162 Questions
Exam 1: Appendix: Understanding Graphs74 Questions
Exam 2: Economic Tools and Economics Systems211 Questions
Exam 3: Economic Decision Makers207 Questions
Exam 4: Demand, Supply, and Markets245 Questions
Exam 5: Elasticity of Demand and Supply247 Questions
Exam 5: Appendix: price Elasticity and Tax Incidence32 Questions
Exam 6: Consumer Choice and Demand174 Questions
Exam 6: Appendix: Indifference Curves and Utility Maximization108 Questions
Exam 7: Production and Cost in the Firm218 Questions
Exam 7: Appendix: a Closer Look at Production and Cost78 Questions
Exam 8: A: perfect Competition250 Questions
Exam 8: B: perfect Competition25 Questions
Exam 9: A: monopoly249 Questions
Exam 9: B: Monopoly18 Questions
Exam 10: Monopolistic Competition and Oligopoly233 Questions
Exam 11: Resource Markets223 Questions
Exam 12: Labor Markets and Labor Unions217 Questions
Exam 13: Capital, Interest, and Corporate Finance190 Questions
Exam 14: Transaction Costs, Imperfect Information, and Behavioral Economics188 Questions
Exam 15: Economic Regulation and Antitrust Policy179 Questions
Exam 16: Public Goods and Public Choice143 Questions
Exam 17: Externalities and the Environment201 Questions
Exam 18: Income Distribution and Poverty130 Questions
Exam 19: International Trade172 Questions
Exam 20: International Finance232 Questions
Exam 21: Economic Development97 Questions
Select questions type
A tangent line is a straight line
Free
(Multiple Choice)
4.8/5  (35)
(35)
Correct Answer: Verified
C
Exhibit 1-2  -In Exhibit 1-2, when x is greater than 10, the
Free
(Multiple Choice)
4.8/5 (39)
Correct Answer:Verified
A
Exhibit 1-2
-In Exhibit 1-2, at y = 14, the
Free
(Multiple Choice)
4.7/5 (34)
Correct Answer:Verified
A
Exhibit 1-9
 -Using the values in Exhibit 1-9, calculate the slope of a line graphed with x on the horizontal axis and y on the vertical axis.
(Multiple Choice)
4.9/5 (38)
Most economics graphs reflect the relationship between how many economic variables?
(Multiple Choice)
4.8/5 (39)
The part of a graph that is most applicable to marginal analysis is the
(Multiple Choice)
4.8/5 (39)
Exhibit 1-5 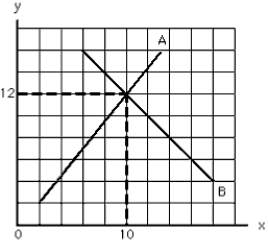 -In Exhibit 1-5, curve A has a __________ slope that is __________ at every point.
(Multiple Choice)
4.8/5 (43)
Exhibit 1-15 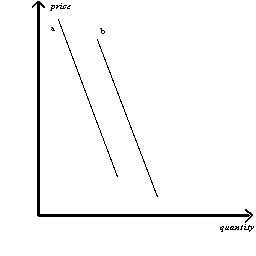 -Refer to Exhibit 1-15. The reason that Line (a) would shift to the position of Line (b) is
(Multiple Choice)
4.7/5 (35)
Exhibit 1-16 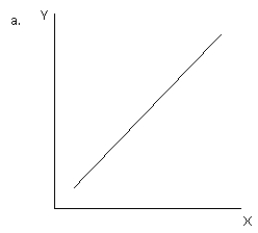
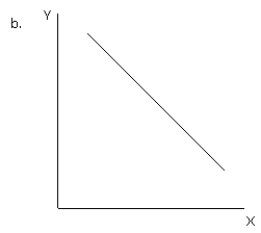
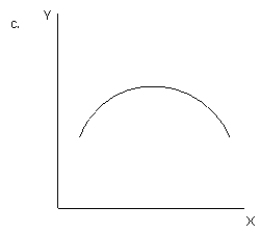
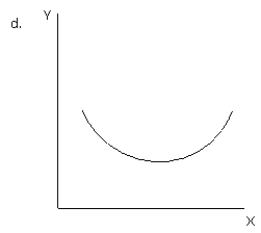
 -Refer to exhibit 1-16. Which of the graphs illustrates an inverse or negative relationship between variable X and variable Y?
(Multiple Choice)
4.9/5 (33)
On a graph with x on the horizontal axis and y on the vertical axis, the origin is
(Multiple Choice)
4.9/5 (36)
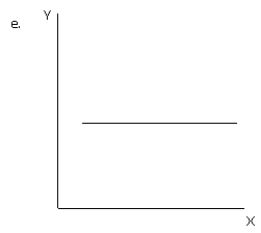
Exhibit 1-16
-Refer to exhibit 1-16. Which of the graphs illustrates no relationship between variable X and variable Y?
(Multiple Choice)
4.8/5 (33)
Filters
- Essay(0)
- Multiple Choice(0)
- Short Answer(0)
- True False(0)
- Matching(0)