Exam 1: Appendix: Understanding Graphs
Exam 1: The Art and Science of Economic Analysis162 Questions
Exam 1: Appendix: Understanding Graphs74 Questions
Exam 2: Economic Tools and Economics Systems211 Questions
Exam 3: Economic Decision Makers207 Questions
Exam 4: Demand, Supply, and Markets245 Questions
Exam 5: Elasticity of Demand and Supply247 Questions
Exam 5: Appendix: price Elasticity and Tax Incidence32 Questions
Exam 6: Consumer Choice and Demand174 Questions
Exam 6: Appendix: Indifference Curves and Utility Maximization108 Questions
Exam 7: Production and Cost in the Firm218 Questions
Exam 7: Appendix: a Closer Look at Production and Cost78 Questions
Exam 8: A: perfect Competition250 Questions
Exam 8: B: perfect Competition25 Questions
Exam 9: A: monopoly249 Questions
Exam 9: B: Monopoly18 Questions
Exam 10: Monopolistic Competition and Oligopoly233 Questions
Exam 11: Resource Markets223 Questions
Exam 12: Labor Markets and Labor Unions217 Questions
Exam 13: Capital, Interest, and Corporate Finance190 Questions
Exam 14: Transaction Costs, Imperfect Information, and Behavioral Economics188 Questions
Exam 15: Economic Regulation and Antitrust Policy179 Questions
Exam 16: Public Goods and Public Choice143 Questions
Exam 17: Externalities and the Environment201 Questions
Exam 18: Income Distribution and Poverty130 Questions
Exam 19: International Trade172 Questions
Exam 20: International Finance232 Questions
Exam 21: Economic Development97 Questions
Select questions type
Exhibit 1-4 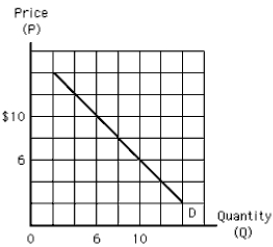 -Which of the following must be true of line D in Exhibit 1-4?
(Multiple Choice)
5.0/5  (40)
(40)
Suppose y is measured on the vertical axis, x is on the horizontal axis, and the various combinations of x and y are shown by a nonvertical straight line. Which of the following must be true?
(Multiple Choice)
4.8/5 (35)
If a given value of x is associated with a particular value of y,
(Multiple Choice)
4.8/5 (38)
Exhibit 1-1 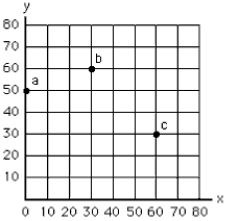 -In Exhibit 1-1 the movement from point a to point c represents
(Multiple Choice)
4.7/5 (35)
Exhibit 1-1
-In Exhibit 1-1 the movement from point a to point b represents
(Multiple Choice)
4.8/5 (37)
Any point on a graph represents a combination of particular values of two variables.
(True/False)
4.7/5 (37)
Suppose a graph with Ron's weight on the vertical axis and his consumption of ice cream on the horizontal axis indicated that for each serving of ice cream he ate, Ron would gain 3 pounds, regardless of how much ice cream he had already eaten. This graph would show a
(Multiple Choice)
4.9/5 (38)
Exhibit 1-16 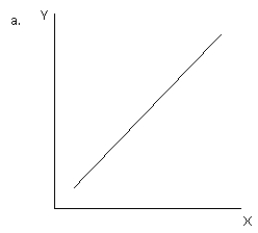
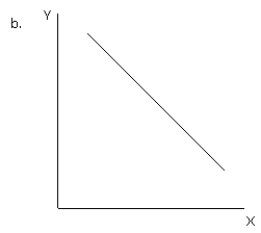
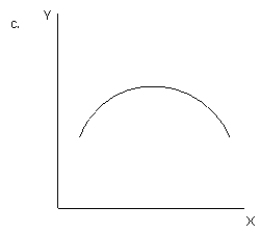
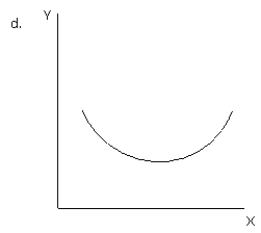
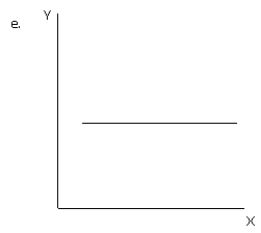 -Refer to Exhibit 1-16. Which graph illustrates a negative relationship between variable X and variable Y initially but then a positive relationship?
(Multiple Choice)
4.9/5 (28)
Filters
- Essay(0)
- Multiple Choice(0)
- Short Answer(0)
- True False(0)
- Matching(0)