Exam 6: Appendix--Indifference Curves and Utility Maximization
Exam 1: The Art and Science of Economic Analysis162 Questions
Exam 1: Appendix--Understanding Graphs71 Questions
Exam 2: Economic Tools and Economics Systems211 Questions
Exam 3: Economic Decision Makers207 Questions
Exam 4: Demand, Supply, and Markets245 Questions
Exam 5: Elasticity of Demand and Supply244 Questions
Exam 5: Appendix--Price Elasticity and Tax Incidence32 Questions
Exam 6: Consumer Choice and Demand171 Questions
Exam 6: Appendix--Indifference Curves and Utility Maximization107 Questions
Exam 7: Production and Cost in the Firm218 Questions
Exam 8: A--Perfect Competition250 Questions
Exam 8: B--Perfect Competition25 Questions
Exam 9: A--Monopoly249 Questions
Exam 9: B--Monopoly18 Questions
Exam 10: Monopolistic Competition and Oligopoly233 Questions
Exam 11: Resource Markets219 Questions
Exam 12: Labor Markets and Labor Unions218 Questions
Exam 13: Capital, Interest, and Corporate Finance190 Questions
Exam 14: Transaction Costs, Imperfect Information, and Behavioral Economics187 Questions
Exam 15: Economic Regulation and Antitrust Policy179 Questions
Exam 16: Public Goods and Public Choice143 Questions
Exam 17: Externalities and the Environment203 Questions
Exam 18: Income Distribution and Poverty130 Questions
Exam 19: International Trade172 Questions
Exam 20: International Finance226 Questions
Exam 21: Economic Development97 Questions
Select questions type
A candy bar sells for 50 cents, video games are 25 cents each, the horizontal (candy)intercept of Ann's budget line is 12, and the vertical (video game)intercept of Ann's budget line is 24.Which of the following best describes what would happen to the budget line if Ann's income increased?
(Multiple Choice)
4.9/5  (35)
(35)
A family on a trip budgets $200 for restaurant meals and fast food.If the price of a fast-food meal for the whole family is $20, what is the vertical intercept of the budget line when fast food is measured on the horizontal axis?
(Multiple Choice)
4.9/5 (35)
All combinations of goods along the same indifference curve represent the same level of utility.
(True/False)
4.7/5 (36)
What would happen if the price of novels increased and novels are measured on the horizontal axis of a budget line diagram?
(Multiple Choice)
4.8/5 (31)
What would happen to the budget line if the price of compact disks decreased and compact disks are measured on the vertical axis?
(Multiple Choice)
4.8/5 (37)
Exhibit 6-24  Which of the combinations of Good A and Good B in Exhibit 6-24 would an individual prefer?
(Multiple Choice)
4.9/5 (35)
Chris budgets $30 this week for spending on his two favorite things, pizza and movies.The price of a movie is $5.Moreover, he could buy 3 pizzas if he doesn't go to the movies.If pizza is on the horizontal axis, what is the slope of the budget line?
(Multiple Choice)
4.8/5 (23)
Exhibit 6-28 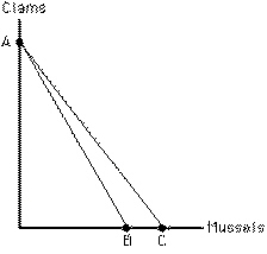 The rotation of the budget line in Exhibit 6-28 from AC to AB represents a(n)
(Multiple Choice)
4.9/5 (39)
All combinations of goods along the same budget line represent the same level of utility.
(True/False)
4.8/5 (39)
A line that shows the combinations of two goods that can be purchased with a given income is called a(n)
(Multiple Choice)
4.9/5 (37)
A family on a trip budgets $800 for restaurant meals and fast food.If the price of a fast-food meal for the whole family is $20, how many meals can the family buy if they don't eat at restaurants?
(Multiple Choice)
4.8/5 (34)
An increase in income is represented by a shift of the budget line outward to a parallel position.
(True/False)
4.8/5 (40)
A candy bar sells for 50 cents, video games are 25 cents each, the horizontal (candy)intercept of Ann's budget line is 12, and the vertical (video game)intercept of Ann's budget line is 24.The slope of the budget line is
(Multiple Choice)
4.8/5 (35)
Exhibit 6-24 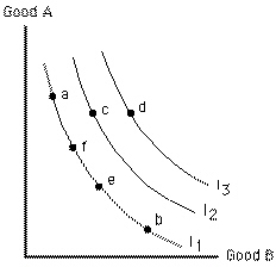 Which point on curve I1 in Exhibit 6-24 yields the most utility?
(Multiple Choice)
4.7/5 (38)
Exhibit 6-23 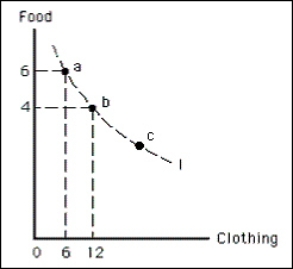 In Exhibit 6-23, the marginal rate of substitution of food for clothing between points a and b equals
(Multiple Choice)
5.0/5 (35)
Exhibit 6-28  The rotation of the budget line in Exhibit 6-28 from AB to AC represents
(Multiple Choice)
4.7/5 (29)
Exhibit 6-29 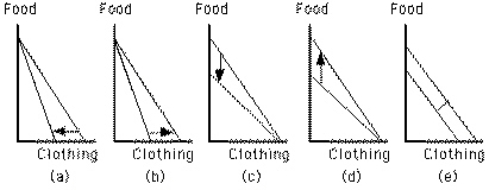 Which graph in Exhibit 6-29 shows an increase in the price of food?
(Multiple Choice)
4.9/5 (41)
Filters
- Essay(0)
- Multiple Choice(0)
- Short Answer(0)
- True False(0)
- Matching(0)