Exam 1: Appendix--Understanding Graphs
Exam 1: The Art and Science of Economic Analysis162 Questions
Exam 1: Appendix--Understanding Graphs71 Questions
Exam 2: Economic Tools and Economics Systems211 Questions
Exam 3: Economic Decision Makers207 Questions
Exam 4: Demand, Supply, and Markets245 Questions
Exam 5: Elasticity of Demand and Supply244 Questions
Exam 5: Appendix--Price Elasticity and Tax Incidence32 Questions
Exam 6: Consumer Choice and Demand171 Questions
Exam 6: Appendix--Indifference Curves and Utility Maximization107 Questions
Exam 7: Production and Cost in the Firm218 Questions
Exam 8: A--Perfect Competition250 Questions
Exam 8: B--Perfect Competition25 Questions
Exam 9: A--Monopoly249 Questions
Exam 9: B--Monopoly18 Questions
Exam 10: Monopolistic Competition and Oligopoly233 Questions
Exam 11: Resource Markets219 Questions
Exam 12: Labor Markets and Labor Unions218 Questions
Exam 13: Capital, Interest, and Corporate Finance190 Questions
Exam 14: Transaction Costs, Imperfect Information, and Behavioral Economics187 Questions
Exam 15: Economic Regulation and Antitrust Policy179 Questions
Exam 16: Public Goods and Public Choice143 Questions
Exam 17: Externalities and the Environment203 Questions
Exam 18: Income Distribution and Poverty130 Questions
Exam 19: International Trade172 Questions
Exam 20: International Finance226 Questions
Exam 21: Economic Development97 Questions
Select questions type
If slope = 2 for a line on a graph with x on the horizontal axis and y on the vertical axis, then if
(Multiple Choice)
4.8/5  (36)
(36)
Exhibit 1-9  Using the values in Exhibit 1-9, calculate the slope of a line graphed with x on the horizontal axis and y on the vertical axis.
(Multiple Choice)
4.9/5 (33)
Suppose y is measured on the vertical axis, x is on the horizontal axis, and the various combinations of x and y are shown by a nonvertical straight line.Which of the following must be true?
(Multiple Choice)
4.8/5 (36)
Most economics graphs reflect the relationship between how many economic variables?
(Multiple Choice)
4.7/5 (30)
Moderate exercise is better than none, but excessive exercise is harmful.What is the shape of the graph of health benefits versus hours of exercise per week if health benefits are measured on the vertical axis and exercise is measured on the horizontal axis?
(Multiple Choice)
4.9/5 (35)
The numerical value of the slope of a line depends in part on the units of measurement used.
(True/False)
4.9/5 (39)
Exhibit 1-7 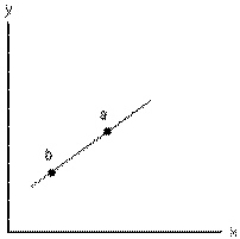 The slope of the straight line in Exhibit 1-7 is
(Multiple Choice)
4.9/5 (30)
Exhibit 1-14 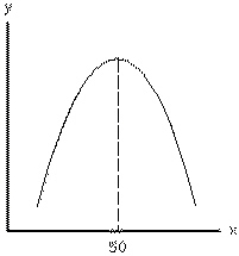 Using Exhibit 1-14, calculate the slope of the curve where x equals 50.
(Multiple Choice)
4.7/5 (30)
Filters
- Essay(0)
- Multiple Choice(0)
- Short Answer(0)
- True False(0)
- Matching(0)