Exam 1: Introduction: What Is Economics
Exam 1: Introduction: What Is Economics163 Questions
Exam 2: The Key Principles of Economics199 Questions
Exam 3: Exchange and Markets136 Questions
Exam 4: Demand, supply, and Market Equilibrium280 Questions
Exam 5: Elasticity: a Measure of Responsiveness173 Questions
Exam 6: Market Efficiency and Government Intervention120 Questions
Exam 7: Consumer Choice: Utility Theory and Insights From Neuroscience116 Questions
Exam 8: Production Technology and Cost163 Questions
Exam 9: Perfect Competition165 Questions
Exam 10: Monopoly and Price Discrimination128 Questions
Exam 11: Market Entry and Monopolistic Competition114 Questions
Exam 12: Oligopoly and Strategic Behavior125 Questions
Exam 13: Controlling Market Power: Antitrust and Regulation84 Questions
Exam 14: Imperfect Information: Adverse Selection and Moral Hazard98 Questions
Exam 15: Public Goods and Public Choice97 Questions
Exam 16: External Costs and Environmental Policy109 Questions
Exam 17: The Labor Market and the Distribution of Income178 Questions
Exam 18: International Trade and Public Policy229 Questions
Select questions type
An example of analysis that involves variables and how they affect one another would include the relationship of the price of CDs to the quantity of CDs purchased.
(True/False)
4.8/5  (33)
(33)
There is a negative relationship between two variables if the two variables:
(Multiple Choice)
4.8/5 (39)
If you use the midpoint method to describe the change in the number of lanes from 1 to 2,then the percent change you would calculate is:
(Multiple Choice)
4.8/5 (48)
A student has a D grade average in her accounting course and a B grade average in her economics course.She decides to study an extra hour for her accounting exam and one less hour for her economics exam hoping to improve her accounting grade while not hurting her economics grade.This is an example of:
(Multiple Choice)
4.9/5 (37)
When a student is thinking at the margin,he analyzes how many more points he would get on his economics final exam if he devotes one more hour for studying.
(True/False)
5.0/5 (29)
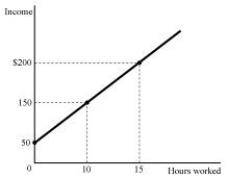 Figure 1.1
-Refer to Figure 1.1.The relationship between hours worked and income,as shown by the graph in Figure 1.1 is:
Figure 1.1
-Refer to Figure 1.1.The relationship between hours worked and income,as shown by the graph in Figure 1.1 is:
(Multiple Choice)
5.0/5 (28)
Using assumptions to make things simpler and focus attention on what really matters is like using a road map to plan a trip.
(True/False)
4.8/5 (37)
Markets do not determine the quantity of goods sold,only the price.
(True/False)
4.7/5 (40)
Imagine that an upward sloping line is depicted in a graph with income per week on the y-axis and hours worked per week on the x-axis.From the graph,we can conclude that:
(Multiple Choice)
4.9/5 (42)
Economists will never reach the same conclusions in their positive analyses.
(True/False)
4.7/5 (41)
According to the Application,giving subsidies for the purchase of hybrid vehicles was the most efficient way for the government to reduce CO2 emissions.
(True/False)
4.7/5 (40)
Which of the following did NOT directly cause the worldwide recession in 2007-2008?
(Multiple Choice)
4.8/5 (41)
Filters
- Essay(0)
- Multiple Choice(0)
- Short Answer(0)
- True False(0)
- Matching(0)