Exam 9: Possibilities, Preferences, and Choices
Exam 1: What Is Economics479 Questions
Exam 2: The Economic Problem439 Questions
Exam 3: Demand and Supply515 Questions
Exam 4: Elasticity533 Questions
Exam 5: Efficiency and Equity449 Questions
Exam 6: Government Actions in Markets410 Questions
Exam 7: Global Markets in Action200 Questions
Exam 8: Utility and Demand364 Questions
Exam 9: Possibilities, Preferences, and Choices464 Questions
Exam 10: Organizing Production385 Questions
Exam 11: Output and Costs494 Questions
Exam 12: Perfect Competition487 Questions
Exam 13: Monopoly606 Questions
Exam 14: Monopolistic Competition320 Questions
Exam 15: Oligopoly280 Questions
Exam 16: Public Choices and Public Goods356 Questions
Exam 17: Externalities and the Environment284 Questions
Exam 18: Markets for Factors of Production382 Questions
Exam 19: Economic Inequality354 Questions
Exam 20: Uncertainty and Information233 Questions
Exam 21: Extension A: Review11 Questions
Exam 22: Extension B: Review25 Questions
Exam 23: Extension C: Review14 Questions
Exam 24: Extension D: Review38 Questions
Exam 25: Extension E: Review11 Questions
Exam 26: Extension F: Review18 Questions
Select questions type
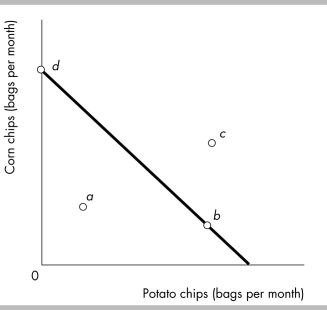 -Given the budget line in the figure above, the combination of chips that is NOT affordable is
(Multiple Choice)
4.8/5  (25)
(25)
 -In an indifference curve/budget line diagram, a consumer's equilibrium consumption combination will occur
(Multiple Choice)
4.9/5 (36)
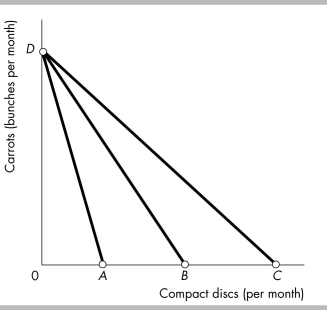 -In the figure above, which budget line results in the most real income in terms of carrots?
(Multiple Choice)
5.0/5 (34)
 -The figure illustrates Sally's budget line and her preferences. Point ________ is Sally's best affordable point, and Sally prefers point ________ to point ________.
(Multiple Choice)
4.8/5 (33)
Holding your income and the price of lobster constant, you can derive your demand curve for steak from an indifference curve/budget line diagram by determining how your consumption of steak changes when the price of a steak changes.
(True/False)
4.7/5 (35)
Why does your marginal rate of substitution between chocolate and vanilla ice cream decline continuously as you move rightward on your indifference curve between the two?
(Essay)
4.8/5 (32)
Jake spends $200 on fried chickens and Pepsi. The price of a fried chicken is $5 and Pepsi is $2.50 per bottle. With the quantity of Pepsi being measured along the vertical axis, the slope of Jake's budget line is ________ per fried chicken.
(Multiple Choice)
4.9/5 (34)
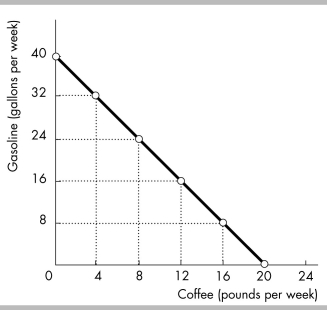 -The figure above shows Sam's budget line. Which of the following combinations of gasoline and coffee are not available to Sam?
(Multiple Choice)
4.9/5 (44)
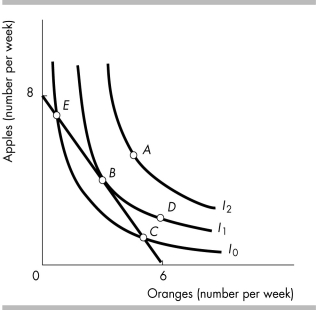
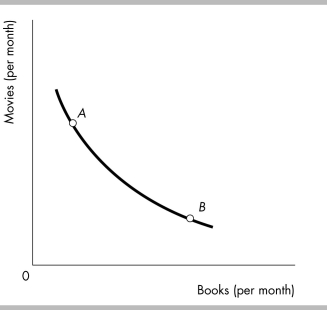 -In the figure above, the MRS at point A is ________ the MRS at point B.
(Multiple Choice)
4.8/5 (35)
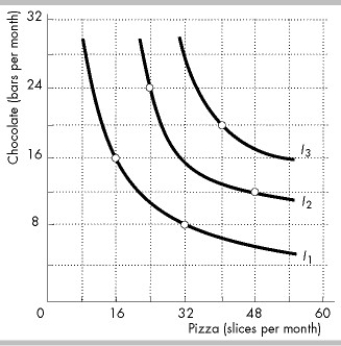 -The indifference curves in the figure above (I1, I2, and I3) reflect Peter's consumption preferences. Peter prefers consuming ________ to consuming ________.
(Multiple Choice)
5.0/5 (32)
 -The higher the price of the good measured on the vertical axis, other thing remaining the same, the flatter the budget line.
(True/False)
4.8/5 (36)
The larger the marginal rate of substitution, the larger is the amount of one good that the consumer is willing to give up in exchange for another good and still remain at the same level of satisfaction.
(True/False)
4.9/5 (32)
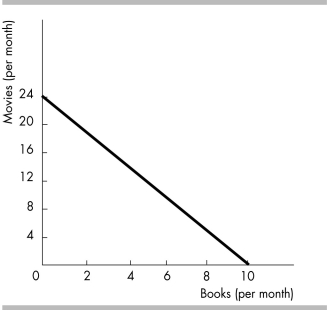 -Consider the budget line in the above figure. If the consumer's income is $240, then the price of a movie is
(Multiple Choice)
4.9/5 (41)
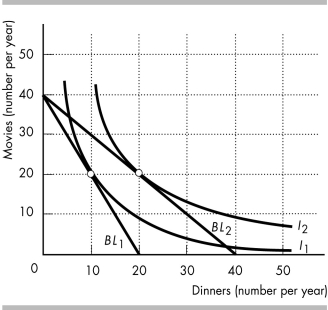
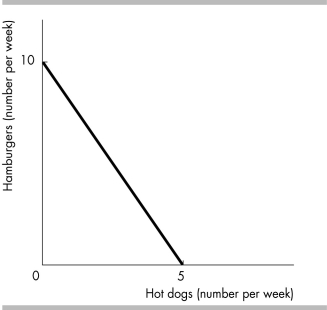 -The figure above shows Ronald's budget line. He has a weekly income of $20, which he spends on hotdogs and hamburgers. Now Ronald's income decreases to $10 per week and the price of a hotdog doubles. Ronald's budget line becomes ________ and ________.
(Multiple Choice)
4.9/5 (35)
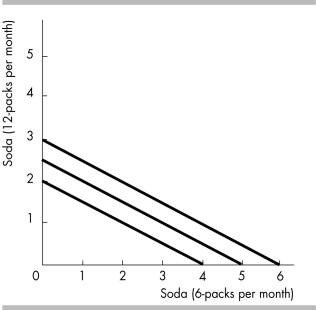
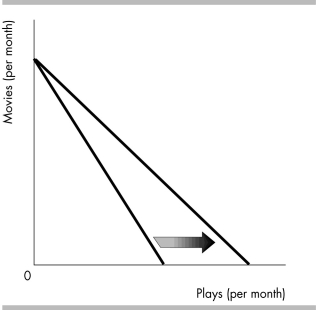 -Suppose the quantity of sodas and the quantity of popcorn are on an indifference curve/budget line diagram. An increase in income shifts the budget line ________ and, if popcorn is a normal good, shifts the demand curve for popcorn ________.
(Multiple Choice)
4.8/5 (38)
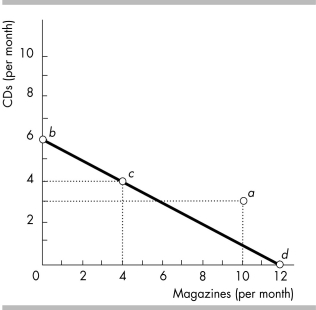 -The above figure gives your budget line between CDs and magazines. The slope of the budget line is ________ CD per magazine.
(Multiple Choice)
4.7/5 (35)
Filters
- Essay(0)
- Multiple Choice(0)
- Short Answer(0)
- True False(0)
- Matching(0)