Exam 5: Efficiency and Equity
Exam 1: What Is Economics479 Questions
Exam 2: The Economic Problem439 Questions
Exam 3: Demand and Supply515 Questions
Exam 4: Elasticity533 Questions
Exam 5: Efficiency and Equity449 Questions
Exam 6: Government Actions in Markets410 Questions
Exam 7: Global Markets in Action200 Questions
Exam 8: Utility and Demand364 Questions
Exam 9: Possibilities, Preferences, and Choices464 Questions
Exam 10: Organizing Production385 Questions
Exam 11: Output and Costs494 Questions
Exam 12: Perfect Competition487 Questions
Exam 13: Monopoly606 Questions
Exam 14: Monopolistic Competition320 Questions
Exam 15: Oligopoly280 Questions
Exam 16: Public Choices and Public Goods356 Questions
Exam 17: Externalities and the Environment284 Questions
Exam 18: Markets for Factors of Production382 Questions
Exam 19: Economic Inequality354 Questions
Exam 20: Uncertainty and Information233 Questions
Exam 21: Extension A: Review11 Questions
Exam 22: Extension B: Review25 Questions
Exam 23: Extension C: Review14 Questions
Exam 24: Extension D: Review38 Questions
Exam 25: Extension E: Review11 Questions
Exam 26: Extension F: Review18 Questions
Select questions type
The table below shows the demand schedules for pizza for Abby and Barry who are the only buyers in the market. 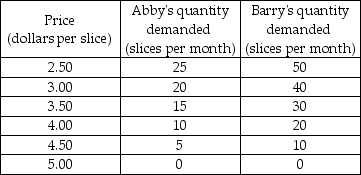 -Based on the table, what is Abby's marginal benefit from the 10th slice of pizza?
(Multiple Choice)
4.8/5  (40)
(40)
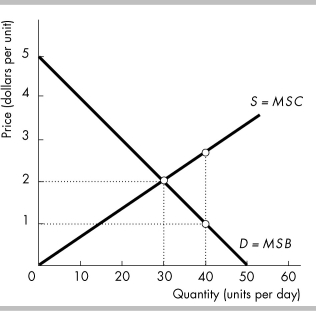 -In the above figure, suppose the quantity produced is 40. Then
(Multiple Choice)
4.8/5 (35)
Which of the following statements about supply curves is correct? I. A supply curve also can be a marginal cost curve.
II) A supply curve tells the quantity of other goods and services that sellers must give up to produce another unit of the good.
(Multiple Choice)
4.9/5 (34)
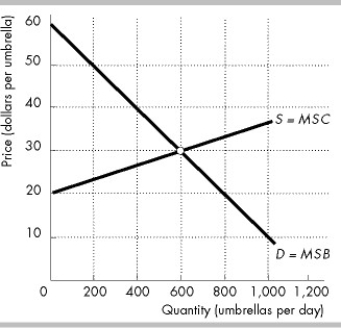 -The figure above shows the market for umbrellas in Sunville. When the market for umbrellas in Sunville is in equilibrium, what is the total surplus?
(Multiple Choice)
4.8/5 (36)
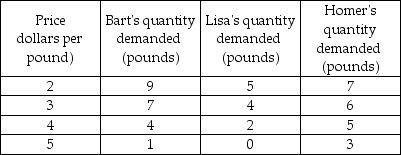 -Homer, Bart, and Lisa are the only consumers in the market. Using the information in the above table, what is the market demand for chocolate chip cookies at $4.00 per pound?
(Multiple Choice)
5.0/5 (41)
Which of the following arguments support the proposition that society should accept at least some income inequality?
(Multiple Choice)
4.9/5 (33)
Producer surplus is the price of a good minus the opportunity cost of producing it, summed over the quantity produced.
(True/False)
4.8/5 (39)
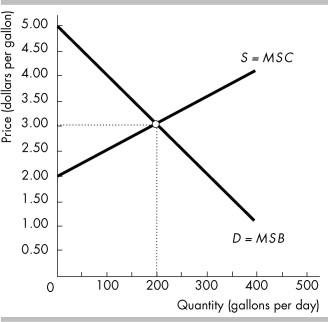 -The figure above shows the market for milk. If the government pays the milk producers a subsidy and production increases to 300 gallons per day,
(Multiple Choice)
4.8/5 (30)
When a deadweight loss occurs in a market, we can be certain that
(Multiple Choice)
4.8/5 (33)
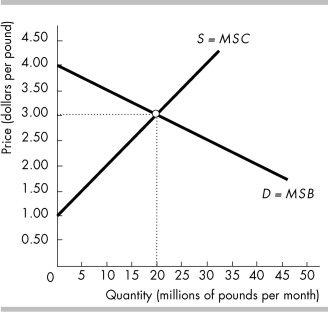 -The figure above shows the market for coffee If the government pays the coffee producers a subsidy and production increases to 30 million pounds per day, the deadweight loss is
(Multiple Choice)
4.8/5 (41)
What are some of the potential obstacles that can prevent a market from reaching the efficient outcome? Briefly define each obstacle.
(Essay)
5.0/5 (45)
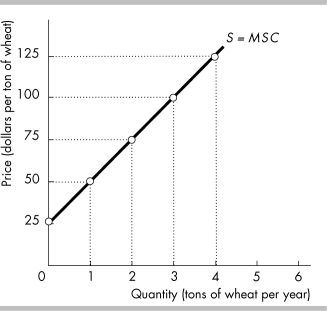 -In the above figure, if the market price rises from $100 to $125 per ton of wheat, then producer surplus
(Multiple Choice)
4.9/5 (28)
-The figure above shows the market for coffee. Coffee is a normal good. If consumers' incomes fall, the efficient quantity of coffee will ________ and the producer surplus will ________.
(Multiple Choice)
4.8/5 (36)
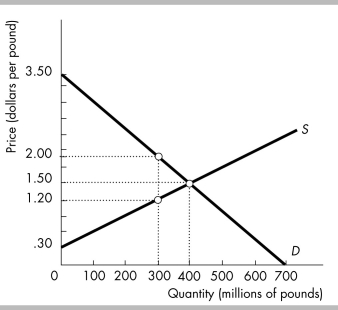
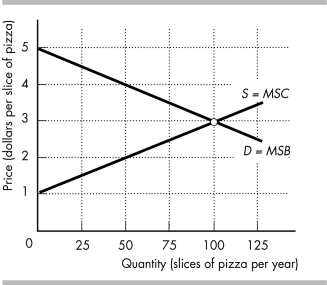 -The figure above shows the market for pizza.
a) If the price of a slice of pizza is $3, what is the consumer surplus of the 50th slice?
b) If the price of a slice of pizza is $3, what is the producer surplus of the 50th slice?
c) What is the efficient quantity? What is the equilibrium quantity? What is the deadweight loss when the equilibrium quantity is produced?
-The figure above shows the market for pizza.
a) If the price of a slice of pizza is $3, what is the consumer surplus of the 50th slice?
b) If the price of a slice of pizza is $3, what is the producer surplus of the 50th slice?
c) What is the efficient quantity? What is the equilibrium quantity? What is the deadweight loss when the equilibrium quantity is produced?
(Essay)
4.8/5 (34)
The table below shows the supply schedules for Fred's Pizza and Johnny's Pizza, the only sellers of pizza in the market. 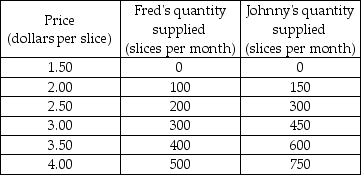 -Using the table, Johnny's marginal cost of the 600th slice of pizza is
(Multiple Choice)
5.0/5 (41)
Is the marginal benefit someone receives from a good or service the same as the price the person pays? Explain your answer.
(Essay)
4.8/5 (42)
 -At the competitive market outcome in the above figure, the
(Multiple Choice)
4.7/5 (40)
In the market for DVDs, 500,000 DVDs a month are available. The value people place on the 500,000th DVD a month is less than the marginal social cost of producing it. Resource use ________.
(Multiple Choice)
4.9/5 (38)
-The figure above shows the market for umbrellas in Sunville. What is the marginal social benefit that Sunville consumers receive from the 200th umbrella bought?
(Multiple Choice)
4.9/5 (44)
Filters
- Essay(0)
- Multiple Choice(0)
- Short Answer(0)
- True False(0)
- Matching(0)