Exam 1: What Is Economics
Exam 1: What Is Economics198 Questions
Exam 2: The Economic Problem143 Questions
Exam 3: Demand and Supply178 Questions
Exam 4: Elasticity168 Questions
Exam 5: Efficiency and Equity110 Questions
Exam 6: Government Actions in Markets119 Questions
Exam 7: Global Markets in Action129 Questions
Exam 8: Utility and Demand110 Questions
Exam 9: Possibilities,preferences,and Choices113 Questions
Exam 10: Organizing Production104 Questions
Exam 11: Output and Costs133 Questions
Exam 12: Perfect Competition118 Questions
Exam 13: Monopoly107 Questions
Exam 14: Monopolistic Competition111 Questions
Exam 15: Oligopoly97 Questions
Exam 16: Externalities111 Questions
Exam 17: Public Goods and Common Resources89 Questions
Exam 18: Markets for Factors of Production119 Questions
Exam 19: Economic Inequality117 Questions
Select questions type
A tractor is an example of which of the following factors of production?
Free
(Multiple Choice)
4.8/5  (34)
(34)
Correct Answer: Verified
A
Use the figure below to answer the following questions.
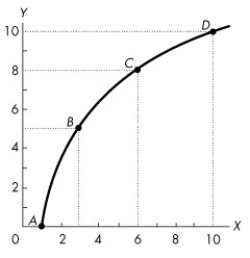 Figure 1A.3.3
-Figure 1A.3.3 illustrates two variables,x and y,which are
Figure 1A.3.3
-Figure 1A.3.3 illustrates two variables,x and y,which are
Free
(Multiple Choice)
5.0/5 (40)
Correct Answer:Verified
C
Use the table below to answer the following questions.
Table 1A.4.2
Family income (dollars per week) Price of strawberries (dollars per box) Number of boxes purchased per week 300 1.00 5 300 1.25 3 300 1.50 2 400 1.00 7 400 1.25 5 400 1.50 4
-Given the data in Table 1A.4.2,holding income constant,the graph relating the price of strawberries,measured on the y-axis and the purchases of strawberries,measured on the x-axis
(Multiple Choice)
4.7/5 (34)
Use the figure below to answer the following questions.
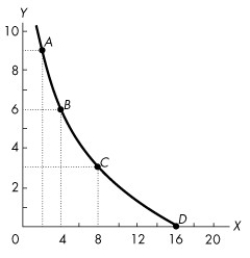 Figure 1A.3.4
-Refer to Figure 1A.3.4.In Figure 1A.3.4,the slope at point B
Figure 1A.3.4
-Refer to Figure 1A.3.4.In Figure 1A.3.4,the slope at point B
(Multiple Choice)
4.9/5 (40)
Use the figure below to answer the following question.
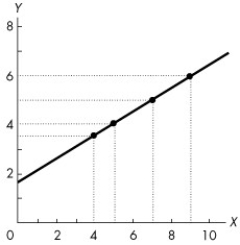 Figure 1A.2.1
-In Figure 1A.2.1,the value of y is 5 when x is
Figure 1A.2.1
-In Figure 1A.2.1,the value of y is 5 when x is
(Multiple Choice)
4.8/5 (27)
Consider graph (a)of Figure 1A.1.5.Which one of the following statements is true?
(Multiple Choice)
4.8/5 (30)
Which of the following relates factors of production to the sources of income correctly?
(Multiple Choice)
4.8/5 (27)
Consider graph (b)of Figure 1A.1.5.Which one of the following statements is true?
(Multiple Choice)
4.8/5 (32)
Which statement about incomes earned by factors of production is false?
(Multiple Choice)
5.0/5 (35)
Use the figure below to answer the following question.
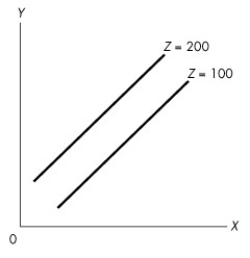 Figure 1A.4.4
-Consider the following information on cola sales by number of cases for a typical university residence floor: Temp.Price (dollars per case)
(°C)10.00 12.50 15.00 17.50
15 50 40 30 20
20 60 50 40 30
25 70 60 50 40
30 80 70 60 50
35 90 80 70 60
Cola sales and temperature are
Figure 1A.4.4
-Consider the following information on cola sales by number of cases for a typical university residence floor: Temp.Price (dollars per case)
(°C)10.00 12.50 15.00 17.50
15 50 40 30 20
20 60 50 40 30
25 70 60 50 40
30 80 70 60 50
35 90 80 70 60
Cola sales and temperature are
(Multiple Choice)
4.9/5 (29)
When a textile firm decides to produce more silk fabric and less cotton fabric,it is answering the ________ question.
(Multiple Choice)
4.9/5 (33)
The two big economic questions include all of the following except
(Multiple Choice)
4.9/5 (35)
Filters
- Essay(0)
- Multiple Choice(0)
- Short Answer(0)
- True False(0)
- Matching(0)