Exam 24: From the Short Run to the Long Run: the Adjustment of Factor Prices
Exam 1: Economic Issues and Concepts136 Questions
Exam 2: Economic Theories, data, and Graphs147 Questions
Exam 3: Demand, supply, and Price166 Questions
Exam 19: What Macroeconomics Is All About116 Questions
Exam 20: The Measurement of National Income115 Questions
Exam 21: The Simplest Short-Run Macro Model155 Questions
Exam 22: Adding Government and Trade to the Simple Macro Model131 Questions
Exam 23: Real Gdp and the Price Level in the Short Run138 Questions
Exam 24: From the Short Run to the Long Run: the Adjustment of Factor Prices149 Questions
Exam 25: Long-Run Economic Growth130 Questions
Exam 26: Money and Banking124 Questions
Exam 27: Money, interest Rates, and Economic Activity130 Questions
Exam 28: Monetary Policy in Canada116 Questions
Exam 29: Inflation and Disinflation120 Questions
Exam 30: Unemployment Fluctuations and the Nairu118 Questions
Exam 31: Government Debt and Deficits125 Questions
Exam 32: The Gains From International Trade130 Questions
Exam 33: Trade Policy120 Questions
Exam 34: Exchange Rates and the Balance of Payments155 Questions
Select questions type
Suppose Canada's economy is in a long-run equilibrium with real GDP equal to potential output.Now suppose there is an increase in the Canadian-dollar price of all imported raw materials.In the short run,________.In the long run,________.
(Multiple Choice)
4.9/5  (39)
(39)
The diagram below shows an AD/AS model for a hypothetical economy.The economy begins in long-run equilibrium at point A.  FIGURE 24-3 Refer to Figure 24-3.Which of the following events could have shifted the AD curve from
  to
to  ?
?
(Multiple Choice)
4.8/5 (34)
Consider the AD/AS model after factor prices have fully adjusted to output gaps.An increase in the level of potential output,with aggregate demand constant,will
(Multiple Choice)
4.7/5 (35)
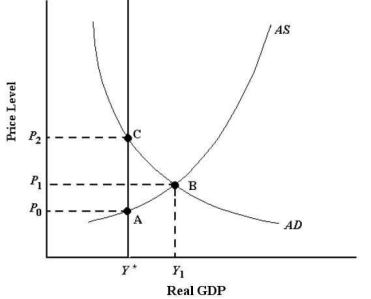 FIGURE 24-2 Refer to Figure 24-2.If the economy is currently in a short-run equilibrium at
  ,the economy is experiencing
(Multiple Choice)
4.7/5 (33)
One advantage of using expansionary fiscal policy rather than relying on automatic adjustment to recover from a recessionary gap is that
(Multiple Choice)
4.8/5 (33)
The diagram below shows an AD/AS model for a hypothetical economy.The economy begins in long-run equilibrium at point A.  FIGURE 24-3 Refer to Figure 24-3.A negative shock to the economy shifts the AD curve from
  to
to  .At the new short-run equilibrium,the price level is ________ and real GDP is ________.
(Multiple Choice)
4.8/5 (42)
Consider the basic AD/AS macro model in long-run equilibrium.An expansionary AD shock would have ________ output effect in the short run and ________ output effect in the long run.
(Multiple Choice)
5.0/5 (31)
Automatic fiscal stabilizers ________ the impact of demand or supply shocks on the economy since government's net tax revenues ________ during booms and ________ during recessions.
(Multiple Choice)
4.8/5 (44)
The "paradox of thrift" refers to the understandable tendency of people who are worried about their economic situation to ________ their saving,but in aggregate this behaviour causes a ________ recession.
(Multiple Choice)
4.9/5 (34)
The table below shows data for five economies of similar size.Real GDP is measured in billions of dollars.Assume that potential output for each economy is $340 billion. 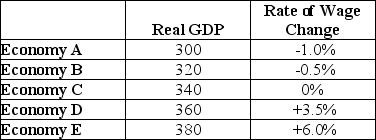 TABLE 24-1 Refer to Table 24-1.In which economy is there the most unused capacity?
(Multiple Choice)
5.0/5 (46)
Suppose Canada's economy is in a long-run equilibrium with real GDP equal to potential output.Now suppose there is an unexpected and sharp reduction in desired business investment expenditure.In the short run,________.In the long run,________.
(Multiple Choice)
4.8/5 (38)
 FIGURE 24-2 Refer to Figure 24-2.Suppose the economy is in equilibrium at Y1.The economy's automatic adjustment process will restore potential output,Y*,through
(Multiple Choice)
4.7/5 (41)
Suppose the following conditions are present in the economy: - firms are increasing output to meet rising demand for their goods
- workers are able to demand higher wages as firms try to bid workers away from other firms
Which of the following statements describes the adjustment that will happen in the AD/AS macro model?
(Multiple Choice)
4.7/5 (34)
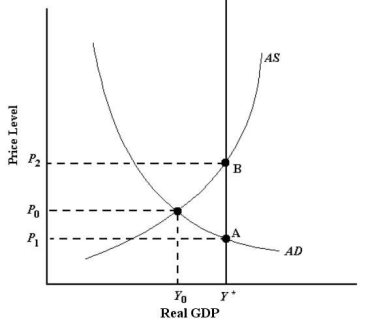 FIGURE 24-1 Refer to Figure 24-1.If the economy is currently producing output of Y0 and wages are sticky downwards,then the
(Multiple Choice)
4.8/5 (37)
Consider the AD/AS model and suppose the economy begins at potential output.The effect of a negative AS shock on real GDP will be reversed in the long run with a ________ shift in ________.
(Multiple Choice)
4.8/5 (37)
The diagram below shows an AD/AS model for a hypothetical economy.The economy begins in long-run equilibrium at point A. 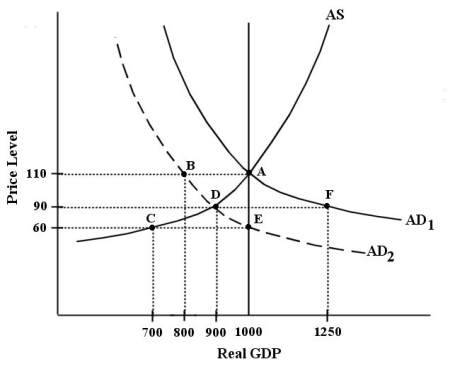 FIGURE 24-3 Refer to Figure 24-3.Following the negative AD shock shown in the diagram (from
  to
to  ),the adjustment process will take the economy to a long-run equilibrium where the price level is ________ and real GDP is ________.
(Multiple Choice)
5.0/5 (36)
What economists sometimes call the "long-run aggregate supply curve" is
(Multiple Choice)
4.9/5 (38)
Consider the AD/AS model.Since output in the long run is determined by Y*,the only role of the AD curve is to determine the price level.This is true because
(Multiple Choice)
5.0/5 (31)
Which of the following statements about the AD/AS macro model in the long run is correct?
(Multiple Choice)
4.8/5 (30)
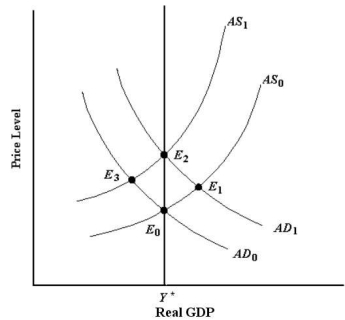 FIGURE 24-5 Refer to Figure 24-5.Following a positive demand shock that takes the economy from E0 to E1,the movement of the economy from E1 to E2 indicates that
(Multiple Choice)
4.8/5 (40)
Filters
- Essay(0)
- Multiple Choice(0)
- Short Answer(0)
- True False(0)
- Matching(0)