Exam 2: Economic Theories, data, and Graphs
Exam 1: Economic Issues and Concepts136 Questions
Exam 2: Economic Theories, data, and Graphs147 Questions
Exam 3: Demand, supply, and Price166 Questions
Exam 19: What Macroeconomics Is All About116 Questions
Exam 20: The Measurement of National Income115 Questions
Exam 21: The Simplest Short-Run Macro Model155 Questions
Exam 22: Adding Government and Trade to the Simple Macro Model131 Questions
Exam 23: Real Gdp and the Price Level in the Short Run138 Questions
Exam 24: From the Short Run to the Long Run: the Adjustment of Factor Prices149 Questions
Exam 25: Long-Run Economic Growth130 Questions
Exam 26: Money and Banking124 Questions
Exam 27: Money, interest Rates, and Economic Activity130 Questions
Exam 28: Monetary Policy in Canada116 Questions
Exam 29: Inflation and Disinflation120 Questions
Exam 30: Unemployment Fluctuations and the Nairu118 Questions
Exam 31: Government Debt and Deficits125 Questions
Exam 32: The Gains From International Trade130 Questions
Exam 33: Trade Policy120 Questions
Exam 34: Exchange Rates and the Balance of Payments155 Questions
Select questions type
The statement that a country's rate of economic growth is positively influenced by its level of investment is an example of a(n)
Free
(Multiple Choice)
4.8/5  (37)
(37)
Correct Answer: Verified
D
Suppose there is a linear relationship between the ticket price (P)to a university basketball game and the number of tickets sold (Q).If the ticket price is $20,then 600 tickets are sold; if the ticket price is $8,then 3000 tickets are sold.What is the slope of the function if Q is plotted on the horizontal axis and P is plotted on the vertical axis?
Free
(Multiple Choice)
4.8/5 (32)
Correct Answer:Verified
A
The base year for an index number is
Free
(Multiple Choice)
4.9/5 (30)
Correct Answer:Verified
D
Which of the following statements belongs more properly in the field of normative economics than positive economics?
(Multiple Choice)
4.9/5 (33)
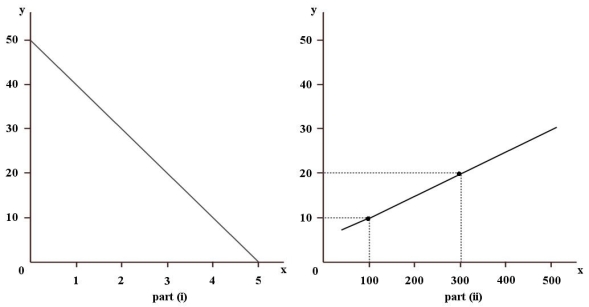 FIGURE 2-1 Refer to Figure 2-1.What is the slope of the line in part (ii)of the figure?
(Multiple Choice)
4.7/5 (45)
Suppose Ahmoud would spend $1200 per year on travel,even if his annual income were zero.As his income rises,he would spend 20% of each additional dollar of income on travel.Choose the correct mathematical equation that describes the functional relation between his travel spending (T)and his income (Y).
(Multiple Choice)
4.9/5 (35)
Suppose we have data for 1000 students for a period of one year.The data show that those students who spend more hours studying have a higher grade point average (GPA).We can say that
(Multiple Choice)
4.8/5 (26)
 FIGURE 2-4 Refer to Figure 2-4.This non-linear function shows that over the range shown,
(Multiple Choice)
4.8/5 (34)
The table below shows hypothetical monthly cell phone plan fees for the identical service over several years. 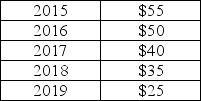 TABLE 2-2 Refer to Table 2-2.Assume that 2015 is used as the base year,with the index number = 100.Which of the following series is the correct set of index numbers for the monthly cell phone charges from 2015 to 2019?
(Multiple Choice)
4.9/5 (36)
Negatively related variables change such that as the value of one variable
(Multiple Choice)
5.0/5 (38)
The table below shows the approximate value of Canada's crude oil and natural gas exports over a 5-year period.The amounts shown are billions of dollars.  TABLE 2-7 Refer to Table 2-7.Assume that 2013 is the base year,with an index number = 100.What is the percentage change in the value of exports of natural gas from 2013 to 2017?
(Multiple Choice)
4.9/5 (31)
Consider the following equation: Y = 10 + 5X - X2.This equation is an expression of
(Multiple Choice)
4.8/5 (24)
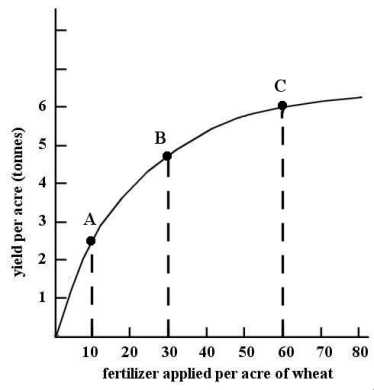 FIGURE 2-4 Refer to Figure 2-4.If we want to know the marginal response of "yield per acre" due to a change in "fertilizer applied per acre of wheat" at point B,then we should determine the
(Multiple Choice)
4.9/5 (25)
The table below shows the approximate value of Canada's crude oil and natural gas exports over a 5-year period.The amounts shown are billions of dollars.  TABLE 2-7 Refer to Table 2-7.Assume that 2013 is the base year,with an index number = 100.What is the percentage change in the value of exports of crude oil from 2013 to 2017?
(Multiple Choice)
4.7/5 (32)
In a co-ordinate graph with Y on the vertical axis and X on the horizontal axis,the variable X is positive and the variable Y is positive in the ________quadrant.
(Multiple Choice)
4.9/5 (35)
An economist has data showing Canadian disposable income and consumption spending for the years 1960-2018.The best way to illustrate these data is
(Multiple Choice)
4.9/5 (41)
Suppose a particular theory predicts that on Monday,Wednesday,and Friday the stock market will rise and that on Tuesday and Thursday the stock market will fall.If an economist tests this theory and finds that over a six-month period the theory predicts accurately,the economist would likely say that the theory
(Multiple Choice)
4.9/5 (32)
Suppose Jillian will spend $250 on books per year,even if her income is zero.As her income rises,she will spend 8% of each additional dollar of income on books.Choose the correct mathematical equation that describes the functional relation between her spending on books (B)and her income (Y).
(Multiple Choice)
4.9/5 (37)
An economist collects data comparing per-capita expenditures on health care across provinces and territories for the year 2018.The best way to illustrate this data is
(Multiple Choice)
4.8/5 (30)
The table below shows the approximate value of Canada's crude oil and natural gas exports over a 5-year period.The amounts shown are billions of dollars. 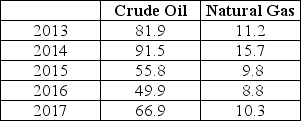 TABLE 2-7 Refer to Table 2-7.Assume that 2013 is the base year,with an index number = 100.What is the index number for the value of crude oil exports in 2017?
(Multiple Choice)
4.8/5 (25)
Filters
- Essay(0)
- Multiple Choice(0)
- Short Answer(0)
- True False(0)
- Matching(0)