Exam 5: The Behaviour of Interest Rates
Exam 1: Why Study Money, Banking, and Financial Markets114 Questions
Exam 2: An Overview of the Financial System113 Questions
Exam 3: What Is Money110 Questions
Exam 4: The Meaning of Interest Rates109 Questions
Exam 5: The Behaviour of Interest Rates113 Questions
Exam 6: The Risk and Term Structure of Interest Rates110 Questions
Exam 7: The Stock Market, the Theory of Rational Expectations, and the Efficient Market Hypothesis93 Questions
Exam 8: An Economic Analysis of Financial Structure110 Questions
Exam 9: Economic Analysis of Financial Regulation101 Questions
Exam 10: Banking Industry: Structure and Competition112 Questions
Exam 11: Financial Crises100 Questions
Exam 12: Banking and the Management of Financial Institutions139 Questions
Exam 13: Risk Management With Financial Derivatives96 Questions
Exam 14: Central Banks and the Bank of Canada110 Questions
Exam 15: The Money Supply Process164 Questions
Exam 16: Tools of Monetary Policy110 Questions
Exam 17: The Conduct of Monetary Policy: Strategy and Tactics116 Questions
Exam 18: The Foreign Exchange Market131 Questions
Exam 19: The International Financial System140 Questions
Exam 20: Quantity Theory, Inflation, and the Demand for Money109 Questions
Exam 21: The Is Curve139 Questions
Exam 22: The Monetary Policy and Aggregate Demand Curves108 Questions
Exam 23: Aggregate Demand and Supply Analysis120 Questions
Exam 24: Monetary Policy Theory92 Questions
Exam 25: The Role of Expectations in Monetary Policy110 Questions
Exam 26: Transmission Mechanisms of Monetary Policy108 Questions
Select questions type
In the loanable funds framework, the demand curve of loanable funds is ________.
(Multiple Choice)
4.8/5  (37)
(37)
An increase in an asset's expected return relative to that of an alternative asset, holding everything else constant, ________ the quantity demanded of the asset.
(Multiple Choice)
4.7/5 (36)
Pieces of property that serve as a store of value are called ________.
(Multiple Choice)
4.8/5 (40)
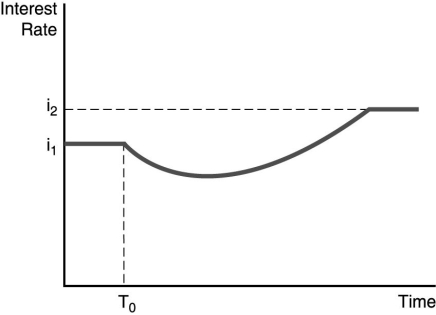 -The figure above illustrates the effect of an increased rate of money supply growth at time period T0. From the figure, one can conclude that the ________.
(Multiple Choice)
4.8/5 (36)
When the inflation rate is expected to increase, the ________ for bonds falls, while the ________ curve shifts to the right, everything else held constant.
(Multiple Choice)
4.9/5 (41)
In the market for money, an interest rate below equilibrium results in an excess ________ money and the interest rate will ________.
(Multiple Choice)
4.9/5 (32)
Interest rates increased continuously during the 1970s. The most likely explanation is ________.
(Multiple Choice)
4.7/5 (33)
If housing prices are expected to increase, then, other things equal, the demand for houses will ________ and that of Treasury bills will ________.
(Multiple Choice)
4.7/5 (30)
-The figure above illustrates the effect of an increased rate of money supply growth at time period T0. From the figure, one can conclude that the ________.
(Multiple Choice)
4.7/5 (38)
A return to the gold standard, that is, using gold for money will ________ the ________ for gold, ________ its price, everything else held constant.
(Multiple Choice)
4.7/5 (35)
Everything else held constant, when households save less, wealth and the demand for bonds ________ and the bond demand curve shifts ________.
(Multiple Choice)
4.9/5 (37)
In the loanable funds framework, the ________ curve of bonds is equivalent to the ________ curve of loanable funds.
(Multiple Choice)
4.8/5 (37)
During business cycle expansions when income and wealth are rising, the demand for bonds ________ and the demand curve shifts to the ________, everything else held constant.
(Multiple Choice)
4.8/5 (39)
Holding all other factors constant, the quantity demanded of an asset is ________.
(Multiple Choice)
4.7/5 (39)
If gold becomes acceptable as a medium of exchange, the demand for gold will ________ and the demand for bonds will ________, everything else held constant.
(Multiple Choice)
4.8/5 (35)
An increase in the expected rate of inflation will ________ the expected return on bonds relative to the that on ________ assets, everything else held constant.
(Multiple Choice)
4.8/5 (30)
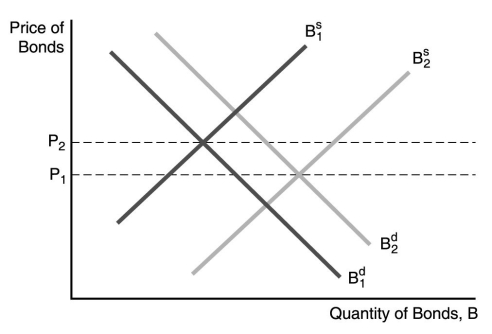 -In the figure above, a factor that could cause the supply of bonds to increase (shift to the right) is ________.
(Multiple Choice)
4.8/5 (32)
Both the CAPM and APT suggest that an asset should be priced so that it has a higher expected return ________.
(Multiple Choice)
4.7/5 (40)
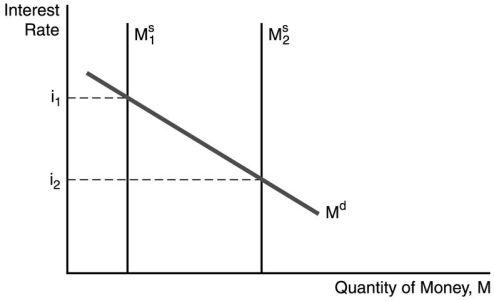 -In the figure above, the factor responsible for the decline in the interest rate is ________.
(Multiple Choice)
4.8/5 (30)
Filters
- Essay(0)
- Multiple Choice(0)
- Short Answer(0)
- True False(0)
- Matching(0)