Exam 5: Elasticity
Exam 1: An Introduction to the Economic Way of Thinking34 Questions
Exam 2: Production Possibilities39 Questions
Exam 3: Demand Supply39 Questions
Exam 4: Consumer Surplus, Producer Surplus, and Economic Efficiency32 Questions
Exam 5: Elasticity34 Questions
Exam 6: Measuring Economic Activity36 Questions
Exam 7: Inflation and the Measurement of Prices37 Questions
Exam 8: The Power and Limits of Markets35 Questions
Exam 9: Wage Determination and Superstar Salaries33 Questions
Exam 10: The Minimum Wage31 Questions
Exam 11: International Trade of Goods37 Questions
Exam 12: Immigration and the International Trade of Labor40 Questions
Exam 13: Foreign Exchange and the International Trade of Money33 Questions
Exam 14: Farm Policy36 Questions
Exam 15: The Economics of Illegal Drugs30 Questions
Exam 16: Pollution, the Environment, and Global Warming35 Questions
Exam 17: The Economics of Education31 Questions
Exam 18: Competition and Monopoly40 Questions
Exam 19: The Economics of Labor Market Discrimination33 Questions
Exam 20: Poverty and the Distribution of Income37 Questions
Exam 21: The Economics of Health Care39 Questions
Exam 22: Monetary Policy and the Federal Reserve40 Questions
Exam 23: Fiscal Policy and the Federal Budget40 Questions
Select questions type
Use Figure 1 to answer questions
Figure SEQ Figure 1: Elasticities of Demand 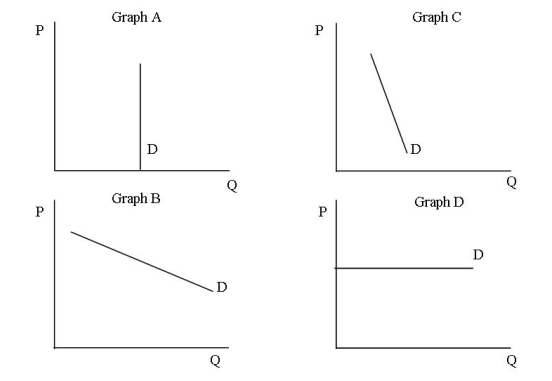 -Which of the graphs illustrate a good whose percentage change in quantity demanded is greater than the percentage change in price?
(Multiple Choice)
4.8/5  (43)
(43)
You have exclusive rights for the sale of liquid beverages at the college games.Outside beverages are not allowed inside the stadium.Your friend, currently enrolled in an economics class, suggests that you decrease the price of your beverages to increase the quantity sold.Explain why, or why not, your friend is correct.
(Essay)
4.8/5 (40)
Use Figure 1 to answer questions
Figure SEQ Figure 1: Elasticities of Demand
-Which of the graphs illustrate a good whose percentage change in quantity demanded is less than the percentage change in price?
(Multiple Choice)
4.8/5 (40)
The amount of money earned when a supplier sells a given quantity of a good is
(Multiple Choice)
4.8/5 (38)
If the elasticity of demand is greater than one, the price elasticity of demand is
(Multiple Choice)
4.9/5 (45)
Reference: Use Figure 2 to answer questions
Figure SEQ Figure 2: Demand for Widgets 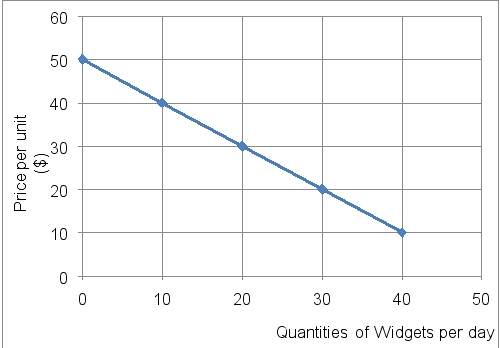 -If the price of a widget increases from $10 to $20 the absolute value of the price elasticity of demand is
(Multiple Choice)
4.7/5 (31)
The measurement of responsiveness between two variables is known as
(Multiple Choice)
4.7/5 (36)
Use Figure 1 to answer questions
Figure SEQ Figure 1: Elasticities of Demand
-Which of the graphs illustrate a relatively elastic demand curve?
(Multiple Choice)
4.9/5 (32)
If the price of a widget increases from $10 to $20 which of the following would be the expected result
(Multiple Choice)
4.7/5 (45)
All of the following would result in a higher price elasticity of demand except
(Multiple Choice)
4.7/5 (31)
Use Figure 1 to answer questions
Figure SEQ Figure 1: Elasticities of Demand
-Which of the graphs illustrate a perfectly inelastic demand curve?
(Multiple Choice)
4.8/5 (28)
Use the following information to answer questions
Price Elasticity of Dernard Good A 4.5 Good B .45 Good C .45 Good D 45
-If the price elasticity of demand for a product is equal to 0.7, then a 5 percent increase in price will
(Multiple Choice)
4.8/5 (33)
When a given percent change in the price of a good causes a larger percent change in the quantity demanded of the good the good is considered
(Multiple Choice)
4.9/5 (35)
Filters
- Essay(0)
- Multiple Choice(0)
- Short Answer(0)
- True False(0)
- Matching(0)