Exam 23: Output and Prices in the Short Run
Exam 1: Economic Issues and Concepts130 Questions
Exam 2: Economic Theories, Data, and Graphs140 Questions
Exam 3: Demand, Supply, and Price161 Questions
Exam 4: Elasticity160 Questions
Exam 5: Price Controls and Market Efficiency125 Questions
Exam 6: Consumer Behaviour140 Questions
Exam 7: Producers in the Short Run144 Questions
Exam 8: Producers in the Long Run141 Questions
Exam 9: Competitive Markets153 Questions
Exam 10: Monopoly, Cartels, and Price Discrimination126 Questions
Exam 11: Imperfect Competition and Strategic Behaviour126 Questions
Exam 12: Economic Efficiency and Public Policy123 Questions
Exam 13: How Factor Markets Work124 Questions
Exam 14: Labour Markets and Income Inequality117 Questions
Exam 16: Market Failures and Government Intervention123 Questions
Exam 17: The Economics of Environmental Protection133 Questions
Exam 18: Taxation and Public Expenditure121 Questions
Exam 19: What Macroeconomics Is All About116 Questions
Exam 20: The Measurement of National Income117 Questions
Exam 21: The Simplest Short-Run Macro Model156 Questions
Exam 22: Adding Government and Trade to the Simple Macro Model132 Questions
Exam 23: Output and Prices in the Short Run142 Questions
Exam 24: From the Short Run to the Long Run: the Adjustment of Factor Prices148 Questions
Exam 25: Long-Run Economic Growth132 Questions
Exam 26: Money and Banking119 Questions
Exam 27: Money, Interest Rates, and Economic Activity135 Questions
Exam 28: Monetary Policy in Canada122 Questions
Exam 29: Inflation and Disinflation123 Questions
Exam 30: Unemployment Fluctuations and the Nairu120 Questions
Exam 31: Government Debt and Deficits129 Questions
Exam 32: The Gains From International Trade127 Questions
Exam 33: Trade Policy126 Questions
Exam 34: Exchange Rates and the Balance of Payments161 Questions
Select questions type
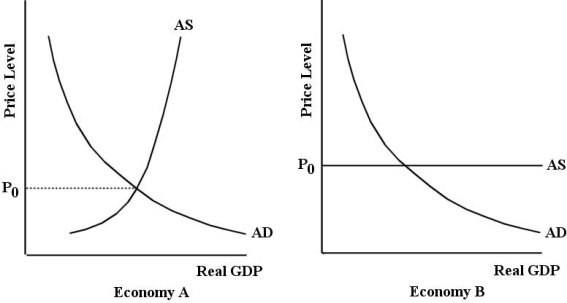 FIGURE 23-3
-Refer to Figure 23-3. Which of the following statements correctly describes the difference between the multipliers in response to an increase in autonomous expenditure) in Economy A and Economy B? The multiplier in Economy A is while the multiplier in Economy B is .
FIGURE 23-3
-Refer to Figure 23-3. Which of the following statements correctly describes the difference between the multipliers in response to an increase in autonomous expenditure) in Economy A and Economy B? The multiplier in Economy A is while the multiplier in Economy B is .
(Multiple Choice)
4.9/5  (34)
(34)
Over the horizontal range of the economyʹs AS curve assuming such a range exists), a rightward shift of the
AD curve will result in
(Multiple Choice)
4.7/5 (41)
Which of the following would cause a positive aggregate demand shock, but leave the aggregate supply curve unaffected?
(Multiple Choice)
4.8/5 (35)
The aggregate supply curve tends to be relatively steep when GDP is above potential output because firms are operating above and are rising rapidly.
(Multiple Choice)
4.8/5 (31)
Consider the basic AD/AS model. When wage rates rise faster than the increase in labour productivity, the
(Multiple Choice)
4.7/5 (45)
If the economy is in macroeconomic equilibrium with a vertical AS curve, and then aggregate demand decreases, we expect the AE function to shift to a
(Multiple Choice)
4.8/5 (38)
An exogenous fall in the domestic price level causes an increase in real wealth and
(Multiple Choice)
4.8/5 (36)
Consider the basic AD/AS model. A rise in an input price like the wage rate would be expected to create a new macroeconomic equilibrium, which in comparison to the original equilibrium, has a price level that is
(Multiple Choice)
4.8/5 (35)
Consider a simple macro model with a given price level and demand-determined output. An exogenous change in the price level causes a
(Multiple Choice)
4.8/5 (33)
Consider two economies, A and B. Economy A has a marginal propensity to consume of 0.9, a net tax rate of 0.3 and a marginal propensity to import of 0.3. Economy B has a marginal propensity to consume of 0.9, a net tax rate of 0.1 and a marginal propensity to import of 0.3. Suppose there is an increase in autonomous investment of $5 billion in each of these economies. Which of the following statements is true?
(Multiple Choice)
4.8/5 (37)
Which of the following would likely cause an upward parallel shift in the AE curve and a rightward shift in the
AD curve?
(Multiple Choice)
5.0/5 (32)
In a macro model with a constant price level, an increase in government purchases will cause the AE curve to shift
(Multiple Choice)
4.8/5 (37)
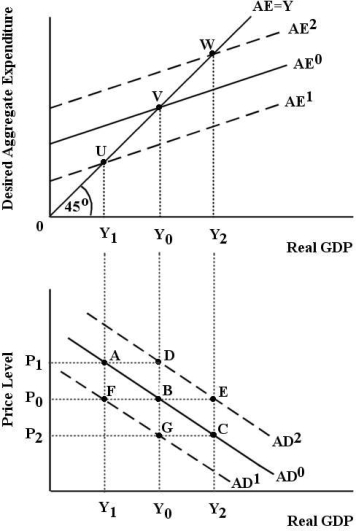 FIGURE 23-1
-Refer to Figure 23-1. Assume the economy is initially in equilibrium with desired aggregate expenditure equal to real GDP at point V. The price level is P0. The corresponding point on the aggregate demand curve is point
FIGURE 23-1
-Refer to Figure 23-1. Assume the economy is initially in equilibrium with desired aggregate expenditure equal to real GDP at point V. The price level is P0. The corresponding point on the aggregate demand curve is point
(Multiple Choice)
4.9/5 (35)
The economyʹs AS curve is often assumed to be relatively flat at low levels of real GDP. The underlying reasoning is that
(Multiple Choice)
4.8/5 (46)
Other things being equal, a fall in the domestic price level leads to a rise in private -sector wealth and thus
(Multiple Choice)
4.7/5 (40)
FIGURE 23-1
-Refer to Figure 23-1. Assume the economy is initially in equilibrium with desired aggregate expenditure equal to real GDP at point V. The price level is P0. Now, suppose the AE curve shifts to AE1 and we move to a new equilibrium level of GDP at Y1 and point A on AD0. A possible cause of this change in equilibrium is
(Multiple Choice)
4.9/5 (36)
Consider the simple multiplier when the price level is constant. We can say that national income is and that the simple multiplier measures the horizontal shift in in response to a change in autonomous desired expenditure.
(Multiple Choice)
4.9/5 (33)
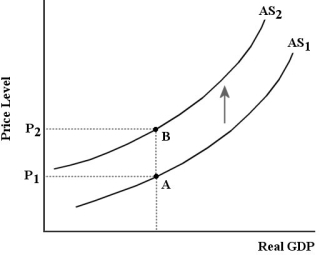 FIGURE 23-2
-Refer to Figure 23-2. Which of the following events could cause the upward shift of the AS curve?
FIGURE 23-2
-Refer to Figure 23-2. Which of the following events could cause the upward shift of the AS curve?
(Multiple Choice)
4.9/5 (38)
Consider a simple macro model with a given price level and demand-determined output. An exogenous change in the domestic price level changes equilibrium real GDP
(Multiple Choice)
4.8/5 (38)
Filters
- Essay(0)
- Multiple Choice(0)
- Short Answer(0)
- True False(0)
- Matching(0)