Exam 4: Elasticity
Exam 1: Economic Issues and Concepts130 Questions
Exam 2: Economic Theories, Data, and Graphs140 Questions
Exam 3: Demand, Supply, and Price161 Questions
Exam 4: Elasticity160 Questions
Exam 5: Price Controls and Market Efficiency125 Questions
Exam 6: Consumer Behaviour140 Questions
Exam 7: Producers in the Short Run144 Questions
Exam 8: Producers in the Long Run141 Questions
Exam 9: Competitive Markets153 Questions
Exam 10: Monopoly, Cartels, and Price Discrimination126 Questions
Exam 11: Imperfect Competition and Strategic Behaviour126 Questions
Exam 12: Economic Efficiency and Public Policy123 Questions
Exam 13: How Factor Markets Work124 Questions
Exam 14: Labour Markets and Income Inequality117 Questions
Exam 16: Market Failures and Government Intervention123 Questions
Exam 17: The Economics of Environmental Protection133 Questions
Exam 18: Taxation and Public Expenditure121 Questions
Exam 19: What Macroeconomics Is All About116 Questions
Exam 20: The Measurement of National Income117 Questions
Exam 21: The Simplest Short-Run Macro Model156 Questions
Exam 22: Adding Government and Trade to the Simple Macro Model132 Questions
Exam 23: Output and Prices in the Short Run142 Questions
Exam 24: From the Short Run to the Long Run: the Adjustment of Factor Prices148 Questions
Exam 25: Long-Run Economic Growth132 Questions
Exam 26: Money and Banking119 Questions
Exam 27: Money, Interest Rates, and Economic Activity135 Questions
Exam 28: Monetary Policy in Canada122 Questions
Exam 29: Inflation and Disinflation123 Questions
Exam 30: Unemployment Fluctuations and the Nairu120 Questions
Exam 31: Government Debt and Deficits129 Questions
Exam 32: The Gains From International Trade127 Questions
Exam 33: Trade Policy126 Questions
Exam 34: Exchange Rates and the Balance of Payments161 Questions
Select questions type
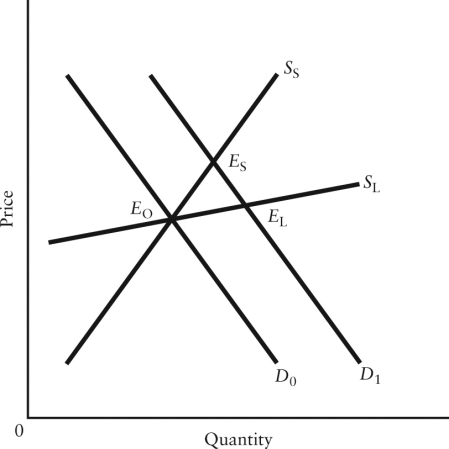 FIGURE 4-3
-Consider an excise tax imposed on daily parking charges in the downtown of a small city. Before the imposition of the tax, equilibrium price and quantity are $15 and 100 cars parked. P = $15, Q = 100). The city government imposes a tax of $3 per car parked per day. Market equilibrium adjusts to P = $16 and Q = 95. After imposition of the tax, what is the daily after -tax price received by the seller per car parked?
FIGURE 4-3
-Consider an excise tax imposed on daily parking charges in the downtown of a small city. Before the imposition of the tax, equilibrium price and quantity are $15 and 100 cars parked. P = $15, Q = 100). The city government imposes a tax of $3 per car parked per day. Market equilibrium adjusts to P = $16 and Q = 95. After imposition of the tax, what is the daily after -tax price received by the seller per car parked?
Free
(Multiple Choice)
4.9/5  (35)
(35)
Correct Answer: Verified
C
Suppose empirical analysis concludes that the income elasticity of demand for Kraft Dinner KD) is -0.2. The interpretation of this result is that
Free
(Multiple Choice)
4.7/5 (35)
Correct Answer:Verified
A
If the total expenditure on cars increases when the price of cars rises, the price elasticity of demand for cars is
Free
(Multiple Choice)
4.8/5 (34)
Correct Answer:Verified
B
There have been proposals that a tax be imposed on sugar-laden soft drinks in an attempt to reduce their consumption. Assume for simplicity that all bottled soft drinks are the same size. Suppose the initial market equilibrium is P = $2.00 and Q = 1000.
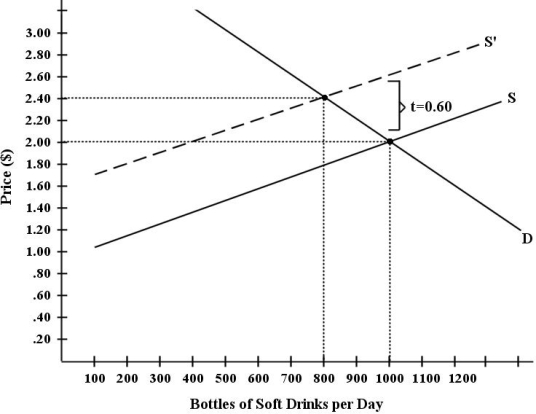 FIGURE 4-4
-Refer to Figure 4-4. Suppose the government imposes a tax of $0.60 per soft drink purchased. The price paid by the consumer becomes
FIGURE 4-4
-Refer to Figure 4-4. Suppose the government imposes a tax of $0.60 per soft drink purchased. The price paid by the consumer becomes
(Multiple Choice)
4.9/5 (33)
Consider the following demand and supply schedules for some agricultural commodity. 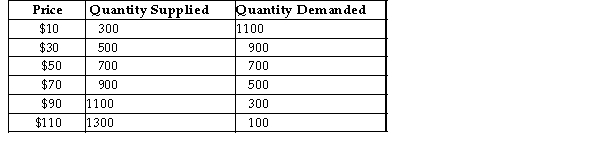 TABLE 5-2
-The price elasticity of demand measures the responsiveness of
TABLE 5-2
-The price elasticity of demand measures the responsiveness of
(Multiple Choice)
4.8/5 (32)
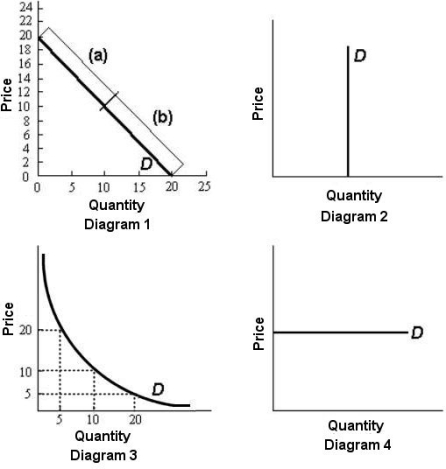 FIGURE 4-2
-Refer to Figure 4-2. In diagram 1, the elasticity of demand over the price range $14 to $16 is
FIGURE 4-2
-Refer to Figure 4-2. In diagram 1, the elasticity of demand over the price range $14 to $16 is
(Multiple Choice)
4.9/5 (44)
The price of apples at a local market rises from $2.95 to $3.05 per kilogram, and as a result the quantity of oranges that households purchase increases from 3950 to 4050 kilograms per week. The cross -price elasticity is
(Multiple Choice)
4.8/5 (37)
What does the following statement imply about price elasticity of demand? ʺGovernment tries to reduce cigarette consumption with an extra 50 cent tax per pack. Policy raises government revenue but fails to curb smoking.ʺ
(Multiple Choice)
4.9/5 (36)
Suppose you are advising the government on changes in the gasoline market. The current price is $1.00 per litre and the quantity demanded is 2.5 million litres per day. Long-run price elasticity of demand is constant at 0.8. If the supply of gasoline is reduced so that the price rises to $1.50 per litre, then quantity demanded is predicted to fall in the long run by
(Multiple Choice)
4.9/5 (38)
 FIGURE 4-2
-Refer to Figure 4-2. As price decreases, total expenditure remains constant in diagrams)
FIGURE 4-2
-Refer to Figure 4-2. As price decreases, total expenditure remains constant in diagrams)
(Multiple Choice)
4.8/5 (39)
Suppose the supply curve for breakfast cereals is upward sloping. Suppose also that as average household income increases we observe a fall in the price of breakfast cereal. We can conclude that breakfast cereal is an)
(Multiple Choice)
4.9/5 (39)
FIGURE 4-3
-Refer to Figure 4-3, which shows a demand shift and the short-run and long-run supply curves for some good. The diagram illustrates the general principle that
(Multiple Choice)
4.8/5 (42)
Consider an excise tax imposed on daily parking charges in the downtown of a small city. Before the imposition of the tax, equilibrium price and quantity are $15 and 100 cars parked per day. P = $15, Q = 100). The city government then imposes a tax of $3 per car parked per day. Market equilibrium adjusts to P = $16 and Q = 95. Which of the following statements about the burden of the tax is correct?
(Multiple Choice)
4.8/5 (34)
If a producer knew his product to be an inferior good and he also knew average household income was falling, he might
(Multiple Choice)
4.9/5 (34)
FIGURE 4-2
-Refer to Figure 4-2. In diagram 3, the elasticity of demand between prices $10 and $20 is
(Multiple Choice)
4.8/5 (46)
Suppose that the quantity of a good demanded rises from 90 units to 110 units when the price falls from $1.20 to 80 cents per unit. The price elasticity of demand for this product is
(Multiple Choice)
4.7/5 (32)
FIGURE 4-3
-The imposition of an excise tax will cause the least burden on consumers when demand is
(Multiple Choice)
4.8/5 (34)
Demand Schedule for Ski Tickets
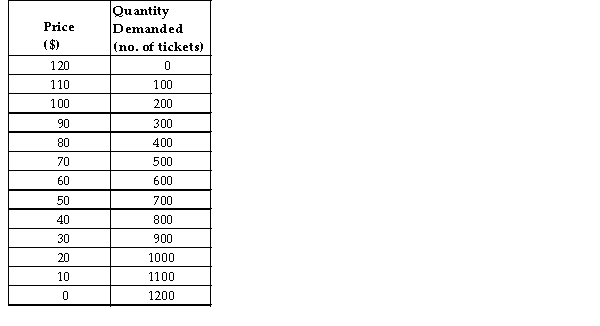 TABLE 4-2
-Refer to Table 4-2. Using the data provided to plot the demand curve for ski tickets results in a
Demand curve. Price elasticity along this demand curve is therefore as price is falling.
TABLE 4-2
-Refer to Table 4-2. Using the data provided to plot the demand curve for ski tickets results in a
Demand curve. Price elasticity along this demand curve is therefore as price is falling.
(Multiple Choice)
4.7/5 (32)
Which of the following statements about price elasticity of demand is true?
(Multiple Choice)
4.8/5 (43)
Filters
- Essay(0)
- Multiple Choice(0)
- Short Answer(0)
- True False(0)
- Matching(0)