Exam 22: Adding Government and Trade to the Simple Macro Model
Exam 1: Economic Issues and Concepts130 Questions
Exam 2: Economic Theories, Data, and Graphs140 Questions
Exam 3: Demand, Supply, and Price161 Questions
Exam 4: Elasticity160 Questions
Exam 5: Price Controls and Market Efficiency125 Questions
Exam 6: Consumer Behaviour140 Questions
Exam 7: Producers in the Short Run144 Questions
Exam 8: Producers in the Long Run141 Questions
Exam 9: Competitive Markets153 Questions
Exam 10: Monopoly, Cartels, and Price Discrimination126 Questions
Exam 11: Imperfect Competition and Strategic Behaviour126 Questions
Exam 12: Economic Efficiency and Public Policy123 Questions
Exam 13: How Factor Markets Work124 Questions
Exam 14: Labour Markets and Income Inequality117 Questions
Exam 16: Market Failures and Government Intervention123 Questions
Exam 17: The Economics of Environmental Protection133 Questions
Exam 18: Taxation and Public Expenditure121 Questions
Exam 19: What Macroeconomics Is All About116 Questions
Exam 20: The Measurement of National Income117 Questions
Exam 21: The Simplest Short-Run Macro Model156 Questions
Exam 22: Adding Government and Trade to the Simple Macro Model132 Questions
Exam 23: Output and Prices in the Short Run142 Questions
Exam 24: From the Short Run to the Long Run: the Adjustment of Factor Prices148 Questions
Exam 25: Long-Run Economic Growth132 Questions
Exam 26: Money and Banking119 Questions
Exam 27: Money, Interest Rates, and Economic Activity135 Questions
Exam 28: Monetary Policy in Canada122 Questions
Exam 29: Inflation and Disinflation123 Questions
Exam 30: Unemployment Fluctuations and the Nairu120 Questions
Exam 31: Government Debt and Deficits129 Questions
Exam 32: The Gains From International Trade127 Questions
Exam 33: Trade Policy126 Questions
Exam 34: Exchange Rates and the Balance of Payments161 Questions
Select questions type
The diagram below shows desired aggregate expenditure for a hypothetical economy. Assume the following features of this economy:
· marginal propensity to consume mpc) = 0.80
· net tax rate t) = 0.15
· no foreign trade
· fixed price level
· all expenditure and income figures are in billions of dollars.
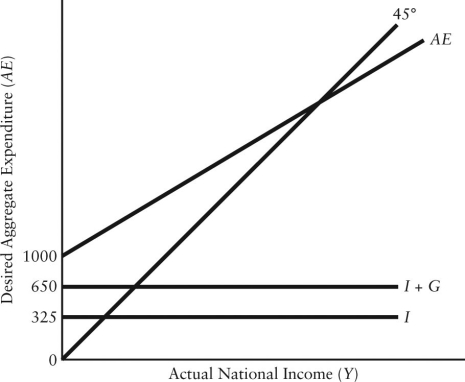 FIGURE 22-3
-Refer to Figure 22-3. Which of the following correctly describes the consumption function for this economy?
FIGURE 22-3
-Refer to Figure 22-3. Which of the following correctly describes the consumption function for this economy?
(Multiple Choice)
4.8/5  (31)
(31)
The diagram below shows desired aggregate expenditure for a hypothetical economy. Assume the following features of this economy:
· marginal propensity to consume mpc) = 0.75
· net tax rate t) = 0.20
· no foreign trade
· fixed price level
· all expenditure and income figures are in billions of dollars. 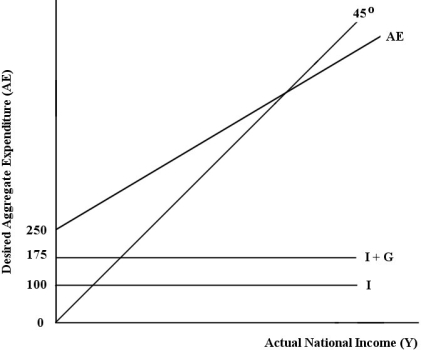 FIGURE 22-2
-Refer to Figure 22-2. What is the value of the multiplier in this economy?
FIGURE 22-2
-Refer to Figure 22-2. What is the value of the multiplier in this economy?
(Multiple Choice)
5.0/5 (37)
Consider a consumption function in a simple macro model with government and taxes. Given a marginal propensity to consume out of disposable income of 0.7 and a net tax rate of 30% of national income, the marginal propensity to consume out of national income is
(Multiple Choice)
4.8/5 (40)
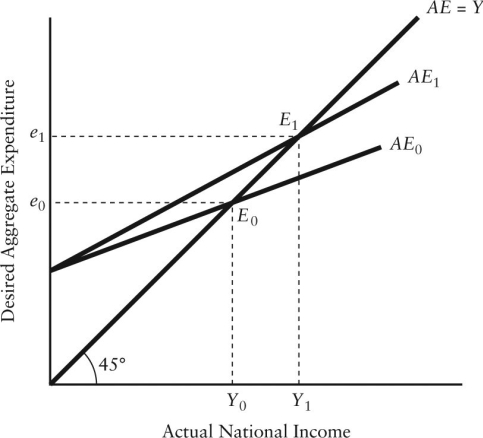 FIGURE 22-4
-Refer to Figure 22-4. The rotation from AE0 to AE1 could be caused by
FIGURE 22-4
-Refer to Figure 22-4. The rotation from AE0 to AE1 could be caused by
(Multiple Choice)
4.8/5 (36)
The diagram below shows desired aggregate expenditure for a hypothetical economy. Assume the following features of this economy:
· marginal propensity to consume mpc) = 0.80
· net tax rate t) = 0.15
· no foreign trade
· fixed price level
· all expenditure and income figures are in billions of dollars.
FIGURE 22-3
-Refer to Figure 22-3. Which of the following equations describes the aggregate expenditure function for this economy?
(Multiple Choice)
4.8/5 (35)
In a macro model where the marginal propensity to consume out of disposable income is 0.8, the net tax rate is 0.25, and the marginal propensity to import is 0.12, the simple multiplier will be
(Multiple Choice)
4.8/5 (37)
Consider an open economy that has a marginal propensity to import equal to 0.30. If national income rises by
$2500, imports will rise by
(Multiple Choice)
4.9/5 (42)
Consider the simplest macro with demand-determined output. If the marginal propensity to consume out of disposable income MPC) is equal to the marginal propensity to spend out of national income z), then
(Multiple Choice)
4.9/5 (41)
Consider a simple macro model with government and demand -determined output. If the government wants to reduce equilibrium national income by $20 billion, G must be
(Multiple Choice)
4.9/5 (39)
The table below shows national income and imports. The level of exports is fixed at $300. All figures in table and questions) are in millions of dollars. 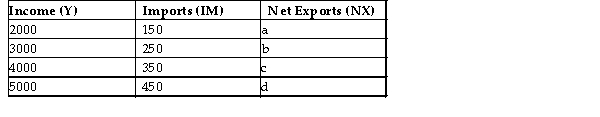 TABLE 22-1
-Refer to Table 22-1. What are the correct values for the level of net exports a, b, c, and d) at each level of national income?
TABLE 22-1
-Refer to Table 22-1. What are the correct values for the level of net exports a, b, c, and d) at each level of national income?
(Multiple Choice)
4.8/5 (36)
The diagrams below show the import, export, and net export functions for an economy.
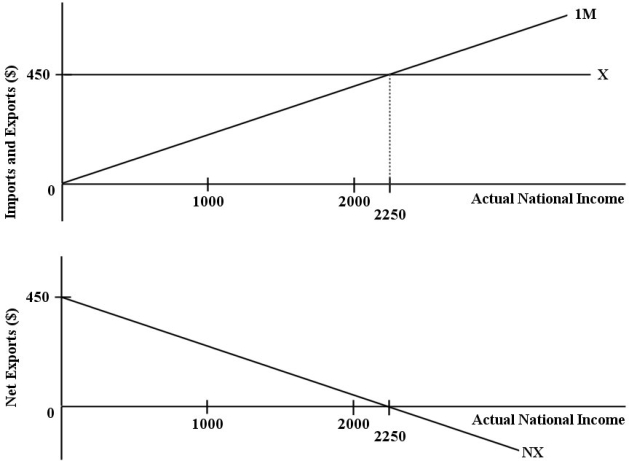 FIGURE 22-1
-Refer to Figure 22-1. The function for desired imports for this economy can be expressed as
FIGURE 22-1
-Refer to Figure 22-1. The function for desired imports for this economy can be expressed as
(Multiple Choice)
4.9/5 (38)
The table below shows national income and imports. The level of exports is fixed at $300. All figures in table and questions) are in millions of dollars. TABLE 22-1
-Refer to Table 22-1. On a graph of the net export function for this economy, at what level of Y would the NX function intersect the horizontal axis?
(Multiple Choice)
4.9/5 (40)
Consider a consumption function in a simple macro model with government and taxes. Given a marginal propensity to consume out of disposable income of 0.9 and a net tax rate of 10% of national income, the marginal propensity to consume out of national income is
(Multiple Choice)
4.9/5 (33)
Consider a simple macro model with a constant price level and demand-determined output. The equations of the model are: C = 150 + 0.84Y, I = 400, G = 700, T = 0, X = 130, IM = 0.08Y. Equilibrium national income is
(Multiple Choice)
4.9/5 (45)
In a simple macro model, the net export NX) function indicates a relationship between net exports and .
(Multiple Choice)
4.8/5 (36)
The diagram below shows desired aggregate expenditure for a hypothetical economy. Assume the following features of this economy:
· marginal propensity to consume mpc) = 0.75
· net tax rate t) = 0.20
· no foreign trade
· fixed price level
· all expenditure and income figures are in billions of dollars.
 FIGURE 22-2
-Refer to Figure 22-2. What is total autonomous expenditure?
FIGURE 22-2
-Refer to Figure 22-2. What is total autonomous expenditure?
(Multiple Choice)
4.9/5 (42)
Consider a simple macro model with a constant price level and demand-determined output. The equations of the model are: C = 120 + 0.86Y, I = 300, G = 520, T = 0, X = 180, IM = 0.12Y. If national income is 2400, then desired aggregate expenditure is
(Multiple Choice)
4.9/5 (48)
The table below shows national income and imports. The level of exports is fixed at $300. All figures in table and questions) are in millions of dollars. TABLE 22-1
-Refer to Table 22-1. What is the marginal propensity to import?
(Multiple Choice)
4.8/5 (34)
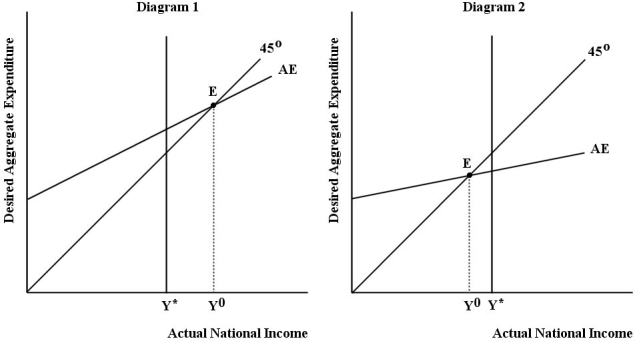 FIGURE 22-5
-Refer to Figure 22-5, Diagram 2. Which of the following fiscal policy measures could the government implement to return national income to the full-employment level of GDP potential output, Y*)?
FIGURE 22-5
-Refer to Figure 22-5, Diagram 2. Which of the following fiscal policy measures could the government implement to return national income to the full-employment level of GDP potential output, Y*)?
(Multiple Choice)
4.9/5 (42)
Consider the simplest macro model with a constant price level and demand -determined output. The equations of the model are: C = 60 + 0.43Y, I = 150, G = 260, T = 0, X = 90, IM = 0.06Y. The marginal propensity to spend on national income, z, is
(Multiple Choice)
4.8/5 (48)
Filters
- Essay(0)
- Multiple Choice(0)
- Short Answer(0)
- True False(0)
- Matching(0)