Exam 4: Elasticity
Exam 1: Economic Issues and Concepts130 Questions
Exam 2: Economic Theories, Data, and Graphs140 Questions
Exam 3: Demand, Supply, and Price161 Questions
Exam 4: Elasticity160 Questions
Exam 5: Price Controls and Market Efficiency125 Questions
Exam 6: Consumer Behaviour140 Questions
Exam 7: Producers in the Short Run144 Questions
Exam 8: Producers in the Long Run141 Questions
Exam 9: Competitive Markets153 Questions
Exam 10: Monopoly, Cartels, and Price Discrimination126 Questions
Exam 11: Imperfect Competition and Strategic Behaviour126 Questions
Exam 12: Economic Efficiency and Public Policy123 Questions
Exam 13: How Factor Markets Work124 Questions
Exam 14: Labour Markets and Income Inequality117 Questions
Exam 16: Market Failures and Government Intervention123 Questions
Exam 17: The Economics of Environmental Protection133 Questions
Exam 18: Taxation and Public Expenditure121 Questions
Exam 19: What Macroeconomics Is All About116 Questions
Exam 20: The Measurement of National Income117 Questions
Exam 21: The Simplest Short-Run Macro Model156 Questions
Exam 22: Adding Government and Trade to the Simple Macro Model132 Questions
Exam 23: Output and Prices in the Short Run142 Questions
Exam 24: From the Short Run to the Long Run: the Adjustment of Factor Prices148 Questions
Exam 25: Long-Run Economic Growth132 Questions
Exam 26: Money and Banking119 Questions
Exam 27: Money, Interest Rates, and Economic Activity135 Questions
Exam 28: Monetary Policy in Canada122 Questions
Exam 29: Inflation and Disinflation123 Questions
Exam 30: Unemployment Fluctuations and the Nairu120 Questions
Exam 31: Government Debt and Deficits129 Questions
Exam 32: The Gains From International Trade127 Questions
Exam 33: Trade Policy126 Questions
Exam 34: Exchange Rates and the Balance of Payments161 Questions
Select questions type
What does the following statement imply about price elasticity of demand? ʺConsumers unfazed by 400 percent increase in price of table salt grocers see no change in sales!ʺ
(Multiple Choice)
4.8/5  (38)
(38)
The table below shows the demand schedule for museum admissions in a small city. 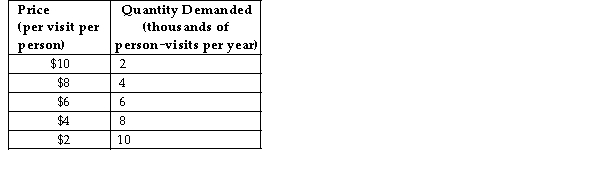 TABLE 4-1
-Refer to Table 4-1. Between the prices of $4 and $6 the price elasticity of demand is
TABLE 4-1
-Refer to Table 4-1. Between the prices of $4 and $6 the price elasticity of demand is
(Multiple Choice)
4.9/5 (34)
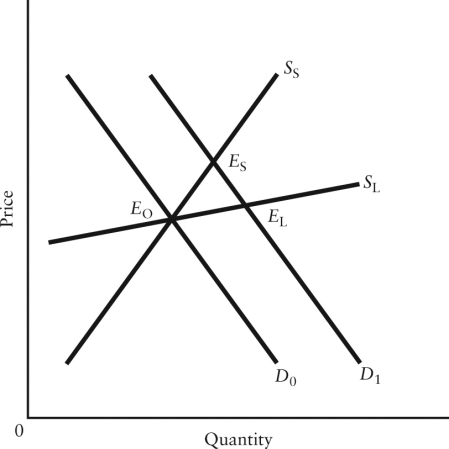 FIGURE 4-3
-The imposition of an excise tax usually causes the price paid by consumers to , while the price received by sellers .
FIGURE 4-3
-The imposition of an excise tax usually causes the price paid by consumers to , while the price received by sellers .
(Multiple Choice)
4.7/5 (31)
Given that elasticity of supply changes over time, in the short run an increase in demand will generally cause
(Multiple Choice)
4.8/5 (48)
When the percentage change in quantity demanded is less than the percentage change in price that brought it about, demand is said to be
(Multiple Choice)
5.0/5 (34)
Which of the following tends to be true of the income elasticity of demand for food?
(Multiple Choice)
4.8/5 (39)
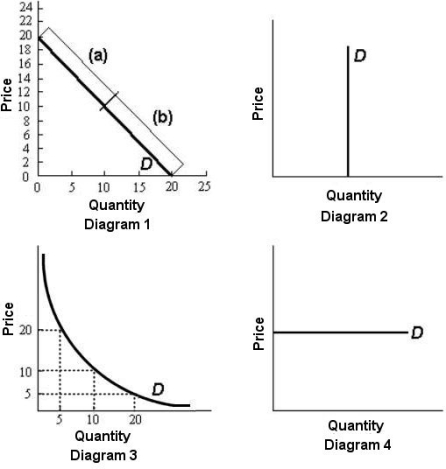 FIGURE 4-2
-Refer to Figure 4-2. The price elasticity of demand is continuously decreasing as the price falls in diagrams)
FIGURE 4-2
-Refer to Figure 4-2. The price elasticity of demand is continuously decreasing as the price falls in diagrams)
(Multiple Choice)
4.9/5 (35)
FIGURE 4-3
-The ʺeconomic incidenceʺ of an excise tax illustrates
(Multiple Choice)
4.8/5 (39)
If a productʹs income elasticity of demand is 1.7, we can conclude that
(Multiple Choice)
4.8/5 (33)
During the 1970s, OPECʹs output restrictions caused gasoline prices to increase sharply. Coincidentally, demand for gas-guzzling cars fell. A likely explanation for these observations is that gasoline and cars had a
Elasticity of demand that was .
(Multiple Choice)
4.9/5 (33)
Suppose a decrease in world demand for potash used in the production of fertilizer) decreases the price from
$400 per tonne to $240 per tonne. Annual Canadian production decreases from 12 million tonnes to 8 million tonnes. What is the elasticity of supply of Canadian potash?
(Multiple Choice)
4.9/5 (36)
The table below shows the demand schedule for museum admissions in a small city. TABLE 4-1
-Refer to Table 4-1. Between the prices of $8 and $10, the elasticity of demand is
(Multiple Choice)
4.9/5 (38)
If the price elasticity of demand for some good is 2.7, a 10% increase in the price results in
(Multiple Choice)
4.8/5 (33)
Suppose the price elasticity of demand for good X is 1.5. If household income increases by 25%, ceteris paribus, what is the change in quantity demanded for good X?
(Multiple Choice)
4.8/5 (37)
Suppose a fast-food chain determines that the price elasticity of demand for its hamburgers is 0.75, and the price of the hamburger is currently $4.00. What will be the effect on quantity demanded and total expenditure on this chainʹs hamburgers if the price is increased to $6.00?
(Multiple Choice)
4.9/5 (47)
Suppose that as the price of some product increases from $4.00 to $5.00 per unit the quantity supplied rises from 500 to 1000 units per month. The price elasticity of supply for this product is
(Multiple Choice)
4.9/5 (45)
FIGURE 4-2
-Refer to Figure 4-2. In diagram 3, the elasticity of demand between prices $5 and $10 is
(Multiple Choice)
4.7/5 (32)
If the income elasticity of demand for a good is 1.25, a 10% increase in income results in
(Multiple Choice)
4.8/5 (42)
Filters
- Essay(0)
- Multiple Choice(0)
- Short Answer(0)
- True False(0)
- Matching(0)