Exam 2: Describing the Distribution of a Variable
Exam 1: Introduction to Business Analytics24 Questions
Exam 2: Describing the Distribution of a Variable73 Questions
Exam 3: Finding Relationships Among Variables56 Questions
Exam 4: Business Intelligence Bifor Data Analysis62 Questions
Exam 5: Probability and Probability Distributions132 Questions
Exam 6: Decision Making Under Uncertainty79 Questions
Exam 7: Sampling and Sampling Distributions78 Questions
Exam 8: Confidence Interval Estimation60 Questions
Exam 9: Hypothesis Testing70 Questions
Exam 10: Regression Analysis: Estimating Relationships80 Questions
Exam 11: Regression Analysis: Statistical Inference69 Questions
Exam 12: Time Series Analysis and Forecasting95 Questions
Exam 13: Introduction to Optimization Modeling70 Questions
Exam 14: Optimization Models87 Questions
Exam 15: Introduction to Simulation Modeling58 Questions
Exam 16: Simulation Models59 Questions
Exam 17: Data Mining30 Questions
Exam 18: Analysis of Variance and Experimental Design24 Questions
Exam 19: Statistical Process Control24 Questions
Select questions type
If a histogram of a data set is symmetric and bell shaped,with a mean of 75 and standard deviation of 10.Then,approximately 95% of the data values will be between 55 and 95.
(True/False)
4.9/5  (40)
(40)
A data set is typically a rectangular array of data,with observations in columns and variables in rows.
(True/False)
4.9/5 (37)
The average score for a class of 30 students was 75.The 20 male students in the class averaged 70.The average score of the 10 female students in the class is _____ the males.
(Multiple Choice)
4.8/5 (29)
A distribution with a high kurtosis has almost all of its observations within three standard deviations of the mean.
(True/False)
4.9/5 (31)
The median is one of the most frequently used measures of variability.
(True/False)
4.9/5 (34)
A histogram is based on binning the variable,which means putting the values of the numeric variable into discrete categories.
(True/False)
5.0/5 (40)
Categorical variables can be classified as either discrete or continuous.
(True/False)
4.8/5 (41)
Without performing any calculations,which of the following data sets has the greatest sample standard deviation?
(Multiple Choice)
4.9/5 (31)
What are the three most common measures of central tendency?
(Multiple Choice)
4.8/5 (42)
The difference between the first and third quartile is called the
(Multiple Choice)
4.8/5 (37)
An operations management professor is interested in how her students performed on her midterm exam.The histogram shown below represents the distribution of exam scores (where the maximum score is 100)for 50 students.
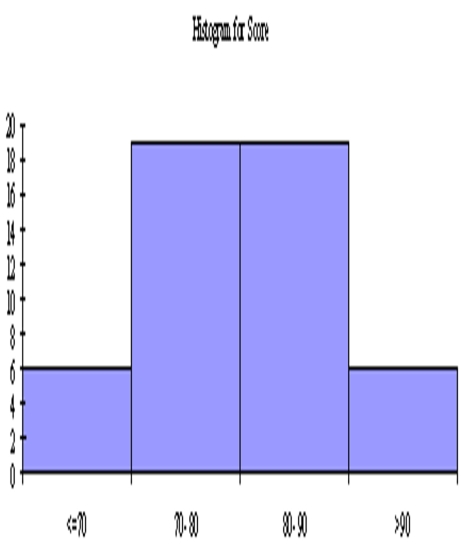
Based on this histogram,how would you characterize the students' performance on this exam?
Based on this histogram,how would you characterize the students' performance on this exam?
(Essay)
4.7/5 (32)
Which of the states listed paid their teachers average salaries that exceed at least 75% of all average salaries?
(Essay)
4.9/5 (37)
Filters
- Essay(0)
- Multiple Choice(0)
- Short Answer(0)
- True False(0)
- Matching(0)