Exam 2: Describing the Distribution of a Variable
Exam 1: Introduction to Business Analytics24 Questions
Exam 2: Describing the Distribution of a Variable73 Questions
Exam 3: Finding Relationships Among Variables56 Questions
Exam 4: Business Intelligence Bifor Data Analysis62 Questions
Exam 5: Probability and Probability Distributions132 Questions
Exam 6: Decision Making Under Uncertainty79 Questions
Exam 7: Sampling and Sampling Distributions78 Questions
Exam 8: Confidence Interval Estimation60 Questions
Exam 9: Hypothesis Testing70 Questions
Exam 10: Regression Analysis: Estimating Relationships80 Questions
Exam 11: Regression Analysis: Statistical Inference69 Questions
Exam 12: Time Series Analysis and Forecasting95 Questions
Exam 13: Introduction to Optimization Modeling70 Questions
Exam 14: Optimization Models87 Questions
Exam 15: Introduction to Simulation Modeling58 Questions
Exam 16: Simulation Models59 Questions
Exam 17: Data Mining30 Questions
Exam 18: Analysis of Variance and Experimental Design24 Questions
Exam 19: Statistical Process Control24 Questions
Select questions type
The value of the mean times the number of observations equals the sum of all of the data values.
Free
(True/False)
4.9/5  (31)
(31)
Correct Answer: Verified
True
The only meaningful way to summarize categorical data is with counts of observations in the categories.
Free
(True/False)
4.8/5 (21)
Correct Answer:Verified
True
The median can also be described as the
Free
(Multiple Choice)
4.8/5 (30)
Correct Answer:Verified
A
The median of a data set with 30 values would be the average of the 15th and the 16th values when the data values are arranged in ascending order.
(True/False)
4.9/5 (28)
Which of the states listed paid their teachers average salaries that are below 75% of all average salaries?
(Essay)
4.9/5 (37)
Unlike histograms,box plots depict only one aspect of a variable.
(True/False)
4.8/5 (41)
Researchers are conducting a review of the "war against poverty" in the latter half of the twentieth century.As part of their analysis,the proportion of Americans under the age of 18 who lived below the poverty line for each of the years 1959 through 2000 is used to generate the following time series plot.
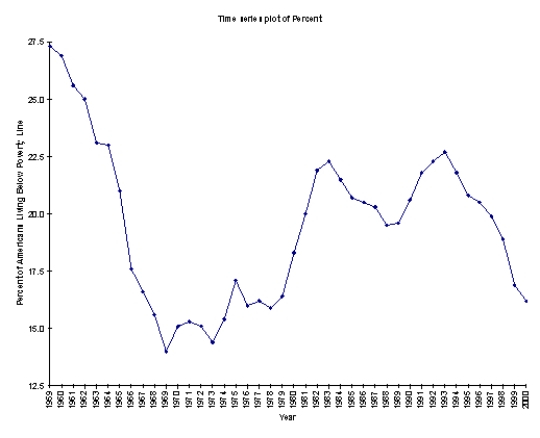 How successful was the United States in its efforts to win "the war against poverty" during the 90's?
(Essay)
4.8/5 (36)
A variable (or field or attribute)is a characteristic of members of a population,whereas an observation (or case or record)is a list of all variable values for a single member of a population.
(True/False)
4.7/5 (40)
Abby has been keeping track of what she spends to stream movies.The last seven week's expenditures,in dollars,were 6,4,8,9,6,12,and 4.The mean amount Abby spent streaming movies over these 7 weeks is $7.
(True/False)
4.7/5 (36)
Two common ways of displaying categorical data is column charts and pie charts.
(True/False)
4.7/5 (37)
The number of car insurance policy holders is an example of a discrete numerical variable.
(True/False)
4.7/5 (37)
The core purpose of time series graphs is to detect historical patterns in the data.
(True/False)
4.7/5 (43)
In a box plot,the asterisk inside the box indicates the location of the
(Multiple Choice)
4.8/5 (32)
Which measure of variability is defined as the maximum value of a data set minus the minimum value of a data set?
(Multiple Choice)
4.8/5 (30)
Data that arise from counts are best described as _____ data.
(Multiple Choice)
4.8/5 (25)
Expressed in percentiles,the interquartile range is the difference between the _____ percentiles.
(Multiple Choice)
4.8/5 (31)
In order for the characteristics of a sample to be generalized to the entire population,the sample should be _____ the population.
(Multiple Choice)
4.9/5 (46)
Filters
- Essay(0)
- Multiple Choice(0)
- Short Answer(0)
- True False(0)
- Matching(0)