Exam 11: Production and Cost Analysis I
Demonstrate graphically and explain verbally why the MC curve always goes through the minimum point of the AVC curve.
The diagram: 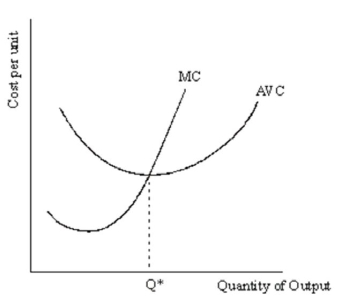 The explanation:
When MC is below AVC, AVC is falling. When MC is above AVC, AVC is rising. The MC curve must pass through the minimum point of the AVC curve at output level Q*, since when MC cuts AVC from below, AVC will begin to rise (and hence the turning point is at output level Q* where MC = AVC).
Define a firm and discuss its roles in the economy.
A firm is an economic institution that transforms factors of production into goods and services. Its roles in the economy are: (1) to organize factors of production; (2) to produce goods and services; and (3) to sell produced goods and services to individuals, businesses, and governments.
Distinguish between the following three phases of production: increasing marginal productivity, diminishing marginal productivity and diminishing absolute productivity.
Increasing marginal productivity is where total output increases at an increasing rate. Diminishing marginal productivity refers to the production phase at which total output increases at a decreasing rate when an additional unit of a variable input is added to an existing fixed input. Diminishing absolute productivity refers to the production phase at which total output actually decreases when an additional unit of a variable input is added to an existing fixed input.
In which part of the production function (increasing marginal productivity, diminishing marginal productivity, or diminishing absolute productivity) is a firm most likely to operate? Explain.
(a) Draw a graph of a typical production function. Your curve should have the proper shape for a production function that has an increasing marginal productivity range, a diminishing marginal productivity range, and a diminishing absolute productivity range. Indicate with dashed vertical lines the level of variable input (labor) at which the transition is made from increasing to diminishing marginal productivity, and the level of variable input (labor) at which the transition is made from diminishing marginal productivity to diminishing absolute productivity.
(b) Directly beneath your production function diagram, draw a diagram with average product and marginal product curves. The horizontal axis of this diagram should be aligned with and use the same scale as the horizontal axis of your production function diagram. Use the reference lines (dashed lines) you drew on your production function graph to properly locate the appropriate points on your marginal product curve.
Explain the relationship between marginal cost (MC) and average total cost (ATC).
(a) Calculate marginal costs, total costs, average fixed costs, average variable costs and average total costs, given the following table. Costs are $100 when there is no production. Round off to the nearest whole number.
Output Variable Cost Marginal Cost Total Cost Average Fixed Cost Average Variable Cost Average Total Cost 0 0 0 1 60 60 2 90 30 3 110 20 4 150 40 5 230 80 6 350 120 7 510 160 8 710 200 (b) Between what levels of output is there increasing marginal productivity?
(c) If labor were the only input to this production process, between what levels of output is the marginal product of labor falling?
You have been hired by the Tootsie Roll Company to analyze their production process. Your predecessor in the position left you with the following table: Number of Workers Total Output (thousands of bags of Tootsie Rolls) Marginal Product Average Product 0 0 1 4 2 10 3 17 4 23 5 28 6 31 7 32 8 32 9 30 10 25 (NOTE: Marginal product represents changes between numbers of workers. Therefore, leave the first row blank in the "Marginal Product" column and put the marginal product from 0 workers to 1 worker in the second row of that column.)
(a) Fill in the blank values in the table above.
(b) Do the values in the table represent short-run or long-run production relationships? Explain.
(c) Are these production values consistent with the law of diminishing marginal productivity? Explain.
(Extra Credit: Between what levels of output is the firm most likely to operate? Explain your answer.)
What are the definitions of the following cost concepts: fixed costs, variable costs, and total cost?
The diagram was intended to illustrate the MC and AVC curves that correspond to each other. Explain why the diagram below is incorrect. 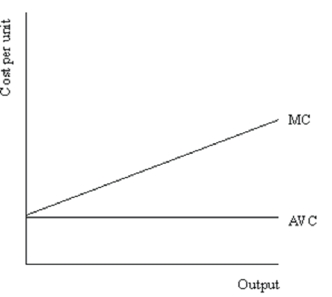
You are given that the total cost of producing 10 units of output is $100 and the fixed costs are $20. Calculate VC, ATC, AFC, and AVC.
Define each of the following cost concepts: fixed costs, variable costs, and total cost and give examples of each. Do they exist in both the short run and the long run?
What are the formulas for the following cost concepts: average total cost, average fixed cost, average variable cost, and marginal cost?
To make sure that you understand the relationships between all of the cost concepts, fill in the missing values in the table below. Output FC VC TC AVC ATC MC 13 1,125 975 14 2,245 15 1,275 16 90 17 161.2 NOTE: Use whole numbers for all values except ATC.
Why does the minimum point of the AVC curve always occur at a lower output level than that at which the ATC curve has its minimum?
What are the formulas for the following cost concepts: average total cost, average fixed cost, average variable cost and marginal cost? Explain why the ATC and AVC curves get closer together as output increases.
Congratulations! You have just been promoted to a new position at the Tootsie Roll Company. In your new position, you have been asked by the accounting department to provide them with some cost data. The basis for your report is a table that was begun by your predecessor. Your task is to fill in the missing values in the table below: 1 2 3 4 5 6 7 8 Output (bags) (FC+VC) AFC (/) AVC (/) ATC (TC/Q) 1 \ 50 \ 86 2 50 96 3 50 100 4 50 106 5 50 120 6 50 147 7 50 182 8 50 230 9 50 290 10 50 360 11 50 440
Imagine that you are currently a college student working at a part time job. You work 15 hours per week as a taco specialist at TACOS! TACOS! TACOS! and earn $8 per hour. One day you realize you're tired of smelling like refried beans all the time and begin thinking about starting your own business. After doing some investigation you decide to spend 15 hours per week running a photocopy service in your dorm. You have determined the following as likely projected expenses and revenues for your first four weeks:
Revenue: $800 (8,000 copies sold at $.10 per copy)
Costs: $400 for photocopy machine rental, $80 for paper (8,000 pages at $.01 per page)
Using this information you decide to start the business. Did you make a wise decision?
Give the definition of marginal product and average product and explain why if the marginal product is smaller than the average product, the average product must be decreasing.
Filters
- Essay(0)
- Multiple Choice(0)
- Short Answer(0)
- True False(0)
- Matching(0)