Exam 26: Aggregate Supply and Aggregate Demand
Exam 1: What Is Economics?198 Questions
Exam 2: The Economic Problem143 Questions
Exam 3: Demand and Supply178 Questions
Exam 4: Elasticity168 Questions
Exam 5: Efficiency and Equity108 Questions
Exam 6: Government Actions in Markets119 Questions
Exam 7: Global Markets in Action129 Questions
Exam 8: Utility and Demand110 Questions
Exam 9: Possibilities, Preferences, and Choices113 Questions
Exam 10: Organizing Production104 Questions
Exam 11: Output and Costs133 Questions
Exam 12: Perfect Competition118 Questions
Exam 13: Monopoly107 Questions
Exam 14: Monopolistic Competition111 Questions
Exam 15: Oligopoly97 Questions
Exam 16: Externalities112 Questions
Exam 17: Public Goods and Common Resources89 Questions
Exam 18: Markets for Factors of Production119 Questions
Exam 19: Economic Inequality117 Questions
Exam 20: Measuring GDP and Economic Growth127 Questions
Exam 21: Monitoring Jobs and Inflation112 Questions
Exam 22: Economic Growth90 Questions
Exam 23: Finance, Saving, and Investment142 Questions
Exam 24: Money, the Price Level, and Inflation115 Questions
Exam 25: The Exchange Rate and the Balance of Payments114 Questions
Exam 26: Aggregate Supply and Aggregate Demand124 Questions
Exam 27: Expenditure Multipliers: The Keynesian Model158 Questions
Exam 28: Canadian Inflation, Unemployment, and Business Cycle101 Questions
Exam 29: Fiscal Policy91 Questions
Exam 30: Monetary Policy88 Questions
Exam 31:International Trade Policy116 Questions
Select questions type
We observe a decrease in the price level and a decrease in real GDP.Which of the following is a possible explanation?
(Multiple Choice)
4.8/5  (38)
(38)
The economy cannot remain indefinitely with real GDP greater than potential GDP because the money wage rate will
(Multiple Choice)
4.9/5 (37)
Which one of the following newspaper quotations describes a leftward shift of the LAS curve?
(Multiple Choice)
4.8/5 (33)
Which one of the following is a reason for the negative slope of the aggregate demand curve?
(Multiple Choice)
4.8/5 (48)
Use the figure below to answer the following questions.
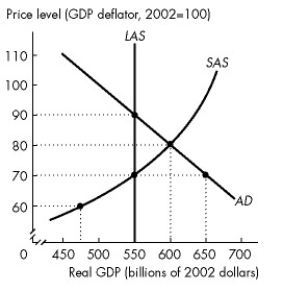 Figure 26.3.2
-Refer to Figure 26.3.2.If the economy of Mythlo automatically adjusts to long-run equilibrium,then
Figure 26.3.2
-Refer to Figure 26.3.2.If the economy of Mythlo automatically adjusts to long-run equilibrium,then
(Multiple Choice)
4.9/5 (37)
Use the figure below to answer the following questions.
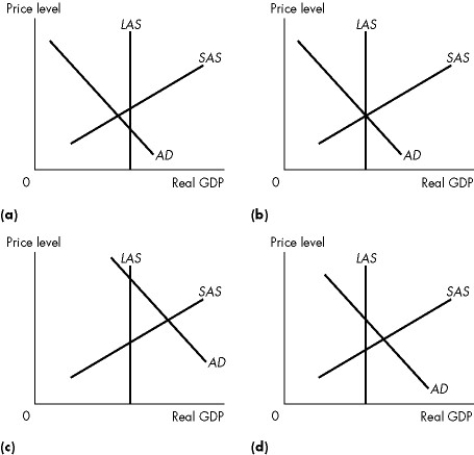 Figure 26.3.3
-Refer to Figure 26.3.3.In which of the graphs would we predict that eventually the price level will rise and real GDP will fall,all else remaining the same?
Figure 26.3.3
-Refer to Figure 26.3.3.In which of the graphs would we predict that eventually the price level will rise and real GDP will fall,all else remaining the same?
(Multiple Choice)
4.9/5 (36)
Use the figure below to answer the following questions.
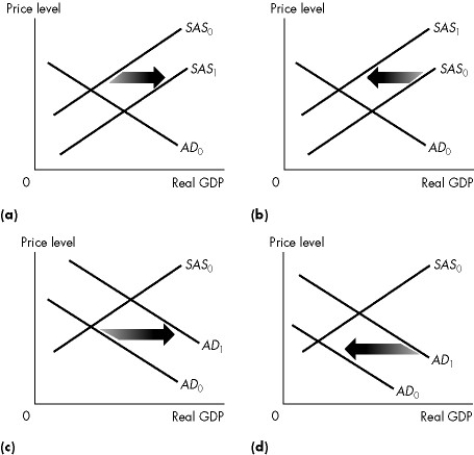 Figure 26.2.1
-Refer to Figure 26.2.1.Which graph illustrates what happens when the quantity of money decreases?
Figure 26.2.1
-Refer to Figure 26.2.1.Which graph illustrates what happens when the quantity of money decreases?
(Multiple Choice)
4.8/5 (31)
Use the figure below to answer the following questions.
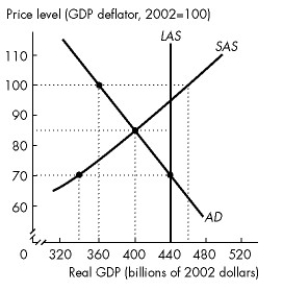 Figure 26.3.1
-Refer to Figure 26.3.1.If Econoworld automatically adjusts to a long-run equilibrium,then in the long-run macroeconomic equilibrium
Figure 26.3.1
-Refer to Figure 26.3.1.If Econoworld automatically adjusts to a long-run equilibrium,then in the long-run macroeconomic equilibrium
(Multiple Choice)
4.7/5 (44)
Use the figure below to answer the following questions.
Figure 26.3.2
-Refer to Figure 26.3.2.In Mythlo there is a difference between the ________ equilibrium real GDP and potential GDP of ________ billion.
(Multiple Choice)
4.7/5 (40)
Use the figure below to answer the following questions.
Figure 26.3.2
-Refer to Figure 26.3.2.As the economy of Mythlo automatically adjusts to long-run equilibrium,the
(Multiple Choice)
4.9/5 (30)
Use the table below to answer the following questions.
Table 26.3.1
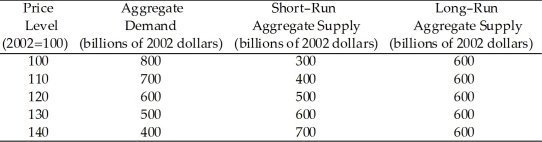 -Refer to Table 26.3.1.Consider the economy represented in the table.The economy is in
(Multiple Choice)
4.8/5 (34)
Which one of the following variables is not held constant along a given aggregate demand curve?
(Multiple Choice)
4.7/5 (41)
We observe an increase in the price level and an increase in real GDP.Which of the following is a possible explanation?
(Multiple Choice)
4.8/5 (34)
Which one of the following newspaper quotations describes a movement along an SAS curve?
(Multiple Choice)
4.8/5 (32)
Use the figure below to answer the following questions.
Figure 26.3.2
-Refer to Figure 26.3.2.Consider statements (1)and (2)and select the correct answer.
(1) The economy of Mythlo is experiencing an above full-employment equilibrium.
(2) SAS will automatically shift rightward as the economy adjusts to long-run equilibrium.
(Multiple Choice)
4.8/5 (32)
Filters
- Essay(0)
- Multiple Choice(0)
- Short Answer(0)
- True False(0)
- Matching(0)