Exam 7: Organizing Data for Effective Analysis
Exam 1: Applying Fundamental Excel Skills and Tools in Problem Solving150 Questions
Exam 2: Solving Problems with Statistical Analysis Tools150 Questions
Exam 3: Determining Effective Data Display with Charts150 Questions
Exam 4: Applying Logic in Decision Making150 Questions
Exam 5: Retrieving Data for Computation, Analysis, and Reference150 Questions
Exam 6: Evaluating the Financial Impact of Loans and Investments150 Questions
Exam 7: Organizing Data for Effective Analysis150 Questions
Exam 8: Using Data Tables and Excel Scenarios for What-If Analysis150 Questions
Exam 9: Enhancing Decision Making with Solver150 Questions
Exam 10: Troubleshooting Workbooks and Automating Excel Applications150 Questions
Select questions type
A PivotChart report represents source data as a(n) graphic. _________________________
Free
(True/False)
4.9/5  (29)
(29)
Correct Answer: Verified
True
You can add a row at the top of a worksheet (called a ____ row) and type labels that identify the data contained in each column.
Free
(Multiple Choice)
4.8/5 (43)
Correct Answer:Verified
C
The term ____________________ is commonly used in the XML community to describe an XML document that is properly structured, and meets established rules and guidelines for how data is described and defined using XML.
Free
(Short Answer)
4.8/5 (34)
Correct Answer:Verified
well-formed
well formed
A(n) ____________________ language uses a set of tags to distinguish different elements in a document, and uses attributes to define those elements further.
(Short Answer)
4.9/5 (35)
Many DBMSs are called absolute database management systems because the data is stored in tables that are related to each other through a common field. _________________________
(True/False)
4.9/5 (25)
A(n) ____________________ is a single characteristic of the entity, such as a product ID number or an address.
(Short Answer)
4.9/5 (28)
The ____ function converts lowercase letters in a text string to uppercase.
(Multiple Choice)
4.9/5 (33)
Unlike a regular chart, you can change the layout and data displayed in a PivotChart report by ____.
(Multiple Choice)
4.8/5 (32)
In a computer application, the term "string" refers to a meaningful sequence of characters.
(True/False)
4.8/5 (33)
Identify the letter of the choice that best matches the date and time function.
-Returns a decimal number for a specific time that is represented by a text string
(Multiple Choice)
4.8/5 (35)
The FIXED function rounds a number to a specified number of decimals and returns the number as text with commas and a period. _________________________
(True/False)
4.8/5 (31)
The CONCATENATE function combines the values in a range of cells into ____ in a new cell.
(Multiple Choice)
4.9/5 (45)
To remove a filter from a column and display all of the data in the Excel table again, click the column's filter arrow, and then click Clear Filter From.
(True/False)
4.8/5 (33)
A database is created by and defined in a database management warehouse (DBW), which is a software program that creates and accesses the data in a database.
(True/False)
4.7/5 (24)
The ____________________ function returns the starting position of one text value within another text value.
(Short Answer)
4.9/5 (31)
The XML data in an XML table functions like the data in an Excel table in that you can _____ the data in the same way.
(Multiple Choice)
4.8/5 (36)
In the FIND function, ____ is the text containing the text that you want to find.
(Multiple Choice)
4.8/5 (39)
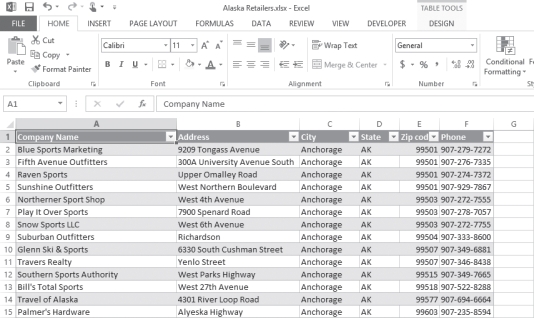 Julie is a sales manager, and she created the table above to organize her customer list. Please refer to the above figure when answering the questions below.
-To create the table as shown in the figure, Julie can click any cell in the worksheet and then the Table button in the Tables group on the ____ tab.
Julie is a sales manager, and she created the table above to organize her customer list. Please refer to the above figure when answering the questions below.
-To create the table as shown in the figure, Julie can click any cell in the worksheet and then the Table button in the Tables group on the ____ tab.
(Multiple Choice)
4.8/5 (42)
Filters
- Essay(0)
- Multiple Choice(0)
- Short Answer(0)
- True False(0)
- Matching(0)