Exam 12: Aggregate Demand and Aggregate Supply
Exam 1: First Principles183 Questions
Exam 2: Economic Models: Trade-Offs and Trade341 Questions
Exam 3: Supply and Demand230 Questions
Exam 4: Price Controls and Quotas: Meddling With Markets187 Questions
Exam 5: International Trade224 Questions
Exam 6: Macroeconomics: the Big Picture128 Questions
Exam 7: GDP and the CPI: Tracking the Macroeconomy213 Questions
Exam 8: Unemployment and Inflation300 Questions
Exam 9: Long-Run Economic Growth268 Questions
Exam 10: Savings, Investment Spending, and the Financial Syst355 Questions
Exam 11: Income and Expenditure114 Questions
Exam 12: Aggregate Demand and Aggregate Supply308 Questions
Exam 13: Fiscal Policy120 Questions
Exam 14: Money, Banking, and the Federal Reserve System135 Questions
Exam 15: Monetary Policy316 Questions
Exam 16: Inflation, Disinflation, and Deflation194 Questions
Exam 17: Macroeconomics: Events and Ideas283 Questions
Exam 18: International Macroeconomics411 Questions
Select questions type
Use the following to answer question 167:
Figure: Macroeconomics Equilibrium 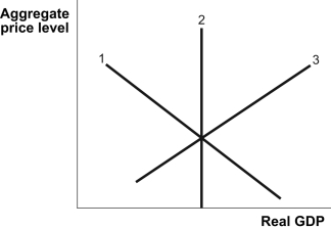 -(Figure: Macroeconomics Equilibrium) Refer to Figure: Macroeconomic Equilibrium. Curve 1 refers to _____, curve 2 refers to _____, and curve 3 refers to _____.
(Multiple Choice)
4.8/5  (37)
(37)
Use the following to answer questions:
Figure: AD-AS 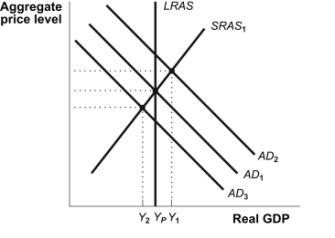 -(Figure: AD-AS) Refer to Figure: AD-AS. Suppose that initially the economy is at long-run equilibrium. If the government cuts taxes, _____ will shift to the _____.
(Multiple Choice)
4.8/5 (38)
In the long run, the aggregate price level has no effect on the quantity of aggregate output supplied.
(True/False)
4.7/5 (32)
The short-run aggregate supply curve has a positive slope, showing that increases in the price level will increase the quantity of aggregate output supplied by firms.
(True/False)
4.8/5 (32)
When the price level decreases, firms in perfectly competitive markets will:
(Multiple Choice)
4.8/5 (38)
The only government policy that has a DIRECT effect on the aggregate demand curve is:
(Multiple Choice)
4.7/5 (40)
Use the following to answer questions:
Figure: Shifts of the AD-AS Curves 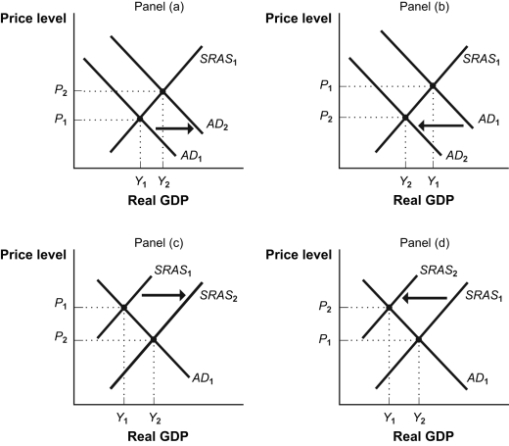 -(Figure: Shifts of the AD-AS Curves) Refer to Figure: Shifts of the AD-AS Curves. A decrease in wages in the short run is illustrated by panel:
(Multiple Choice)
4.8/5 (32)
Which factor will shift the short-run aggregate supply curve to the RIGHT?
(Multiple Choice)
4.9/5 (35)
Use the following to answer questions:
Figure: AD-AS
-(Figure: AD-AS) Refer to Figure: AD-AS. Assume that the economy is in long-run equilibrium. If the Federal Reserve lowers the key interest rate:
(Multiple Choice)
4.9/5 (38)
Use the following to answer questions:
Figure: AD-AS Model II 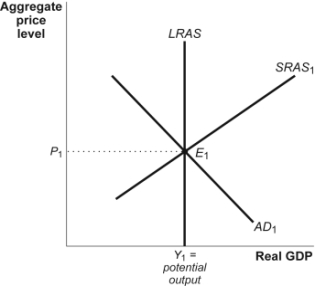 -(Figure: AD-AS Model II) Refer to Figure: AD-AS Model II. If productivity increases, the _____ curve will shift to the _____.
(Multiple Choice)
4.7/5 (33)
If there is an inflationary gap, nominal wages _____, and the _____ curve shifts _____ until the economy reaches long-run equilibrium.
(Multiple Choice)
4.8/5 (37)
In response to a negative supply shock, the government decreases taxes. The MOST likely result of the government's tax decrease is a(n) _____ in unemployment and a(n) _____ in the aggregate price level.
(Multiple Choice)
4.8/5 (31)
Stagflation is the combination of inflation and rising aggregate output.
(True/False)
4.9/5 (44)
Use the following to answer questions:
Figure: An Increase in Aggregate Demand 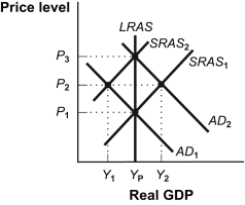 -(Figure: An Increase in Aggregate Demand) Refer to Figure: An Increase in Aggregate Demand. Because of the pressures at the short-run equilibrium at Y2 and P2:
(Multiple Choice)
4.9/5 (41)
The aggregate supply curve shows the relationship between the aggregate price level and the quantity of aggregate output supplied.
(True/False)
4.9/5 (26)
In the short run, the equilibrium price level and the equilibrium level of total output are determined by the intersection of:
(Multiple Choice)
5.0/5 (43)
Filters
- Essay(0)
- Multiple Choice(0)
- Short Answer(0)
- True False(0)
- Matching(0)